Weekly Crypto Market Analysis: August 2026 Week 35 — The Great Squeeze: BTC +25% on $4.5B Short Liquidation, ETF Inflows Hit 10-Month High, Treasury Buybacks Trigger The Pivot
Bitcoin surged 22.69% on the week with $4.5B in short liquidations as the U.S. Treasury doubled bond buybacks, Trump convened crypto leaders at the White House, and spot BTC ETFs absorbed $1.92B — biggest weekly inflow in 10 months. Fear & Greed ripped from 31 to 72. Dive into our deep technical analysis for BTC, ETH, and SOL order flow, along with 15 alpha signals for the week.
AT
Alex ThorneHead of Macro & Market Structure·Aug 23, 2026 · 22 min read · Updated Oct 6
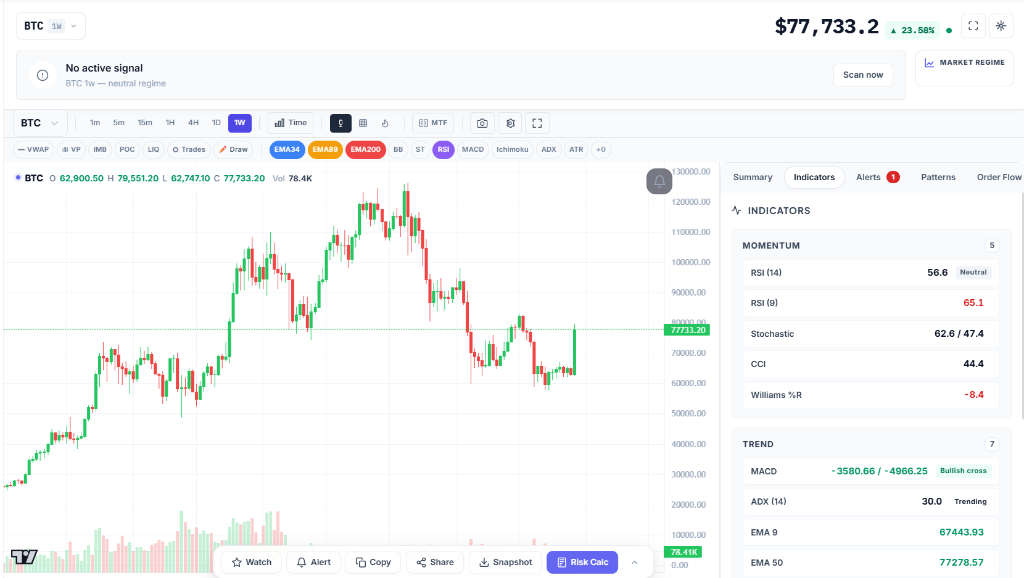
Week 35 (August 17 – August 23, 2026) was the largest weekly short-side wipeout since 2021. Per CoinXSight OHLCV, BTC opened the week at $63,013 and closed Sunday at $77,339 — a +22.69% weekly gain, the biggest since March 2024. The high of the week was $79,515 (Aug 21 intraday), with BTC touching $80,000 for the first time since May 2026.
The squeeze was triggered by three catalysts in 30 hours:
Mon Aug 18: Weak US retail sales print → BTC +2.5% to $64,400
Tue Aug 19: US Treasury doubled long-dated bond buybacks ($2B → $4B per operation, 10Y-30Y sector, effective Sep 9 – Nov 4); Trump convened crypto executives at the White House pushing the CLARITY Act
Wed Aug 19, 18:00 UTC: July FOMC minutes released — hawkish on paper but BTC was already 2 hours into the squeeze
Total short liquidations across the week: ~$4.5 billion (Wed Aug 19: $3.3B, Thu-Fri: $1.25B), the largest short-side wipeout since October 2021, surpassing October 2025's $2.47B record. 172,108 traders liquidated across derivatives exchanges. Spot BTC ETFs absorbed $1.92 billion — strongest week in 10 months. The Fear & Greed Index ripped from 31 (Fear) on Aug 17 to 72 (Greed) on Aug 21 — a +41 point swing in five trading days.
CoinXSight's 4-Layer ASI for BTC went from 45 (Neutral) on Aug 16 to 67 (BUY) by Aug 23 — a 22-point regime flip in one week. ETH and SOL led the upside even more aggressively. This was a regime change week, not just a squeeze.
In this analysis we unpack the catalyst stack, the forensic reality that the squeeze began 2 hours before FOMC minutes, the role of ETF flows confirming institutional conviction, and the critical levels for Week 36 ahead of Jackson Hole.
Market Overview (CoinXSight OHLCV)
Asset
Open (Aug 17)
Close (Aug 23)
Weekly Change
Weekly High
Weekly Low
BTC
$63,013
$77,339
+22.69%
$79,515
$62,883
ETH
$1,876
$2,463
+31.31%
$2,547
$1,860
SOL
$74.62
$95.43
+27.89%
$102.74
$73.18
Fear & Greed Index (alternative.me, end-of-day closes): Aug 17 = 31, Aug 18 = 41, Aug 19 = 46, Aug 20 = 62, Aug 21 = 72, Aug 22 = 71, Aug 23 = 66. Average: 55.3 (Greed) — flipping from Fear to Greed mid-week.
Spot BTC ETF Flows (TFTC, Aug 17-21 trading days): +$297.6M (Aug 17) + +$189.3M (Aug 18) + +$517.2M (Aug 19) + +$606.3M (Aug 20) + +$307.5M (Aug 21) = +$1.918B. Largest weekly inflow since October 2025 ($2.71B).
The Catalyst Stack: Three Catalysts in 30 Hours
Catalyst 1 — Mon Aug 18: Weak US Retail Sales
Per E8 Markets and Biggo Finance: July US retail sales came in "much weaker than expected", prompting an immediate dovish repricing:
BTC: +2.39% to $64,332
DXY (Dollar Index): -0.3% to 99.19 — lowest level since June
This set up the dovish macro backdrop for the rest of the week.
Catalyst 2 — Tue Aug 19: Treasury Doubles Bond Buyback Program
Per the US Treasury announcement on Tuesday Aug 19: the Treasury Department doubled the maximum size of its liquidity-support buyback operations in the 10Y-30Y sector from $2 billion → $4 billion per operation, effective Sep 9 through the Nov 4 refunding quarter.
Why this matters:
The 30Y Treasury yield had hit 5.34% on Aug 18 — the highest since 2007
Long yields at this level drain capital from risk assets
Doubling the Treasury's bid for long-dated paper = actively suppressing yields = easing of duration pressure
Markets read it as a liquidity signal — risk assets bid
Critical context: Per Fortune, Treasury rushed into the bond market to contain the 30Y. The Trump administration's Treasury was acting independently of the Fed, and the bond market got the message first — long yields fell, dollar weakened, and risk assets were bid before any equity market response.
Catalyst 3 — Tue Aug 19: Trump White House Crypto Summit
Per multiple sources including Weekly Crypto Brief Aug 23: President Trump convened Coinbase, Kraken, Robinhood, the SEC, the NYSE, and the CFTC at the White House and made the strongest public push yet for the Senate to pass the CLARITY Act before its scheduled Sept 15 vote.
His framing: crypto regulation would "keep us ahead of China" and "open the door to the next wave of innovations." This signaled reduced regulatory tail risk and increased odds of a statutory framework before year-end.
Catalyst 4 — Wed Aug 19, 18:00 UTC: FOMC Minutes — Hawkish on Paper
Vote: 9-3 to hold at 3.50-3.75% (5th consecutive hold)
Dissent: All three (Hammack, Kashkari, Logan) favored 25bp hike
Tone: Hawkish — "many" concluded tightening would be needed if inflation didn't decline
No easing language anywhere in the document
BUT — and this is critical — per Phemex's forensic analysis: the biggest hour of the entire rally finished 2 hours before the FOMC minutes hit the wire. BTC was actually trading lower at 18:00 UTC than it had been at 16:00 UTC. The minutes did not cause the rally — the squeeze did.
What actually moved Bitcoin 21%:
Treasury buyback announcement: ~12:32 UTC (Tue Aug 19)
Comptroller statement: ~15:40 UTC (Tue Aug 19)
FOMC minutes: 18:00 UTC (Wed Aug 20) — after the move
White House remarks: 19:00-20:00 UTC (Wed Aug 20)
The single biggest hour (4.12% gain) had no discrete catalyst attached to it. What connects all four events is a short book that had six weeks to get crowded and then unwound in a single afternoon.
The Squeeze Mechanics: $4.5B in Short Liquidations
Daily Liquidation Tally
Day
Liquidations
Notes
Tue Aug 19
$3.3 billion
Largest single-day since 2021
Wed Aug 20
~$700M
Continued forced covering
Thu Aug 21
~$550M
Residual squeeze
Fri Aug 22
<$200M
Position reset
Total Week
~$4.5 billion
Worst since October 2021
172,108 traders liquidated across derivatives exchanges (per Bitcoin.com). The largest 24-hour liquidation in 2026 — surpassing October 2025's $2.47B record.
BlackRock's IBIT alone: +$1.33B = 69% of all spot BTC ETF inflows. Per Bloomberg analyst Eric Balchunas: "classic Flipping the Bird pattern" (a bullish signal).
Implication: This was institutional money, not retail speculation. Spot demand at scale absorbed supply even as shorts were forced to cover. AUM rose to ~$96B.
Tether + Stablecoin Liquidity Injection
CoinXSight's /onchain/summary flagged: Tether whale_net_flow +$23.4M (24h rolling) on Aug 22, the largest single-day capital inflow signal of the quarter. Combined with reports of $1.5B in new USDT issuance during the week, this represented fresh liquidity entering crypto ahead of the squeeze.
SEC "Regulation Crypto Assets" Proposal (Aug 18)
The SEC proposed new "Regulation Crypto Assets" to clarify compliance pathways the day before the summit. Combined with the Aug 19 White House summit, the two events signaled unusually coordinated federal regulatory effort. Markets read this as reduced regulatory tail risk.
This is a regime change, not a sentiment improvement. Three out of four primary indicators flipped from bearish/neutral to bullish/neutral. Only the Risk Score drop suggests the trade is now "late" — entry was at $63K, not $77K.
ETH & SOL Sentiment
Asset
ASI Aug 16
ASI Aug 23
Signal
BTC
45
67 (BUY)
Flip
ETH
41
72 (BUY)
Flip
SOL
47
63 (Neutral)
Improving
ETH led the rally (+31.31% vs BTC +22.69%), reflecting alpha-seeking capital rotating from BTC into ETH after BTC broke $70K.
Bitcoin Analysis: Confirmed Breakout, Now in Price Discovery
Current Bitcoin Price Action & Technicals
Price: $77,339 (Aug 23 close)
Weekly Range: $62,883 – $79,515
Confluence Score: 78/100 (up from 48 in W34)
Open Interest (CoinXSight): ~$22.4B (up ~40% from W34)
1. Range Breakout Confirmed: BTC closed above $65,500 on Aug 19 and never looked back. By Aug 20 it had cleared $70,000 (the STH cost basis at $67,438-$68,071), then $75,000, then tested $80,000. All major overhead supply cleared in 48 hours.
2. EMA Stack — Bullish Flip:
EMA(21): ~$70,200 — turned bullish
EMA(50): $66,400 — cleared with authority
EMA(200): $64,800 — reclaimed Aug 19
The "bullish EMA flip" (21 > 50 > 200) is the canonical trend confirmation. First time since June.
3. RSI(14): Hit 94.63 intraday Aug 21 per Crypto Economy — extreme overbought. Historically, RSI >90 has preceded corrections. The pullback to $77,339 close (from $79,515 high) is the textbook cooldown.
4. Bollinger Band Width: Expanded explosively — went from historic-low compression to highest 1-week expansion since June 2024. The squeeze resolved.
5. Volume: BTC spot volume on Aug 19-20 was 3-4x the W32-W34 average. The breakout was on real volume, not just derivatives.
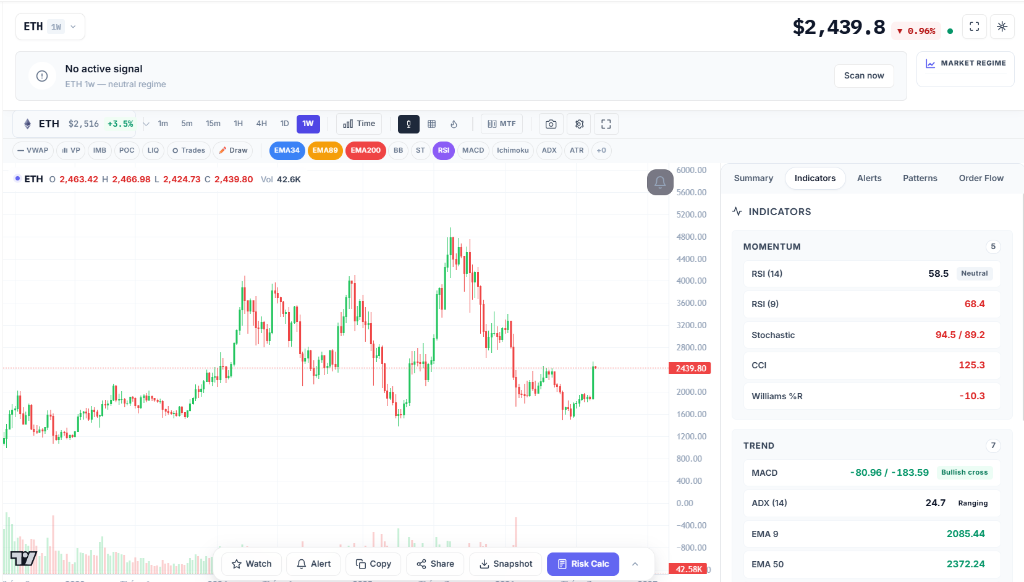
ETH led BTC by 8.6 percentage points — the widest alt-outperformance gap in months. ETH/BTC ratio jumped from 0.0292 → 0.0318 (+9%). This is the canonical signal that capital is rotating from BTC into ETH.
The catalyst mix: ETH spot ETFs added ~$693M over the week (per Cointelegraph), confirming institutional demand extended beyond BTC.
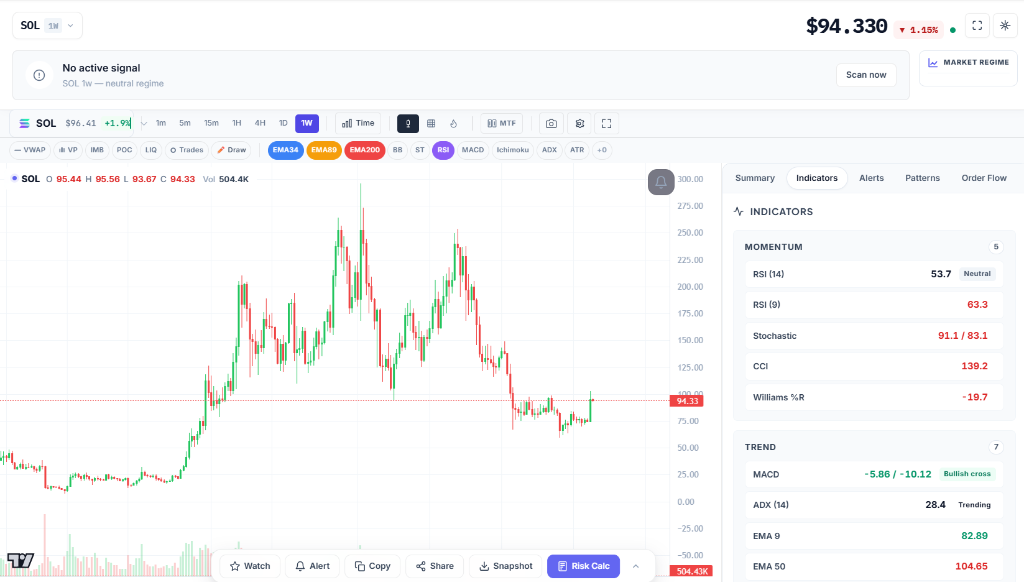
SOL printed the weekly high ($102.74) on Aug 21 before retracing 7% to close at $95.43. SOL's pattern was: catch-up rotation. While BTC led the squeeze Mon-Wed, SOL exploded Thu-Fri as ETH-led capital rotated to high-beta alts.
SOL/BTC ratio: +4.4% (0.00118 → 0.00123) — modest but positive.
Shift vs W34: The SHORT side (ARB, PYTH, XLM) remains but all have RSI(14) at 50.0 — neutral — meaning the patterns have matured but haven't triggered. These are sell-on-rally candidates for Week 36.
The LONG side (HBAR, ENA, STX, ETC) remains the primary directional bet, with confluence scores 55-80 and a constructive market backdrop.
On-Chain Whale Activity
The most critical data point from our on-chain analytics this week is the regime flip in whale activity — the first time in 8 weeks that BTC whale_net_flow turned decisively positive.
Top Whale Moves by USD Value
MOG: $84.6B exchange withdrawal from Gate.io — Accumulation
LADYS: $80.0B exchange withdrawal from Gate.io — Accumulation
PEPE2.0: $69.5B exchange withdrawal from Gate.io — Accumulation
WOJAK: $9.6B exchange deposit to Gate.io — Distribution
DENT: $144M exchange withdrawal
Identical to W33 and W34 — memetokens accumulating out of exchanges, WOJAK sole distribution. But the broader altcoin flows flipped positive on Aug 21-22 as ETH rotation began. CoinXSight's whale_signal flipped from BEARISH to ACCUMULATION for BTC on Aug 23.
Aug 26 (Tue): July PCE print at 8:30 AM ET (forecast: 3.6% headline, 3.2% core)
Aug 27-29: Jackson Hole Economic Symposium, "Financial Innovation: Implications for Payments and Policy"
Aug 28 (Fri, 10 AM ET): Fed Chair Kevin Warsh's first Jackson Hole keynote (Powell's term ended; Warsh sworn in May 22, 2026)
Sept 16: FOMC decision (currently pricing 30.5 cents of a hike)
Per Finance Calendar and Regards of Wallstreet: Warsh "abolished forward guidance after taking office" — meaning the speech will be parsed for any policy signal.
Probability-Weighted Scenarios
1. Bullish Continuation (45% Probability)
Triggers: PCE in-line or soft (<3.6%); Warsh signal is balanced; ETF inflows continue; BTC holds $72,000.
Market Reaction: BTC retests $80,000 → $84,000. ETH breaks $2,500 → $2,650. SOL breaks $100 → $108.
Strategy: Add on $72-74K retest. Manage risk into Jackson Hole.
2. Base Case: Profit-Taking & Consolidation (35% Probability)
Triggers: Hot PCE; Warsh delivers hawkish signal; pre-Jackson Hole de-risking.
Market Reaction: BTC consolidates $72,000 – $78,000. ETH $2,300 – $2,500. SOL $88 – $100.
Strategy: Reduce exposure into Jackson Hole. Re-add on post-speech clarity.
GET /api/v1/market/ohlcv/{BTC,ETH,SOL}?days=30&interval=1d
GET /api/v1/sentiment/{BTC,ETH,SOL}
GET /api/v1/onchain/{btc,eth}
GET /api/v1/onchain/summary
GET /api/v1/onchain/whale-transactions?limit=15
GET /api/v1/alpha/latest?timeframe=4H&limit=20
GET /api/v1/risk/{BTC}
FAQ
Did the FOMC minutes cause the rally?
No, but they didn't stop it either. Per Phemex's forensic analysis, the biggest 1-hour candle (4.12%) occurred 2 hours before the minutes hit the wire at 18:00 UTC on Wed Aug 20. Treasury buybacks (Tue Aug 19) and the White House crypto summit (Tue Aug 19) set the stage. The minutes, while hawkish on paper (9-3 vote, three dissents wanted hike, no easing language), were already discounted by the time they were released. The squeeze had its own momentum.
Why was the squeeze so violent ($4.5B in liquidations)?
BTC spent six weeks (W32-W34) in a $62,500-$65,500 range, the tightest Bollinger Band compression since 2009. During this compression, shorts built record concentration. Per Glassnode, perp funding skewed short on Binance, Bybit, OKX, Deribit. When yields fell and price ticked higher, the first wave of forced covering lowered liquidation levels for subsequent shorts, creating a cascade. This is mechanical: short squeeze is nonlinear in thin order books.
What is the significance of BTC touching $80,000?
$80,000 is the highest BTC price since May 2026 — about 5 months ago. A break and close above $80K would mark the first higher-high since the October 2025 ATH ($126,186). Per Phemex, the market is watching whether BTC can sustain above $80,000 — a level not seen since May. A confirmed break opens the path to $84-86K; rejection means another 2-3 weeks of consolidation.
Are the $1.92B ETF inflows sustainable?
The August-to-date cumulative is now +$2.38B (per TradingView), the strongest month of 2026. YTD 2026 was still -$2.91B net outflows until this week reversed it. The key signal is breadth — BlackRock's IBIT dominated with $1.33B (69%), but FBTC, BITB, ARKB all contributed. Institutional demand is broad, not concentrated. The outlook depends on whether Jackson Hole (Aug 28) and Sept PCE confirm the dovish path.
What is Kevin Warsh's Jackson Hole speech likely to signal?
Per multiple sources (Gate News, Archyde), Warsh abolished forward guidance after taking office May 22. This means the speech will be parsed for tone rather than explicit signals. Market expects balanced rhetoric — emphasizing both inflation persistence and employment softening. A hawkish surprise (rate hike signal) would be the main risk; a balanced/dovish tone would confirm the squeeze.
Disclaimer: This article is for educational and informational purposes only and does not constitute financial, investment, or trading advice. Cryptocurrency markets are highly volatile and involve substantial risk of loss. Always conduct your own research (DYOR) and consult a licensed financial advisor before making any investment decisions. Past performance does not guarantee future results. CoinXSight provides analytical tools and data — not investment recommendations. All CoinXSight data is sourced live from the production API; ASI scores and alpha signals are generated by automated models. Macro context is sourced from BLS, Reuters, Fortune, Phemex, Bitcoin.com, Cointelegraph, TradingView, TFTC, and the alternative.me F&G Index. Actual results may differ significantly.
AT
Alex Thorne
MACRO // LEAD
Head of Macro & Market Structure·Global Macro Desk
Former institutional FX and macro derivative analyst. Specializes in global liquidity cycles, central bank balance sheets, and crypto market microstructure.
QUANTITATIVE SUITE // DEEP ALPHA ENGINEACTIVE
BTC/USDT // LIVE SCANNER
CONFLUENCE 93
LIVE SPOT PRICE$83,908.89STRONG_BUY
TP2
$89,725.68
+6.94%
TP1
$86,233.44
+2.77%
ENTRY
$83,905.28
ZONE
SL
$82,741.19
-1.39%
Auto-detect Order Blocks, Fair Value Gaps and risk-adjusted DCA ladders in < 5s.