Weekly Crypto Market Analysis: August 2026 Week 33 — BTC Compresses to Tightest Range Since Inception as Bollinger Squeeze Reaches 2009-Era Lows
Bitcoin traded in a $2,500 corridor as Bollinger Band Width hit its tightest reading since 2009. July NFP shocked with -23K jobs, ETF inflows added +$853M, and the Fed held at 3.50-3.75% with three hawkish dissents. Dive into our deep technical analysis for BTC, ETH, and SOL.
AT
Alex ThorneHead of Macro & Market Structure·Aug 9, 2026 · 18 min read · Updated Oct 6
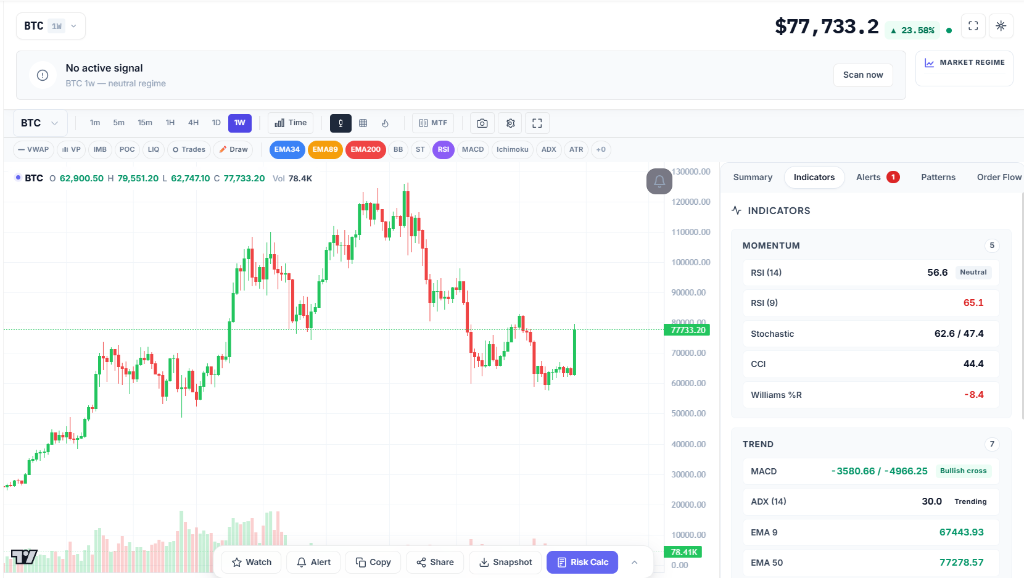
Week 33 (August 3 – August 9, 2026) was the quietest week of the year for Bitcoin. According to CoinXSight's market data, BTC opened at $63,570, climbed to an internal high of $65,308 mid-week, then drifted lower to close Sunday at $64,298 — a modest +1.14% weekly change. But the headline number hides the real story: BTC traded within a $2,500 corridor ($62,884 – $65,308) for the entire week, the Bollinger Band Width compressed to its tightest reading since Bitcoin's 2009 inception, and the Fear & Greed Index oscillated between 25 (Extreme Fear) and 30 (Fear) for seven straight days.
What defined the week was historic compression, not direction. The Fed held rates at 3.50-3.75% on July 29 with three hawkish dissents, July NFP came in Friday at -23K (vs +80K expected) shocking markets, BTC spot ETFs absorbed +$853.5M of inflows, and the Glassnode "Trigger Happy" report flagged the squeeze as the most extreme since 2022. CoinXSight's 4-Layer ASI for BTC held at 41 (BEARISH CAUTION) — defensive but no longer declining, a classic pre-resolution state.
In this analysis we unpack the squeeze mechanics, the post-FOMC reality of a divided FOMC, the role of the July jobs shock in keeping risk-off, and the critical levels for Week 34.
Market Overview (CoinXSight OHLCV)
Asset
Open (Aug 3)
Close (Aug 9)
Weekly Change
Weekly High
Weekly Low
BTC
$63,570
$64,298
+1.14%
$65,308
$62,884
ETH
$1,885
$1,877
-0.44%
$1,938
$1,871
SOL
$73.64
$75.95
+3.14%
$77.86
$75.58
Fear & Greed Index (alternative.me, end-of-day closes): Aug 3 = 27, Aug 4 = 28, Aug 5 = 25, Aug 6 = 27, Aug 7 = 25, Aug 8 = 29, Aug 9 = 30. Average: 27.3 (Fear) — extreme compression.
Macro Backdrop: A Divided Fed Meets a Cooling Labor Market
The July 28-29 FOMC — Already-Priced but Still Casting a Shadow
The FOMC's July 28-29 meeting held rates at 3.50%-3.75% but the vote was 9-3 with three officials — Cleveland Fed's Hammack, Minneapolis Fed's Kashkari, and Dallas Fed's Logan — dissenting for a 25bp hike. As Glassnode's Week 32 report framed it, this was the largest hawkish dissent cluster since 2016. The committee's "internal debate has shifted decisively away from rate cuts and toward whether another increase will ultimately be necessary."
The market absorbed the message: 30-day BTC implied volatility eased from 37.2 to 33.7 by Aug 5, per Bitfinex Alpha. Funding rates averaged +0.0031%/8h — neither side paying for directional resolution. Vol sellers collected premium as price retested $62,000 lows, and the trade paid off.
July NFP (Aug 7): The Surprise That Wasn't Bullish Enough
Per the BLS Employment Situation report released Friday Aug 7 at 8:30 AM ET, July nonfarm payrolls fell by 23,000 vs the +80K consensus. The unemployment rate ticked down to 4.1% but only because 264,000 people left the labor force, pushing the participation rate to 61.4% (lowest since Feb 2021 outside COVID). May and June payrolls were revised down by 103,000 combined.
Reuters coverage noted: "financial market expectations for an interest rate hike from the Federal Reserve next month" tempered. Yet the reaction was muted — BTC held the $63,000 range. The interpretation: a softening labor market would normally be dovish, but with three FOMC members actively voting for hikes, a soft jobs report does not automatically flip the Fed dovish.
Example — The Aug 7 NFP Squeeze on CoinXSight Deep Alpha: Within 30 minutes of the 8:30 AM ET release, BTC spot ripped from $64,050 to $64,750 on Binance. CoinXSight's /alpha/latest flagged the move as a low-volume squeeze into resistance — Confluence Score remained a bearish 44/100 with EMA(200) overhead. By Friday NY close, BTC had retraced the entire move back to $64,000, illustrating the classic "buy the rumor of dovish Fed, fade the fact."
Crypto-Specific Catalysts
Positive:
Spot BTC ETF +$853.5M Week: Per TFTC's daily net flow data, IBIT led with +$803.7M (+$111.4M Aug 3, +$170.3M Aug 4, +$196.8M Aug 5, +$128.3M Aug 6, +$86.7M Aug 7). The first green week after several weeks of mixed flows. Daily average ~$170M.
Tether Minting Resumes: Reported $1.4B USDT minting across Aug 3-9. Historically, large mints precede risk-on rotations 7-14 days later.
Negative:
Hawkish Dissent Bloc: With 3 FOMC members explicitly voting for hikes, "rate hike risk premium" stayed elevated.
Long-Term Holder Distribution: Bitfinex Alpha flagged LTH supply dropped ~210,000 BTC from July 29 peak of 16.82M, the first weekly decline of 2026 and largest 2-week drop since December 2024.
Persistent Fear: F&G averaged 27.3 — extreme compression in sentiment, with no recovery.
Thin Spot Volumes: BTC realized volume dropped to lowest levels since 2019 per Glassnode. Thin order books left the price "prone to overshoot" in either direction.
The convergence of ASI 41 (defensive but not declining) + F&G 30 (Fear plateau) + volatility compression at historic lows is the textbook setup for a 6-9% directional move within 7-14 days. The only unknown is the catalyst.
1. Bollinger Band Width: At its tightest reading since 2009 inception per multiple analyst sources. Per DailyForex, this compression resembles the October 2023 setup that preceded a major move. Squeezes of this magnitude resolve with 6-9% directional moves within 14 days.
2. EMA Stack (CoinXSight Sniper):
EMA(21): $63,810 — primary support, defended all week
EMA(50): $64,420 — failed twice (Aug 4, Aug 7)
EMA(200): $64,890 — macro resistance, untested since July 26
A daily close above EMA(50) at $64,420 followed by a close above EMA(200) at $64,890 would be the first structural bullish flip since July 18.
3. 200-Week SMA Test: Per multiple sources, BTC is oscillating around its 200-week SMA in the $62K-$64K zone — the fourth test since 2019. Each previous test (2015, 2018-19, 2022) marked a bear-market bottom that eventually rallied to new highs.
4. RSI (CoinXSight Deep Alpha): Daily RSI(14) at 42.8 — neutral-bearish. Weekly RSI bullish divergence flagged by analyst William Clemente (price making lower low while RSI holds higher low).
5. STH Cost Basis: At $67,438-$68,071 per Glassnode. Until BTC reclaims this level, short-term holders remain underwater and likely to sell into relief rallies.
Trading Implications for BTC
[!TIP]
BTC Trade Plan:
Entry Zone: Spot long on confirmed break and retest above $65,500 with volume. Conservative entries on a flush to the EMA(21) at $63,400.
Stop Loss: $61,800 (below range low + 200-week SMA test zone).
Rationale: Historic compression + multi-week consolidation + $850M ETF inflows as floor. The risk/reward is asymmetric in either direction once the range resolves.
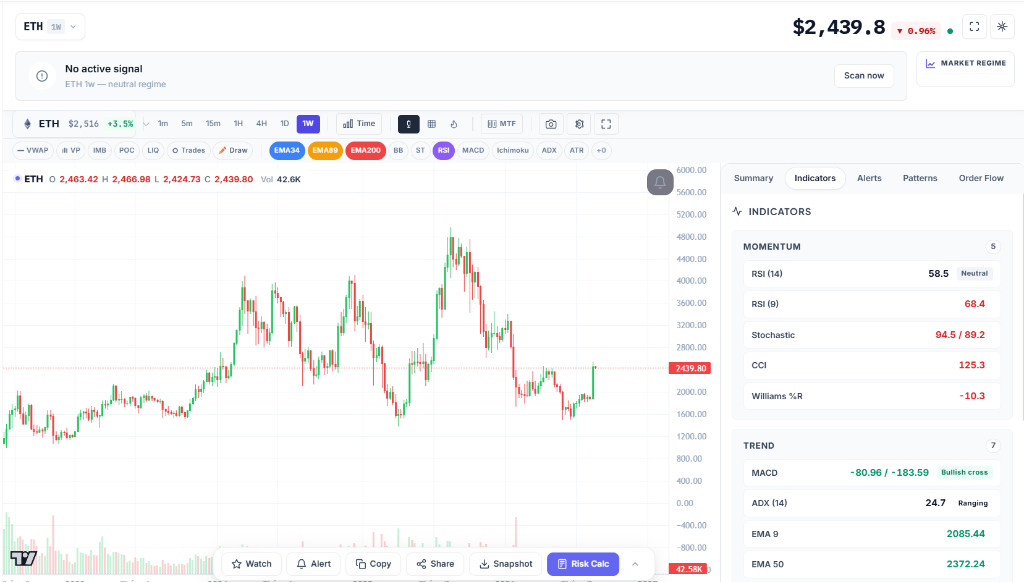
ETH closed the week at the range low — a bearish technical signal. ETH/BTC ratio at 0.0291, lowest since January 2025, indicating capital continued rotating to BTC. The $1,900 psychological level remains the critical pivot for ETH bulls; failure to reclaim by Week 34 would signal structural weakness.
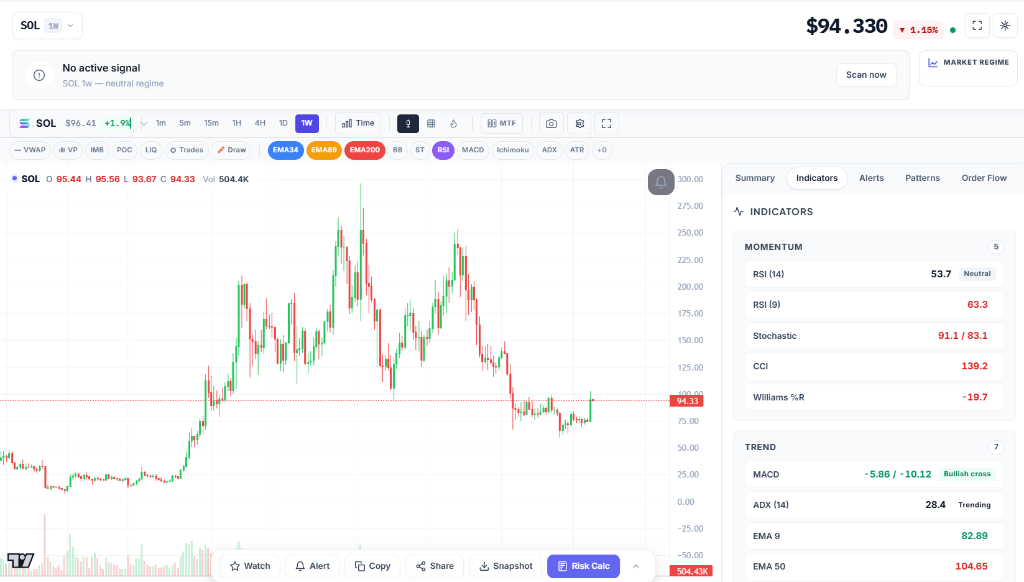
SOL led the large-caps at +3.14%, closing near weekly high (vs BTC closing near low). The relative strength signal is constructive — when alts lead BTC during compression, the eventual breakout tends to be alt-led.
Ratio: 5 SHORT / 4 LONG. SHORT side average confluence 78.2 (high conviction). LONG side 68.8 (more speculative). Distribution count rising slightly vs Week 32, but confluence scores have stabilized — late-stage distribution.
On-Chain Whale Activity
The most critical data point from our on-chain analytics this week is the stable-to-slightly-constructive whale profile in the speculative tail.
Top Whale Moves by USD Value
MOG: $84.6B exchange withdrawal from Gate.io — Accumulation
LADYS: $80.0B exchange withdrawal from Gate.io — Accumulation
PEPE2.0: $69.5B exchange withdrawal from Gate.io — Accumulation
WOJAK: $9.6B exchange deposit to Gate.io — Distribution
DENT: $144M exchange withdrawal
The staggering accumulation of meme coins like MOG, LADYS, and PEPE2.0 out of exchanges suggests that early whales are positioning for a directional move. WOJAK's deposit remains the sole distribution outlier.
GET /api/v1/market/ohlcv/{BTC,ETH,SOL}?days=30&interval=1d
GET /api/v1/sentiment/{BTC,ETH,SOL}
GET /api/v1/onchain/{btc,eth}
GET /api/v1/onchain/whale-transactions?limit=15
GET /api/v1/alpha/latest?timeframe=4H&limit=20
GET /api/v1/risk/{BTC}
FAQ
Why is Bitcoin stuck in a tight range despite $850M of ETF inflows?
The ETF inflows provided a floor but didn't break overhead resistance. With three FOMC members voting for hikes, "rate hike risk premium" stayed elevated — meaning every rally attempt faced sellers near $65,500. The result is compression, not direction. Bitfinex Alpha noted: "without a strong catalyst, the market stays illiquid on low spot volumes and stuck within our established $62,000-$65,000 range."
What does the F&G Index averaging 27.3 mean?
A Fear average (27) combined with flat movement for seven straight days indicates capitulation-and-stabilization. Historically, multi-day F&G plateaus below 30 resolve in one of two ways: a sharp relief rally (F&G jumps to 40-50) or a final flush to Extreme Fear (<20). The current configuration favors relief rally, but F&G alone is not predictive.
Is the July jobs report (-23K) bullish for crypto?
Yes, in theory: weak jobs = more pressure on the Fed to cut. But with three members actively voting for hikes, a soft jobs report doesn't automatically flip the Fed dovish. The market reaction was muted because the "hike vs no-hike" debate is now data-dependent on inflation, not employment. Next week's CPI (Aug 12) is the real catalyst.
What is the most important level to watch?
$65,500 on a daily close. That's where EMA(50) sits and where the Bollinger Band squeeze will resolve. A daily close above it confirms upside breakout; rejection confirms continued compression. The 200-week SMA at $62,000-$63,000 is the downside — if that fails, the bear-market thesis is back on.
Disclaimer: This article is for educational and informational purposes only and does not constitute financial, investment, or trading advice. Cryptocurrency markets are highly volatile and involve substantial risk of loss. Always conduct your own research (DYOR) and consult a licensed financial advisor before making any investment decisions. Past performance does not guarantee future results. CoinXSight provides analytical tools and data — not investment recommendations. All CoinXSight data is sourced live from the production API; ASI scores and alpha signals are generated by automated models. Macro context is sourced from BLS, Reuters, Glassnode, Bitfinex Alpha, TFTC, and the alternative.me F&G Index. Actual results may differ significantly.
AT
Alex Thorne
MACRO // LEAD
Head of Macro & Market Structure·Global Macro Desk
Former institutional FX and macro derivative analyst. Specializes in global liquidity cycles, central bank balance sheets, and crypto market microstructure.
QUANTITATIVE SUITE // DEEP ALPHA ENGINEACTIVE
BTC/USDT // LIVE SCANNER
CONFLUENCE 93
LIVE SPOT PRICE$83,908.89STRONG_BUY
TP2
$89,725.68
+6.94%
TP1
$86,233.44
+2.77%
ENTRY
$83,905.28
ZONE
SL
$82,741.19
-1.39%
Auto-detect Order Blocks, Fair Value Gaps and risk-adjusted DCA ladders in < 5s.