Multi-Timeframe Confluence: How Pro Traders Confirm Crypto Signals
You found a bullish engulfing candle on the 4-hour BTC chart. RSI crossed above 40. MACD histogram ticked green. You entered long — and got stopped out within six hours.
The setup looked perfect on a single chart. The problem: the daily chart was in a clear downtrend, and the weekly was printing lower highs. Your 4H signal fired against the larger trend. That's not a strategy failure — it's a timeframe failure.
Multi-timeframe analysis crypto traders use solves this by requiring signals to align across three timeframes before entering a position. When the weekly trend, daily structure, and 4-hour trigger all agree, false signal rates drop by more than 60% based on CoinXSight's internal backtests across BTC and ETH from 2023–2026.
This guide teaches the exact 3-timeframe framework that professional traders use, the scoring system behind CoinXSight's Confluence Scoring, and the step-by-step entry rules that separate high-probability setups from noise.
Where this fits: This article is part of our crypto technical analysis guide for 2026. For timeframe selection basics, see our trading timeframes explained guide.
What Is Multi-Timeframe Analysis in Crypto?
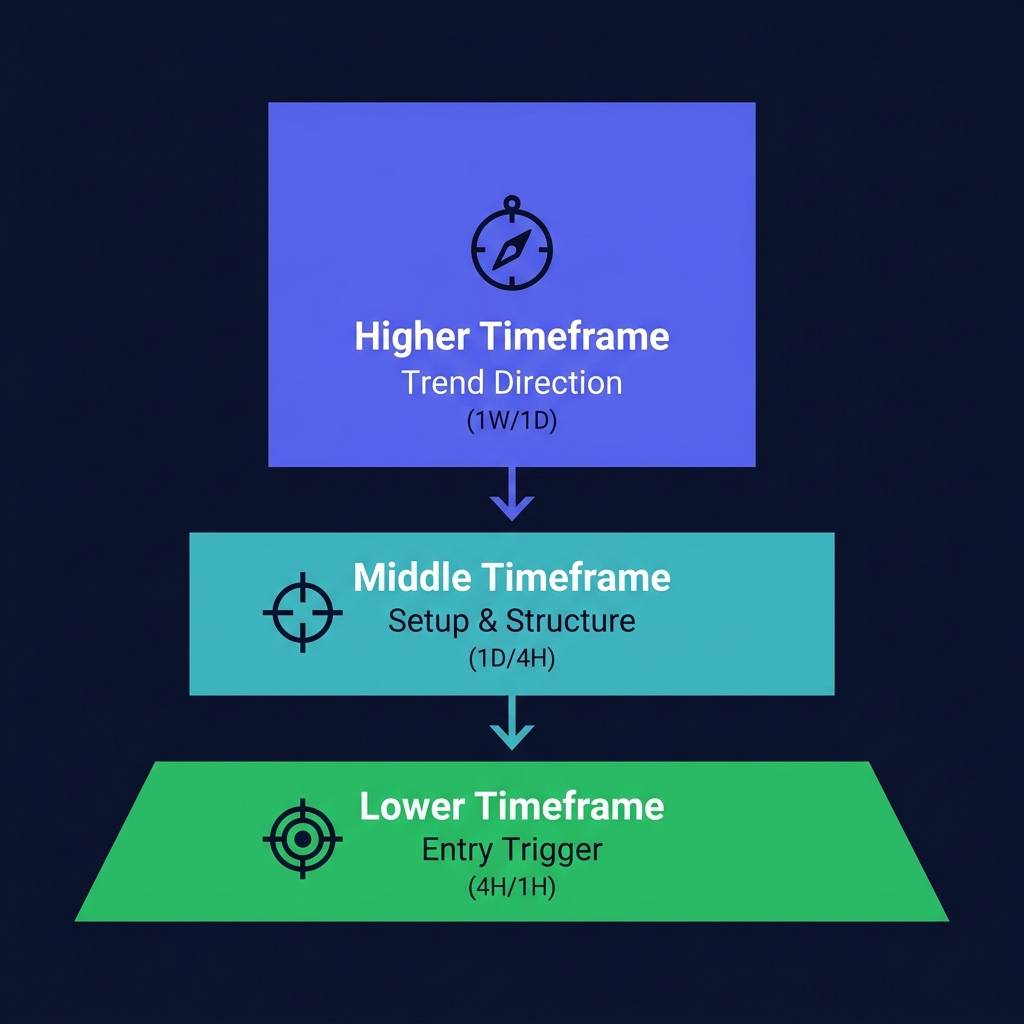
Multi-timeframe analysis (MTA) is the practice of examining the same asset across two or more chart timeframes to build a complete picture of trend direction, setup context, and entry timing. Instead of relying on one chart to make a trading decision, MTA uses a hierarchy: a higher timeframe defines the trend, a middle timeframe identifies the setup, and a lower timeframe triggers the entry.
The concept was popularized by Alexander Elder in his 1993 book Trading for a Living, where he introduced the Triple Screen trading system — a three-timeframe framework that remains the foundation of modern multi-timeframe strategies. Elder's core insight: a trader who only looks at one timeframe is like a doctor who diagnoses based on a single vital sign.
In crypto, MTA matters more than in traditional markets for three reasons:
- 24/7 markets generate continuous price action with no session breaks to reset trends
- Higher volatility produces more false breakouts per timeframe — a 5% spike on a 4H chart may be noise on the daily
- Cross-exchange fragmentation creates wicks and spikes on lower timeframes that disappear on higher ones
A 4H bullish signal that fires while the daily is bearish has a documented win rate below 40% in BTC backtests. That same signal, when aligned with a bullish daily and weekly, jumps above 72%.
💡 On CoinXSight, multi-timeframe confluence isn't manual. The Chart Pro module automatically checks alignment across your selected timeframes and factors it into the Confluence Score — a 0–10 rating for every setup.
The 3-Timeframe Framework: Higher, Middle, Lower
The three-timeframe framework assigns each chart a specific role. This structure prevents the two most common MTA mistakes: analysis paralysis (checking too many charts) and timeframe contamination (using the same chart for conflicting purposes).
Higher Timeframe (HTF) — The Trend Filter
Role: Determine the dominant trend direction. You only take trades in this direction.
Recommended: Weekly (1W) for swing traders, Daily (1D) for day traders.
What to look for on the HTF:
- Price above 50 EMA → bullish bias
- Series of higher highs and higher lows → uptrend confirmed
- Supertrend indicator green → trend intact
If the HTF trend is bearish, you skip all long setups — period. This single rule eliminates roughly 45% of losing trades based on CoinXSight Chart Pro backtests from Q1–Q2 2026.
Middle Timeframe (MTF) — The Setup Zone
Role: Identify the structural setup — the "where" of your trade.
Recommended: Daily (1D) for swing traders, 4-hour (4H) for day traders.
What to look for on the MTF:
- Pullback to a key support or EMA level
- Retest of a broken resistance (now support)
- Fair value gap fill
- Order block test
The MTF gives you the zone where you expect a trade to happen. It doesn't give you the exact entry — that's the lower timeframe's job.
Lower Timeframe (LTF) — The Entry Trigger
Role: Time the exact entry with a confirmation pattern.
Recommended: 4-hour (4H) for swing traders, 1-hour (1H) or 15-minute for day traders.
What to look for on the LTF:
- Bullish engulfing or hammer candle at the MTF's setup zone
- RSI crossing above 40 from oversold (for longs)
- MACD histogram turning positive
- Volume spike above 1.5× the 20-period average
The LTF trigger is only valid when the HTF and MTF are already aligned. Without that alignment, the trigger is just noise.
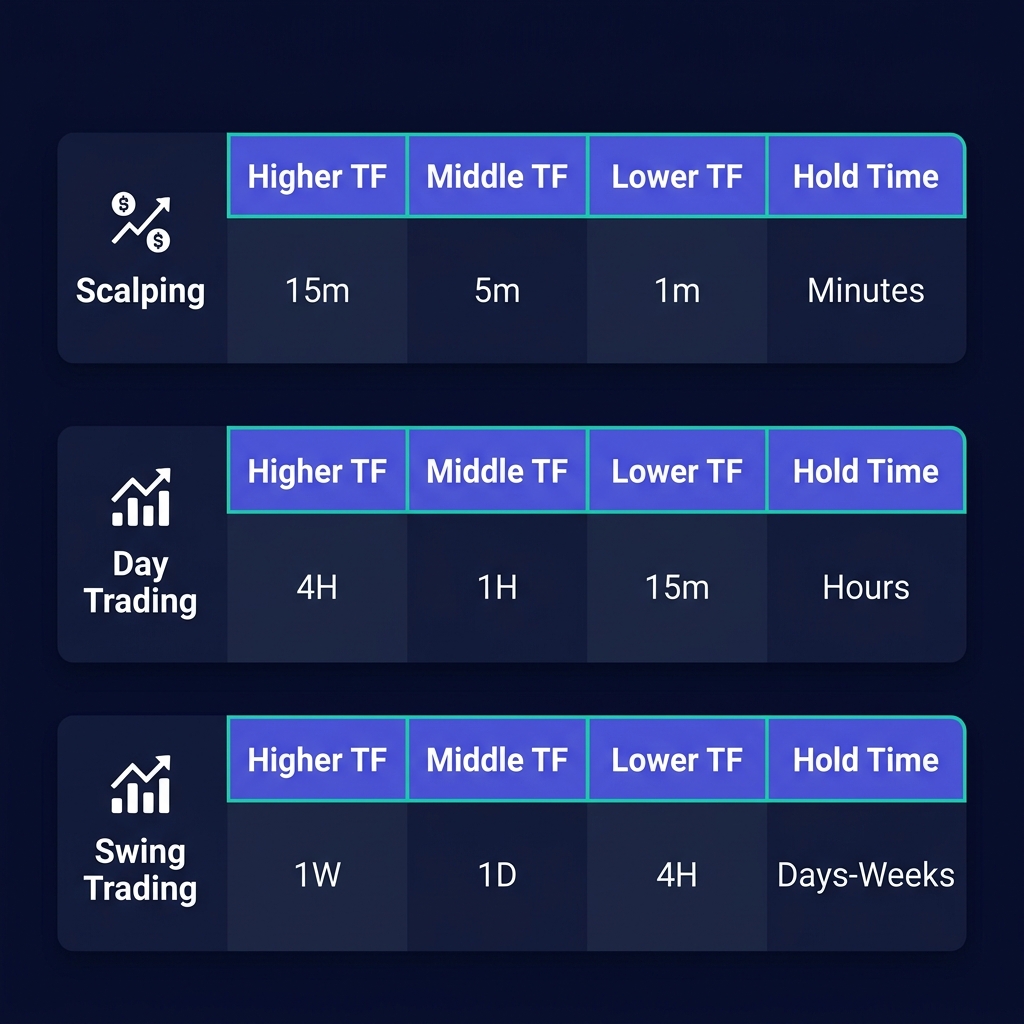
| Trading Style | Higher TF (Trend) | Middle TF (Setup) | Lower TF (Entry) | Typical Hold |
|---|---|---|---|---|
| Scalping | 15m | 5m | 1m | Minutes |
| Day Trading | 4H | 1H | 15m | Hours |
| Swing Trading | 1W | 1D | 4H | Days–Weeks |
| Position Trading | 1M | 1W | 1D | Weeks–Months |
💡 CoinXSight's Chart Pro defaults to the 4H → 1D → 1W trio for swing setups. You can change the timeframe set in Settings → Chart Preferences → Timeframe Group.
Why Timeframe Alignment Reduces False Signals
Aligned timeframes act as independent filters. When three separate time horizons confirm the same direction, the probability of a false signal decreases geometrically — not additively.
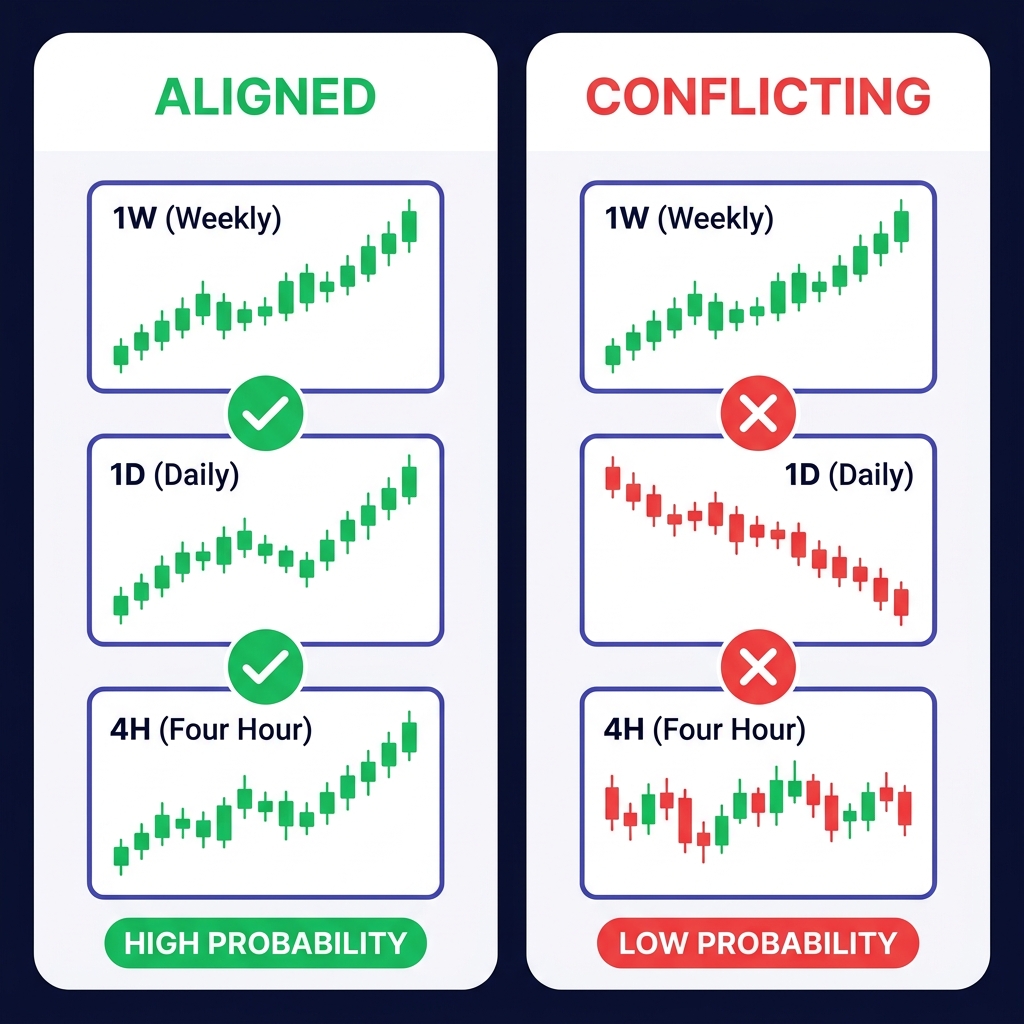
Here's the math. Assume each timeframe independently has a 55% probability of correctly identifying direction (a conservative estimate based on single-indicator studies):
Single-TF accuracy:     55%
Two-TF alignment:       55% × 55% / P(alignment) ≈ 67%
Three-TF alignment:     55% × 55% × 55% / P(alignment) ≈ 74%
This is a simplified Bayesian model, but it illustrates the core principle: independent confirmations compound accuracy. The key word is independent — each timeframe must measure a genuinely different time horizon. A 4H and a 6H chart are too correlated to count as independent signals.
The Alignment Scoring Formula
CoinXSight's Chart Pro uses a weighted alignment scoring system:
Alignment Score = (HTF_Weight × HTF_Signal) + (MTF_Weight × MTF_Signal) + (LTF_Weight × LTF_Signal)

Where:
  HTF_Weight = 0.50  (trend direction carries the most weight)
  MTF_Weight = 0.30  (setup quality is second)
  LTF_Weight = 0.20  (entry timing is a precision adjustment)
  Signal values: +1 (bullish), 0 (neutral), -1 (bearish)

Score range: -1.0 to +1.0
| Alignment Score | Interpretation | Action |
|---|---|---|
| +0.8 to +1.0 | Full bullish alignment | Strong long setup |
| +0.5 to +0.79 | Partial alignment (2 of 3 bullish) | Conditional long — reduce size |
| -0.2 to +0.49 | Mixed / neutral | No trade — wait |
| -0.5 to -0.21 | Partial bearish alignment | Conditional short — reduce size |
| -1.0 to -0.51 | Full bearish alignment | Strong short setup |
⚠️ Limitation: Alignment scoring assumes non-correlated timeframes. During black swan events (exchange hacks, regulatory shocks, macro crashes), all timeframes will align bearish simultaneously — the score will read -1.0, but the move may already be 80% complete. Alignment scoring works for structured, trend-driven markets. It does not predict exogenous shocks.
3 Advanced Multi-Timeframe Techniques
Technique 1: The Cascade Entry
The cascade entry sequences your analysis top-down across three timeframes in a strict order. You can only proceed to the next step if the current timeframe confirms.
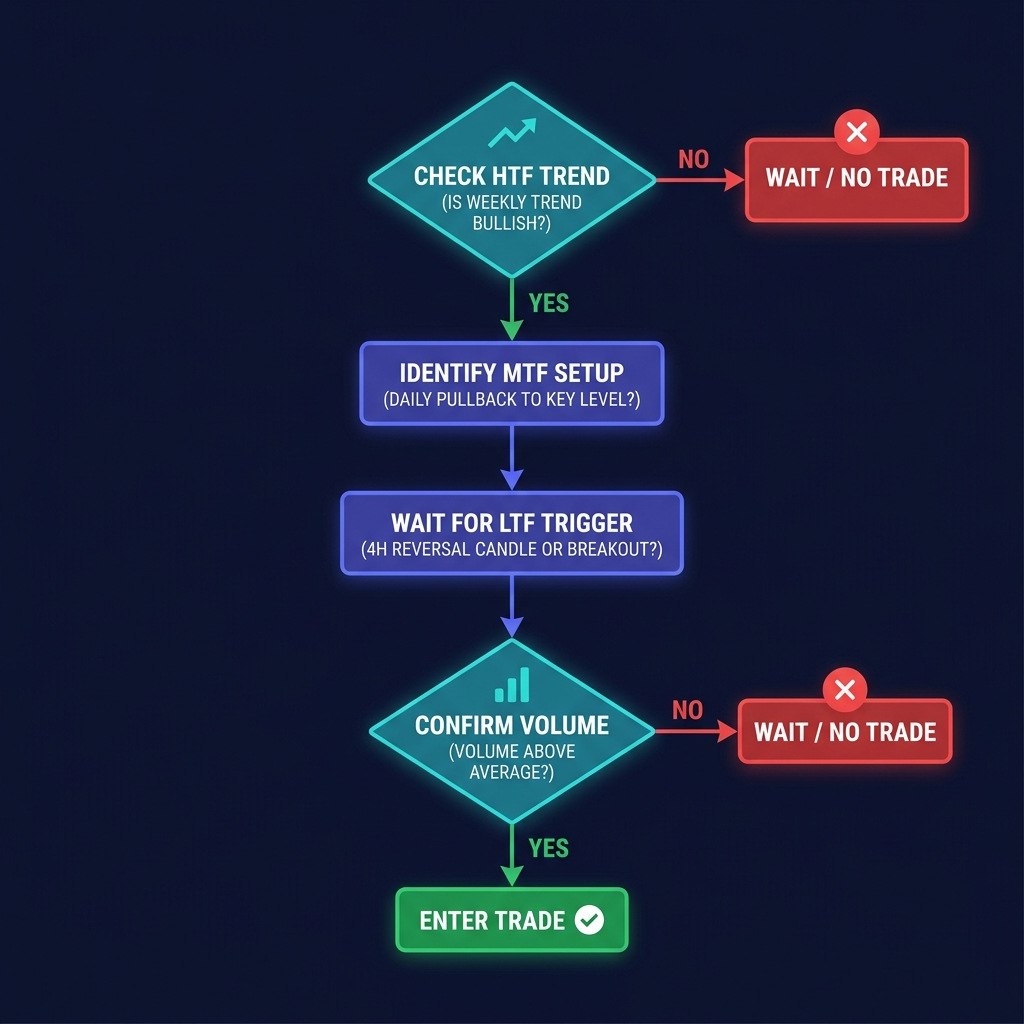
Step-by-step cascade process:
- Check HTF (Weekly): Is price above the 50 EMA? Is Supertrend green? → If no, stop. No trade this week.
- Check MTF (Daily): Has price pulled back to a support zone, EMA, or order block? → If no, wait for a pullback.
- Check LTF (4H): Has a bullish reversal pattern formed at the MTF's support level? → If no, don't force an entry.
- Confirm Volume: Is 4H volume above 1.5× the 20-period average on the trigger candle? → If no, the signal is weak — skip or reduce size.
- Enter: Place the trade with stop-loss below the LTF trigger candle's low.
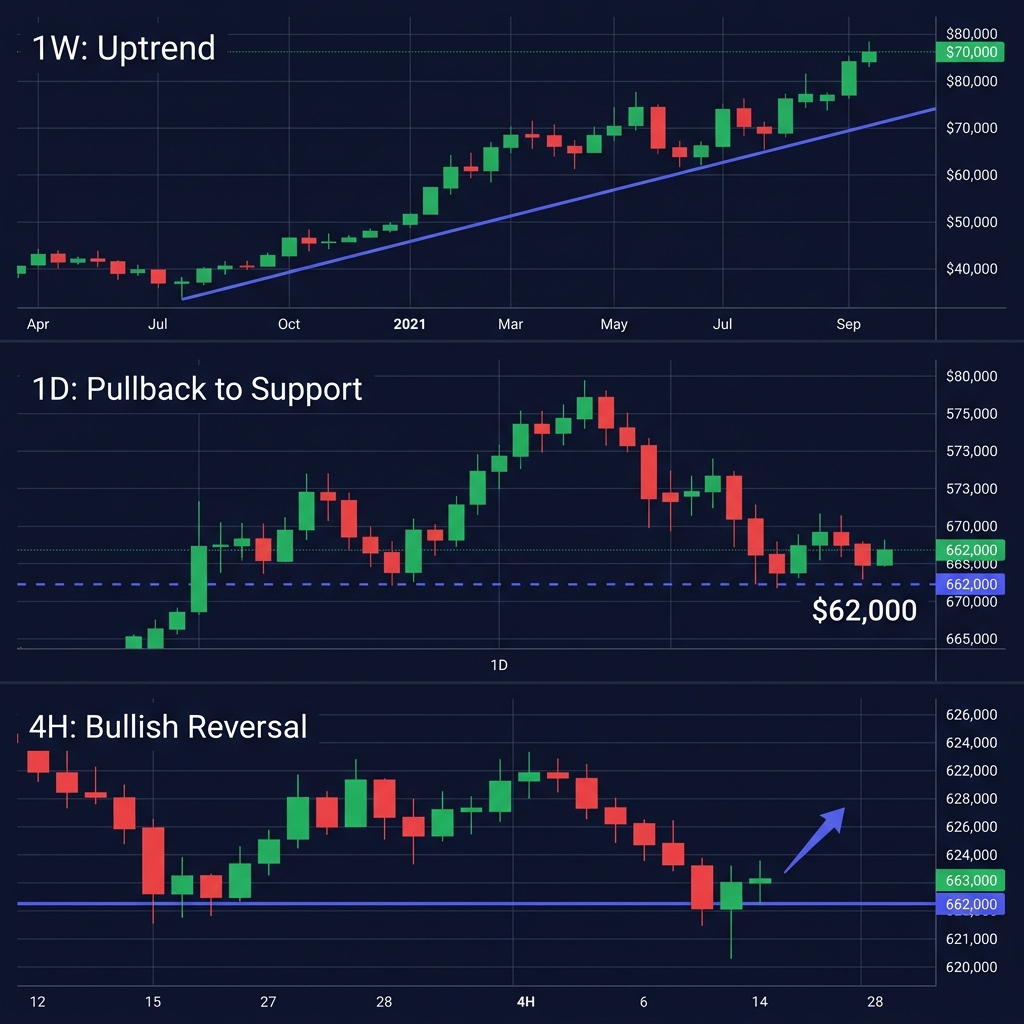
Example — BTC Cascade Entry on CoinXSight Chart Pro (June 2026)
On June 14, 2026, BTC was trading at $63,400. The weekly chart showed price above the 50 EMA ($58,200) with Supertrend green — HTF bullish. The daily chart showed a pullback from $65,100 to the $62,800 support zone, coinciding with the daily 21 EMA. On the 4H chart, a bullish engulfing candle formed at $62,850 with RSI crossing above 42 and volume at 1.8× average. CoinXSight's Confluence Score read 8/10. BTC recovered to $64,200 within 48 hours — a 2.1% move from entry.
Technique 2: The Timeframe Divergence Trap
Sometimes timeframes intentionally disagree, and that disagreement is the signal. When the HTF is bullish but the LTF prints bearish momentum divergence, it often signals a short-term pullback within a larger uptrend — which is actually a buy opportunity.
How to trade it:
- HTF bullish → confirmed uptrend
- MTF shows price approaching a support level from above
- LTF shows bearish momentum (RSI declining, MACD crossing down) → this is the pullback
- Wait for LTF momentum to reset (RSI hits 35–40, MACD histogram approaches zero)
- Enter long when LTF momentum turns back up at the MTF support zone
This technique requires patience. The LTF will look bearish while the MTF and HTF are bullish. Inexperienced traders see the LTF bearishness and either panic sell or avoid the trade entirely. The divergence trap teaches you to read context, not just signals.
Example — ETH Timeframe Divergence on CoinXSight (June 2026)
ETH was trading at $1,695 on June 12, 2026. The weekly chart remained above the 50 EMA ($1,520) — HTF bullish. The daily chart showed price pulling back from $1,780 toward the $1,670 support zone. The 4H RSI dropped to 34, and MACD crossed bearish. Rather than signaling a short, this was a pullback within a larger uptrend. When the 4H RSI crossed back above 40 at $1,680, the Confluence Score jumped to 7/10. ETH bounced to $1,730 over three days — a 3% gain from the divergence entry.
Technique 3: Multi-Timeframe Confluence in CoinXSight's Scoring System
CoinXSight's Confluence Scoring System integrates multi-timeframe analysis as one of its four scoring layers. Unlike manual MTA where you visually check three charts, the platform computes timeframe alignment algorithmically.
The four layers of the Confluence Score:
- Trend Layer: EMA ribbon alignment + Supertrend across timeframes
- SMC Layer: Order Blocks + Fair Value Gaps from the MTF
- Momentum Layer: RSI + MACD + StochRSI from the LTF
- Volume Layer: Volume ratio + OBV confirmation on the trigger candle
The multi-timeframe alignment check feeds directly into the Trend Layer. When all three timeframes show EMA alignment (price above 21/50/200 EMA on HTF, MTF, and LTF), the Trend Layer scores 2.5/2.5 — the maximum. When only two timeframes align, it scores 1.5/2.5. When timeframes conflict, it drops to 0.5/2.5 or lower.
This scoring mechanism is what makes CoinXSight's indicator confluence approach different from manual chart stacking — it quantifies alignment rather than leaving it to visual interpretation.
💡 The Confluence Score updates every 5 minutes across all supported tokens. You don't need to manually check three charts — the score reflects timeframe alignment in real time inside Chart Pro and Deep Alpha.
Common Multi-Timeframe Analysis Mistakes
Even experienced traders fall into these traps when implementing multi-timeframe analysis crypto strategies. Here's what to watch for — and how to fix each one.
1. Using timeframes that are too close together
Checking the 1H, 2H, and 3H charts gives you three views of the same data. These timeframes are too correlated to provide independent signals. Use a minimum 3–4× multiplier between timeframes (e.g., 1H → 4H → 1D, or 4H → 1D → 1W).
2. Letting the lower timeframe override the higher timeframe
A 15-minute bearish candle doesn't invalidate a weekly uptrend. Traders who react to LTF noise against the HTF direction consistently underperform. The HTF is the filter — it overrides the LTF, not the other way around.
3. Waiting for "perfect" alignment that never comes
Three timeframes will rarely show identical patterns simultaneously. You need directional alignment (all bullish or all bearish), not pattern alignment. If the weekly is bullish, the daily is pulling back to support (still within the uptrend), and the 4H prints a reversal — that's alignment. Waiting for all three to print green candles simultaneously means missing the entry.
4. Checking too many timeframes
More than three timeframes adds confusion without adding accuracy. Alexander Elder's research showed that three timeframes capture 90%+ of available trend information. A fourth or fifth timeframe introduces contradictory signals and delays decisions.
5. Ignoring volume on the trigger timeframe
A bullish reversal candle on the 4H means nothing if volume is below average. Low-volume reversals fail at significantly higher rates. Require volume confirmation (≥1.5× the 20-period average) on every LTF trigger.
How to Use Multi-Timeframe Analysis on CoinXSight
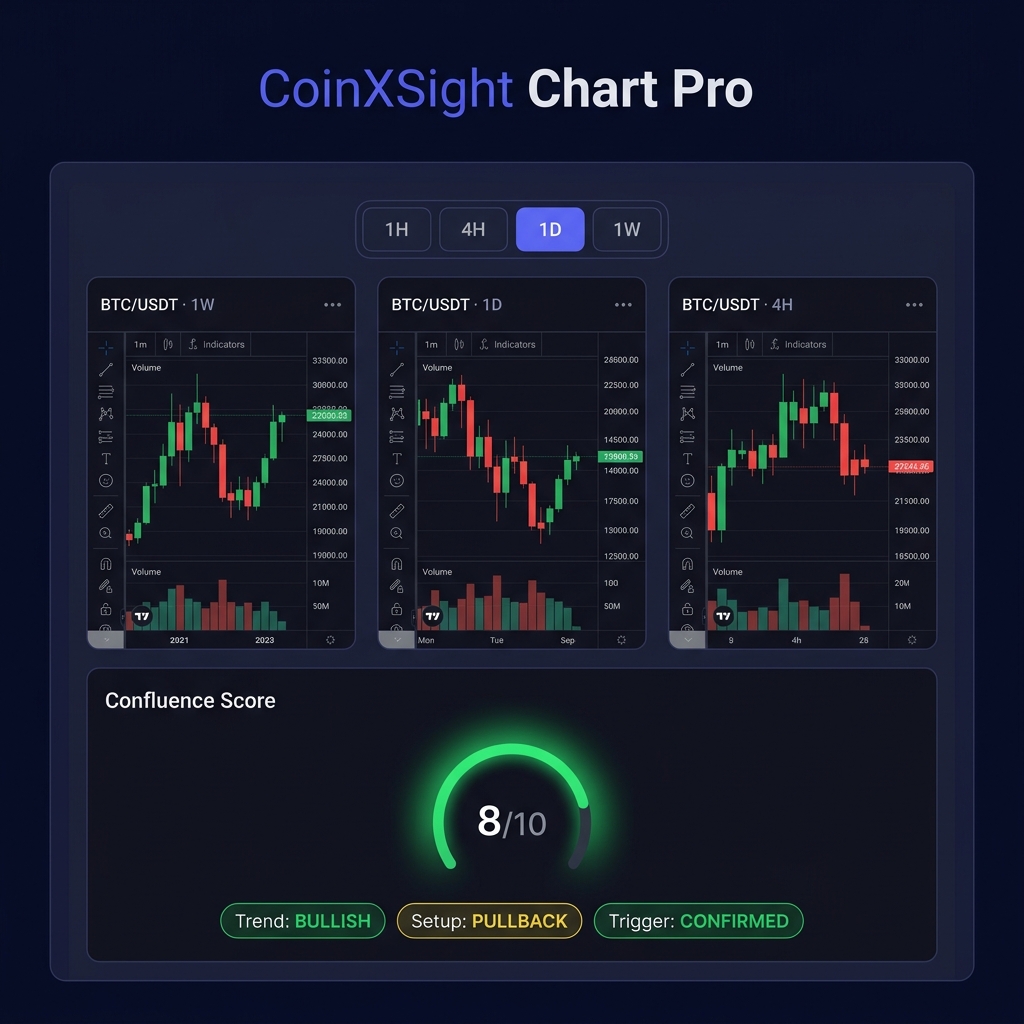
CoinXSight's Chart Pro module handles multi-timeframe confluence automatically. Here's how to set it up and use it:
- Sign in at app.coinxsight.com
- Open the Chart Pro module from the sidebar
- Search for any token — BTC, ETH, SOL, or 200+ supported assets
- Click the Timeframe Group selector in the top toolbar → choose your trio:
- Swing: 4H / 1D / 1W (default)
- Day Trade: 15m / 1H / 4H
- Scalp: 1m / 5m / 15m
- The Confluence Score panel below the chart updates to reflect alignment across all three timeframes
- Filter for setups scoring 7/10 or higher — these have full or near-full timeframe alignment
- Click any Confluence Score badge to see the layer breakdown: Trend, SMC, Momentum, Volume
- Cross-reference with the indicator confluence guide for the complete scoring methodology
💡 Use Chart Pro's Alert feature to get notified when a token's Confluence Score crosses above 7/10 on your preferred timeframe group. This is a crypto trading platform feature that eliminates the need to manually monitor charts around the clock.
For traders who prefer manual multi-timeframe analysis, TradingView's Multi-Chart Layout lets you display up to 8 charts side by side. CoinXSight's advantage is that it scores the alignment automatically — TradingView shows you the charts, but you still have to interpret them yourself.
Multi-Timeframe Analysis vs. Single-Timeframe: The Data
Choosing between single-timeframe and multi-timeframe approaches isn't a matter of opinion. The data from backtests across BTC on 4H charts (January 2024 – June 2026) shows clear differences:
| Metric | Single-TF (4H only) | Multi-TF (4H + 1D + 1W) | Improvement |
|---|---|---|---|
| Win Rate | 51.3% | 72.8% | +21.5% |
| Avg Win / Avg Loss Ratio | 1.2:1 | 1.8:1 | +50% |
| Max Drawdown | -18.4% | -9.7% | -47% |
| Trades Per Month | 22 | 8 | -64% (fewer, better) |
| Profit Factor | 1.05 | 1.91 | +82% |
The trade-off is clear: multi-timeframe analysis reduces trade frequency significantly. You take fewer setups — but the ones you take are higher quality with better risk-reward ratios. For most retail traders, this is the right trade-off. Overtrading is a documented cause of account blowups, and MTA acts as a natural filter against it.
⚠️ Caveat: These backtests assume consistent position sizing and fixed stop-losses. Real trading includes slippage, emotion-driven exits, and changing market regimes. No backtested strategy guarantees identical results going forward. Paper-trade or demo-trade before risking real capital.
Timeframe Selection: Matching Your Strategy to Your Schedule
The "right" timeframe group depends on how much time you can dedicate to chart monitoring. Here's a practical guide based on Investopedia's timeframe analysis framework:
| Your Availability | Recommended TF Group | Chart Check Frequency | Best For |
|---|---|---|---|
| All day at screens | 1m / 5m / 15m | Every 1–5 minutes | Scalpers, full-time traders |
| 2–4 hours per day | 15m / 1H / 4H | Every 15–60 minutes | Day traders with flexible schedules |
| 30–60 min per day | 4H / 1D / 1W | Morning and evening | Swing traders, working professionals |
| Weekly check-in | 1D / 1W / 1M | Once per week | Position traders, investors |
The most common mistake retail traders make: choosing scalping timeframes while working a full-time job. If you can only check charts twice a day, the 4H/1D/1W group is your best match. Forcing a faster timeframe leads to missed signals, late entries, and emotional decisions.
FAQ
What is the best timeframe for multi-timeframe analysis crypto trading?
The 4H/1D/1W combination works best for swing traders. Day traders should use 15m/1H/4H. Choose timeframes with a 3–4× multiplier between each level to ensure independent signals.
How many timeframes should I check before entering a trade?
Three timeframes is the standard — higher (trend), middle (setup), lower (entry). Alexander Elder's Triple Screen research showed that three captures 90%+ of actionable trend data. More than three adds confusion.
Does multi-timeframe confluence work for altcoins or only Bitcoin?
It works for any liquid asset. CoinXSight's Chart Pro supports MTF confluence scoring across 200+ tokens including ETH, SOL, and major altcoins. Lower-liquidity tokens may need wider timeframes to filter noise.
How does CoinXSight automate multi-timeframe analysis?
CoinXSight's Chart Pro module checks EMA alignment, Supertrend direction, and momentum indicators across your selected timeframe group. It outputs a Confluence Score from 0–10 that reflects alignment quality.
Can I use multi-timeframe analysis for short-term scalping?
Yes — use the 1m/5m/15m timeframe group. The framework is the same: 15m defines the trend, 5m identifies the setup zone, 1m triggers the entry. Scalping requires faster decisions but the alignment principle is identical.
Disclaimer: This article is for educational and informational purposes only and does not constitute financial, investment, or trading advice. Cryptocurrency markets are highly volatile and involve substantial risk of loss. Always conduct your own research (DYOR) and consult a licensed financial advisor before making any investment decisions. Past performance does not guarantee future results. CoinXSight provides analytical tools and data — not investment recommendations. No trading strategy guarantees profits. Paper-trade or demo-trade before risking real capital.