Smart Money Concepts Explained: How Institutional Traders Move Crypto Markets
Understand Order Blocks, Fair Value Gaps, Break of Structure, and Change of Character — the institutional price action framework that powers CoinXSight's SMC engine.
MC
Marcus ChenSenior Quantitative Strategist·Apr 8, 2026 · 11 min read · Updated Oct 6
Smart Money Concepts (SMC) is a price action framework that analyzes how institutional traders — hedge funds, market makers, and proprietary desks — accumulate and distribute positions. Unlike traditional technical analysis, which treats all market participants equally, SMC specifically tracks the footprint of large players who have the capital to move prices.
The framework is built on a simple observation: institutions cannot buy or sell in one transaction. A fund looking to acquire $50M of BTC cannot execute a single market order without spiking the price. Instead, they accumulate over time through specific price action patterns — and those patterns are identifiable on the chart.
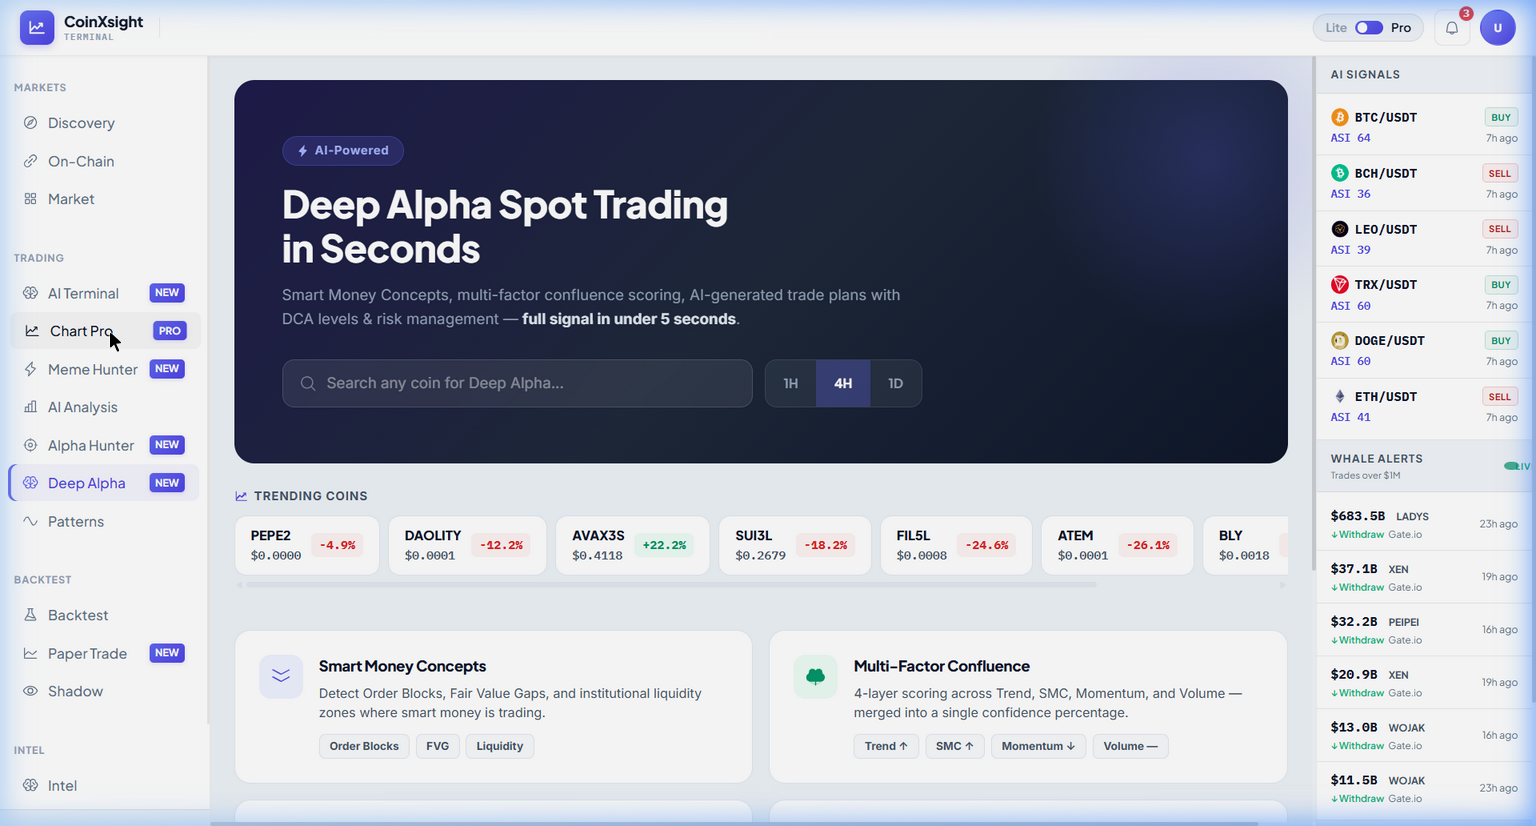
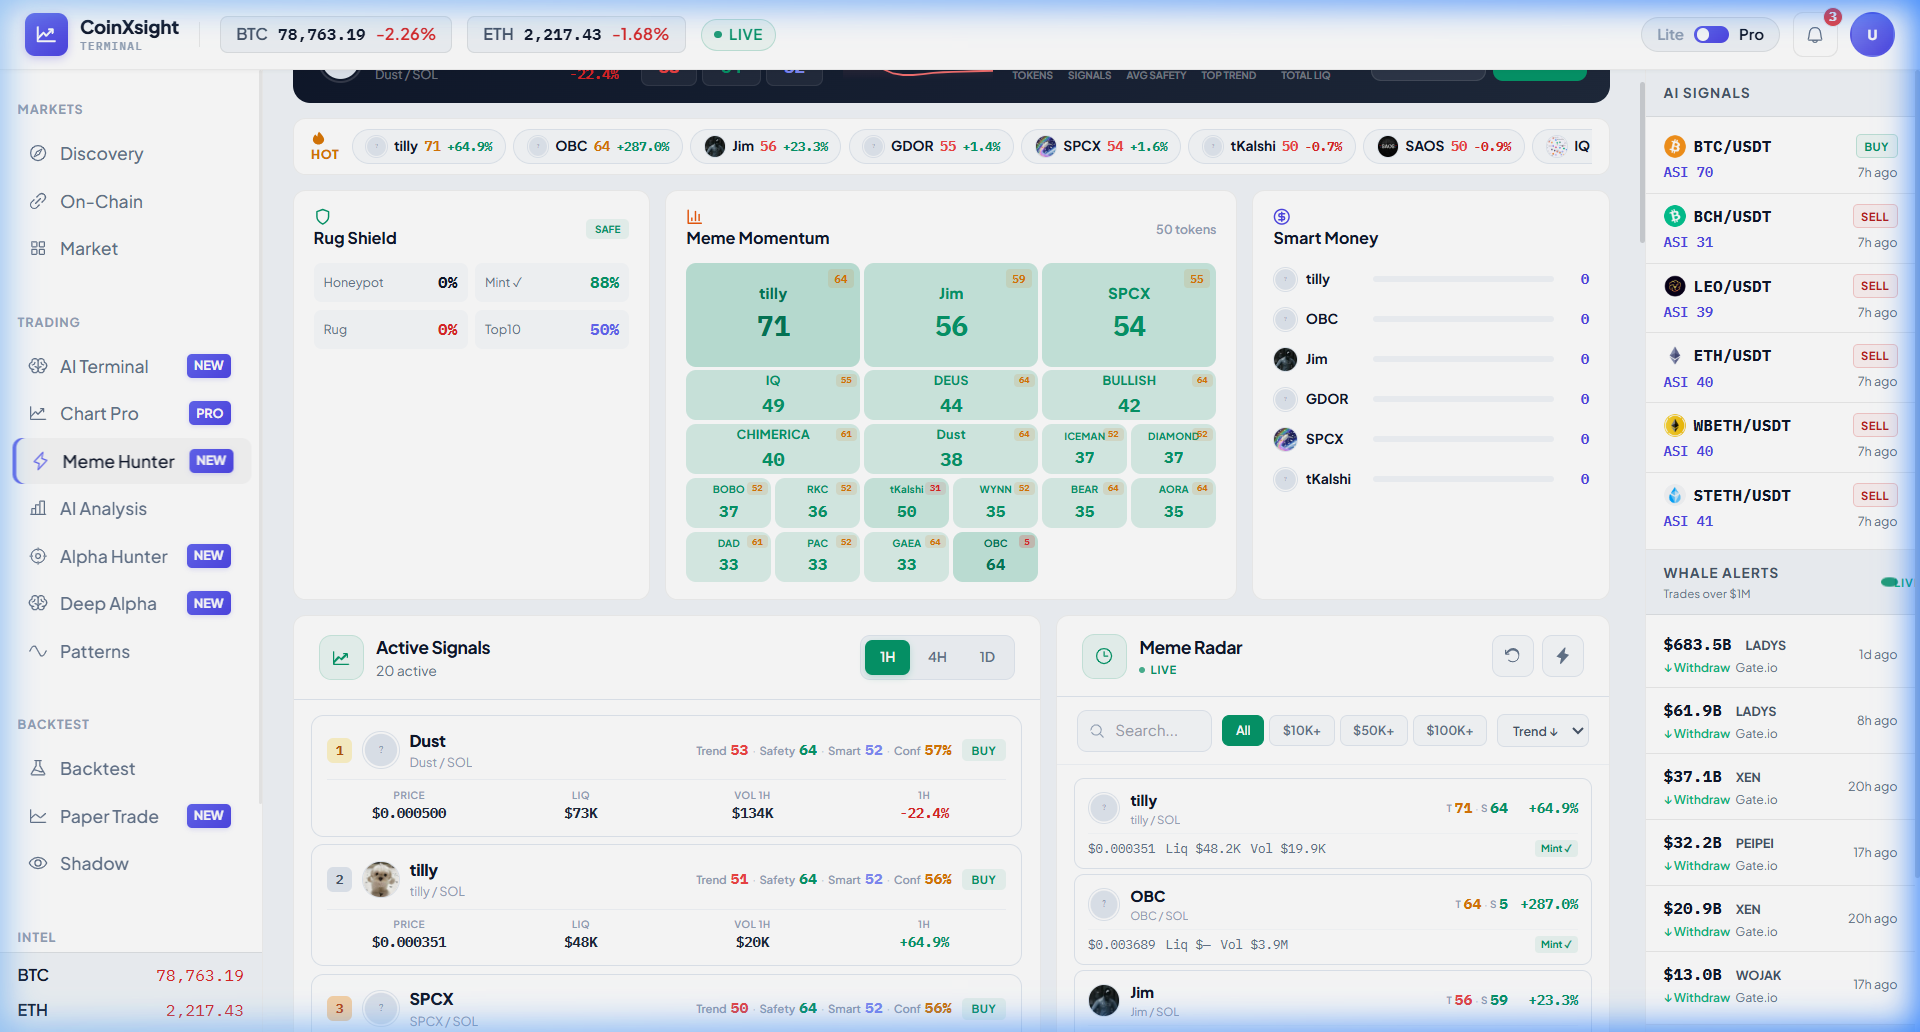
CoinXSight includes a dedicated Smart Money Concepts engine that automatically detects Order Blocks, Fair Value Gaps, and Liquidity zones — the three pillars of institutional analysis. The results are surfaced across multiple modules: Deep Alpha displays the SMC panel, Chart Pro overlays the zones visually, Discovery uses them for signal triage, and Meme Hunter incorporates SMC into its smart money scoring. The SMC Layer is one of four scoring layers in the Confluence Scoring system.
The 4 Core SMC Components
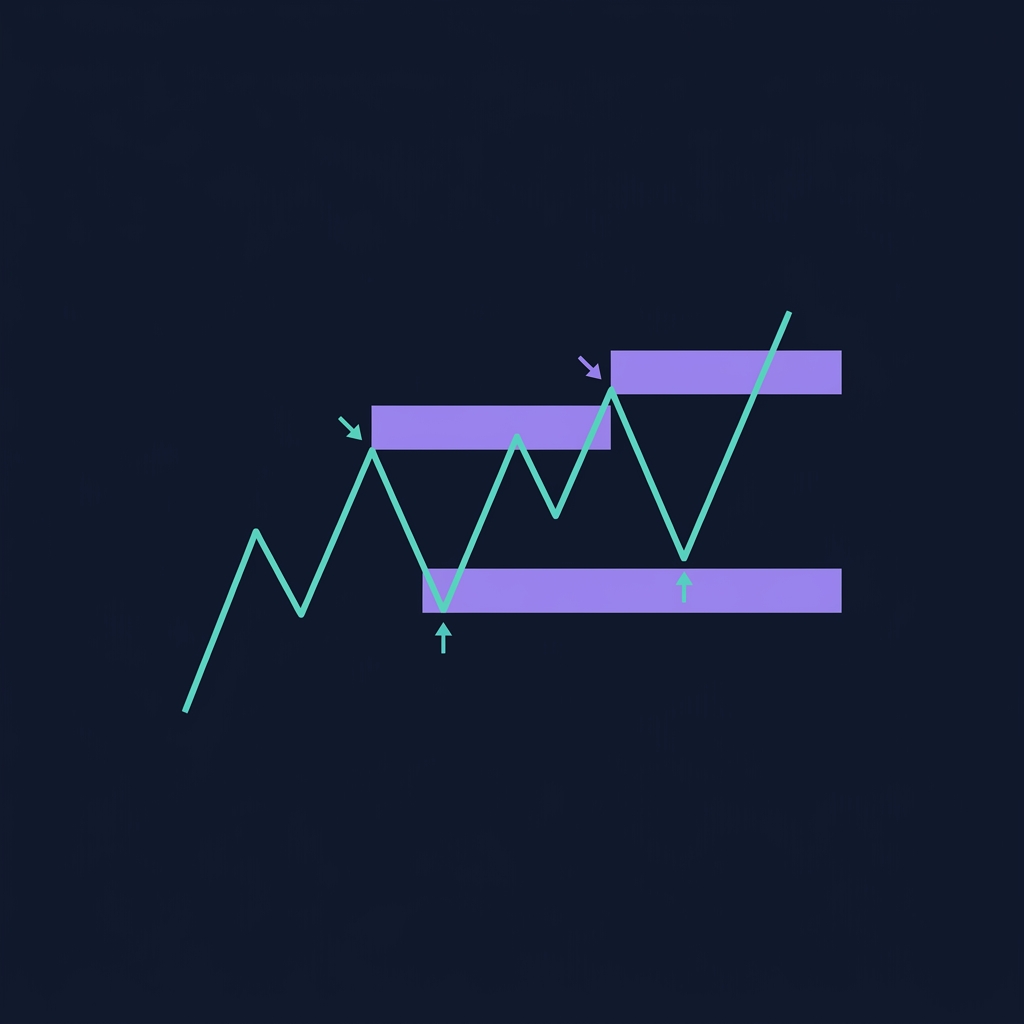
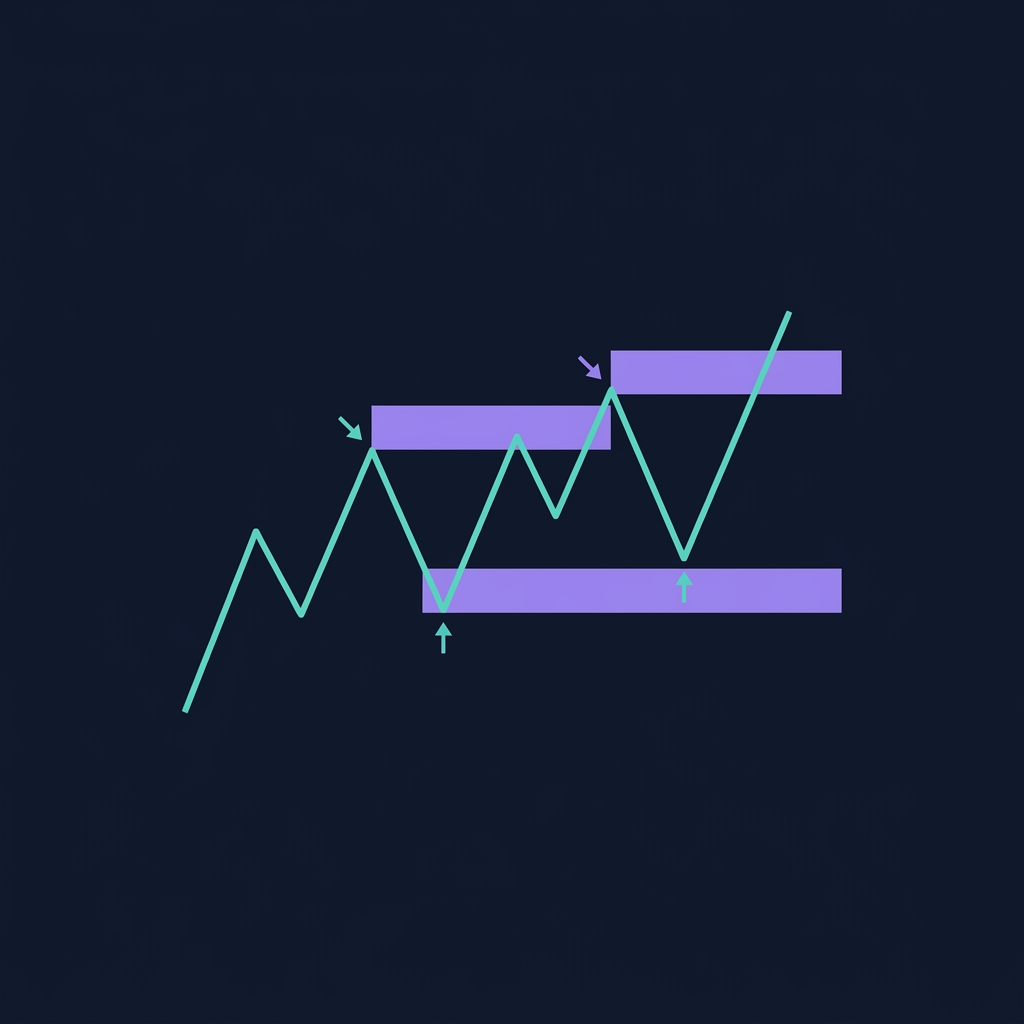
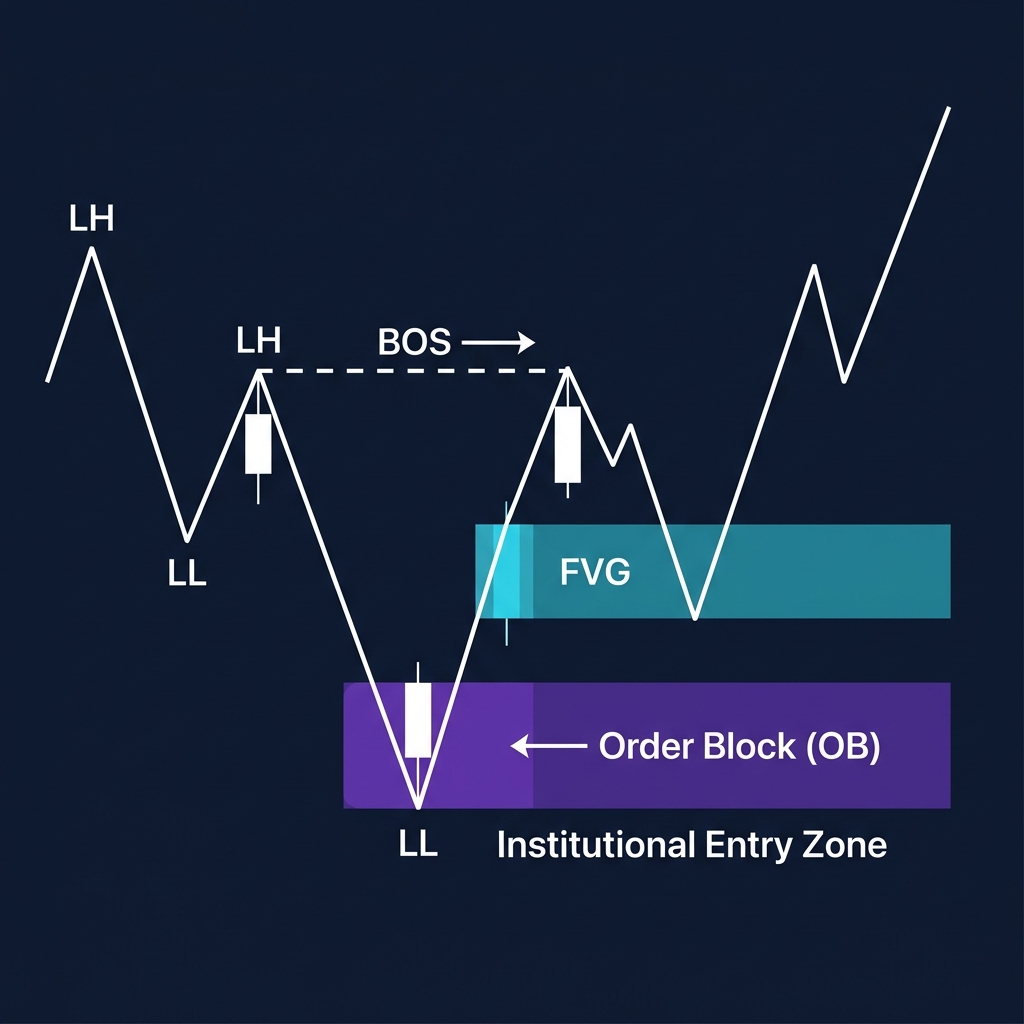
1. Order Blocks (OB) — Institutional Entry Zones
An Order Block is the last opposing candle before a strong impulsive move. It represents the zone where institutions placed significant orders that fueled the subsequent move.
Bullish Order Block: The last red (bearish) candle before a powerful move up. This is where institutions were accumulating — buying while retail was selling.
Bearish Order Block: The last green (bullish) candle before a powerful move down. This is where institutions were distributing — selling while retail was buying.
Why Order Blocks act as future support/resistance:
When price returns to an Order Block, three forces create a reaction:
Institutions who entered at that level may add to their positions
Stop-losses from opposing traders cluster below/above the OB, creating liquidity
Algorithmic systems programmed to trade OB patterns trigger automated orders
How to identify a valid Order Block:
Criteria
Requirement
Strong impulse after the OB
The move leaving the OB must cover at least 2-3× the OB candle's range
Structure break
The impulse must break a previous swing high (bullish) or swing low (bearish)
Freshness
An "unmitigated" OB (not yet retested) is stronger than one that has been tested before
Volume confirmation
The impulse candle should have above-average volume
💡 On CoinXSight, Order Blocks are detected automatically by the platform's SMC engine and surfaced across multiple modules: Deep Alpha tags them as "OB Bullish" or "OB Bearish" in the Smart Money Concepts panel; Chart Pro lets you toggle the SMC overlay to visually see Order Block zones drawn on the chart; and Discovery uses them to score Alpha Signals.
2. Fair Value Gaps (FVG) — Imbalanced Price Zones
A Fair Value Gap is a three-candle pattern where the middle candle's body is so large that it leaves a gap between the first and third candle's wicks. This gap represents a price zone where trading was one-sided — either aggressive buying or aggressive selling with no meaningful opposition.
How FVGs form:
Candle 1: Normal candle with a wick high at $100
Candle 2: A large impulsive candle that opens at $100 and closes at $108
Candle 3: Opens at $106 with a wick low at $105
The gap between Candle 1's high ($100) and Candle 3's low ($105) is the Fair Value Gap — a $5 zone where price moved so fast that no real two-sided trading occurred.
Why FVGs matter:
Price tends to return to FVGs to "fill" them — this is called rebalancing. Institutions view unfilled FVGs as areas of inefficient pricing that need to be revisited. This makes FVGs powerful predictive zones for pullback entries.
FVG classification on CoinXSight:
FVG Type
Color Code
Meaning
Bullish FVG
Green zone
Gap left by aggressive buying — price may return here as support
Bearish FVG
Red zone
Gap left by aggressive selling — price may return here as resistance
Filled FVG
Faded
Price has rebalanced the zone — no longer active
3. Break of Structure (BOS) — Trend Continuation
A Break of Structure occurs when price breaks a previous swing high (in an uptrend) or swing low (in a downtrend), confirming that the current trend is continuing.
Bullish BOS: Price makes a new higher high → the uptrend is intact
Bearish BOS: Price makes a new lower low → the downtrend is intact
BOS is a continuation signal. It tells you the trend direction has not changed.
4. Change of Character (CHoCH) — Trend Reversal
A Change of Character is the first break of structure in the opposite direction. This signals that the current trend may be ending and a reversal is forming.
Bullish CHoCH: In a downtrend, price breaks above the most recent lower high → the first sign that sellers have lost control
Bearish CHoCH: In an uptrend, price breaks below the most recent higher low → the first sign that buyers have lost control
Real-World Scenario: BTC Order Block Trade on CoinXSight
Modern crypto analytics platforms integrate these signals with additional data layers — combining trading indicators, on-chain metrics, and AI analysis for higher-probability entries.
Scenario — BTC, April 2026, 4H timeframe:
On April 14, 2026, BTC was trading at $71,200 in a confirmed uptrend (series of higher highs and higher lows). CoinXSight's Deep Alpha module flagged a Bullish Order Block at $68,400-$69,000 — the last red candle zone before the move from $69,000 to $72,500.
What CoinXSight showed across modules:
Deep Alpha — SMC Panel:
"Bullish OB: $68,400-$69,000 (Unmitigated)"
"Bullish FVG: $69,200-$69,800 (Unfilled)"
Structure: "Uptrend — Last BOS at $71,000"
Chart Pro — SMC overlay:
The Order Block zone was visually drawn in green at $68,400-$69,000
EMA 89 aligned with the OB zone at $68,600 — double confluence
Whale Tracker:
$4.2M BTC withdrawn from Binance to cold wallets during the previous day — whale accumulation
The trade:
BTC pulled back to $68,800 on April 17, entering the Order Block zone. At this point:
RSI: 36 (approaching oversold)
MACD: Histogram compressing, Signal approaching bullish crossover
Confluence Score: 8/10 (OB + FVG + RSI oversold + EMA support + whale accumulation)
BTC bounced from $68,800 and rallied to $73,400 over the next 6 days — a 6.7% move from a high-probability SMC zone identified across three CoinXSight modules.
⚠️ Limitation: Not every Order Block produces a reaction. Approximately 60-70% of valid Order Blocks produce at least a bounce, but 30-40% get swept — price blows through the OB, stops out traders, and continues in the opposing direction. Always use a stop-loss below the Order Block (for longs) or above it (for shorts). The Confluence Score helps filter for higher-probability setups.
SMC + Traditional Indicators — The Multi-Layer Approach
The real power of SMC emerges when combined with momentum and trend indicators. CoinXSight's 4-layer Confluence system does this automatically:
Layer
Components
Role
Trend
EMA 34/89/200 + Supertrend
Establishes the macro direction — only trade SMC setups aligned with the trend
SMC
Order Blocks + FVG + Liquidity
Identifies the institutional price zones where entries have edge
Momentum
RSI + MACD + StochRSI + MFI
Confirms that momentum supports the SMC thesis
Volume
Volume ratio + Bollinger Bands
Validates that genuine participation backs the move
SMC Layer: Price at a Bullish OB with an unfilled FVG above → ✅ institutional zone
Momentum: RSI at 35, MACD histogram compressing → ✅ oversold with fading bearish pressure
Volume: Volume ratio above 1.2 during the OB test → ✅ real participation
This produces a Confluence Score of 8-9/10 — significantly higher probability than any single factor alone.
Common SMC Mistakes
Trading every Order Block: Not all OBs are equal. Prioritize unmitigated OBs that align with the trend direction and have FVG confluence nearby.
Ignoring the trend: A Bullish Order Block in a strong downtrend is far less reliable than one in an uptrend. Always check the Trend Layer first (EMA ribbon + Supertrend).
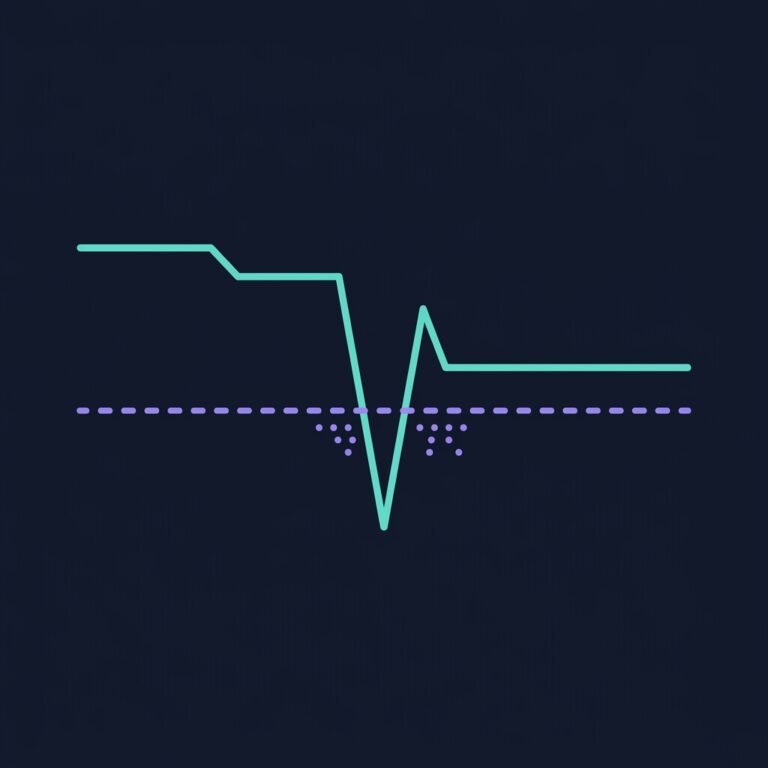
Setting tight stop-losses inside the OB: Institutions specifically target stop-losses inside Order Blocks — this is called a "liquidity sweep." Set your stop below the entire OB zone, not at the top of it.
Treating SMC as a prediction system: SMC identifies zones where a reaction is likely, not guaranteed. The framework increases your edge to perhaps 60-70% — you still lose 30-40% of trades. Risk management is non-negotiable.
How to Use SMC on CoinXSight — Multi-Module Workflow
The biggest misconception about SMC: traders think marking one Order Block means they have "done the analysis." Real SMC analysis requires layering — OB + FVG + BOS + whale flow + confluence. Here is the full workflow I use to separate a genuine institutional footprint from random price action.
Step 1: Identify the institutional zones on Chart Pro
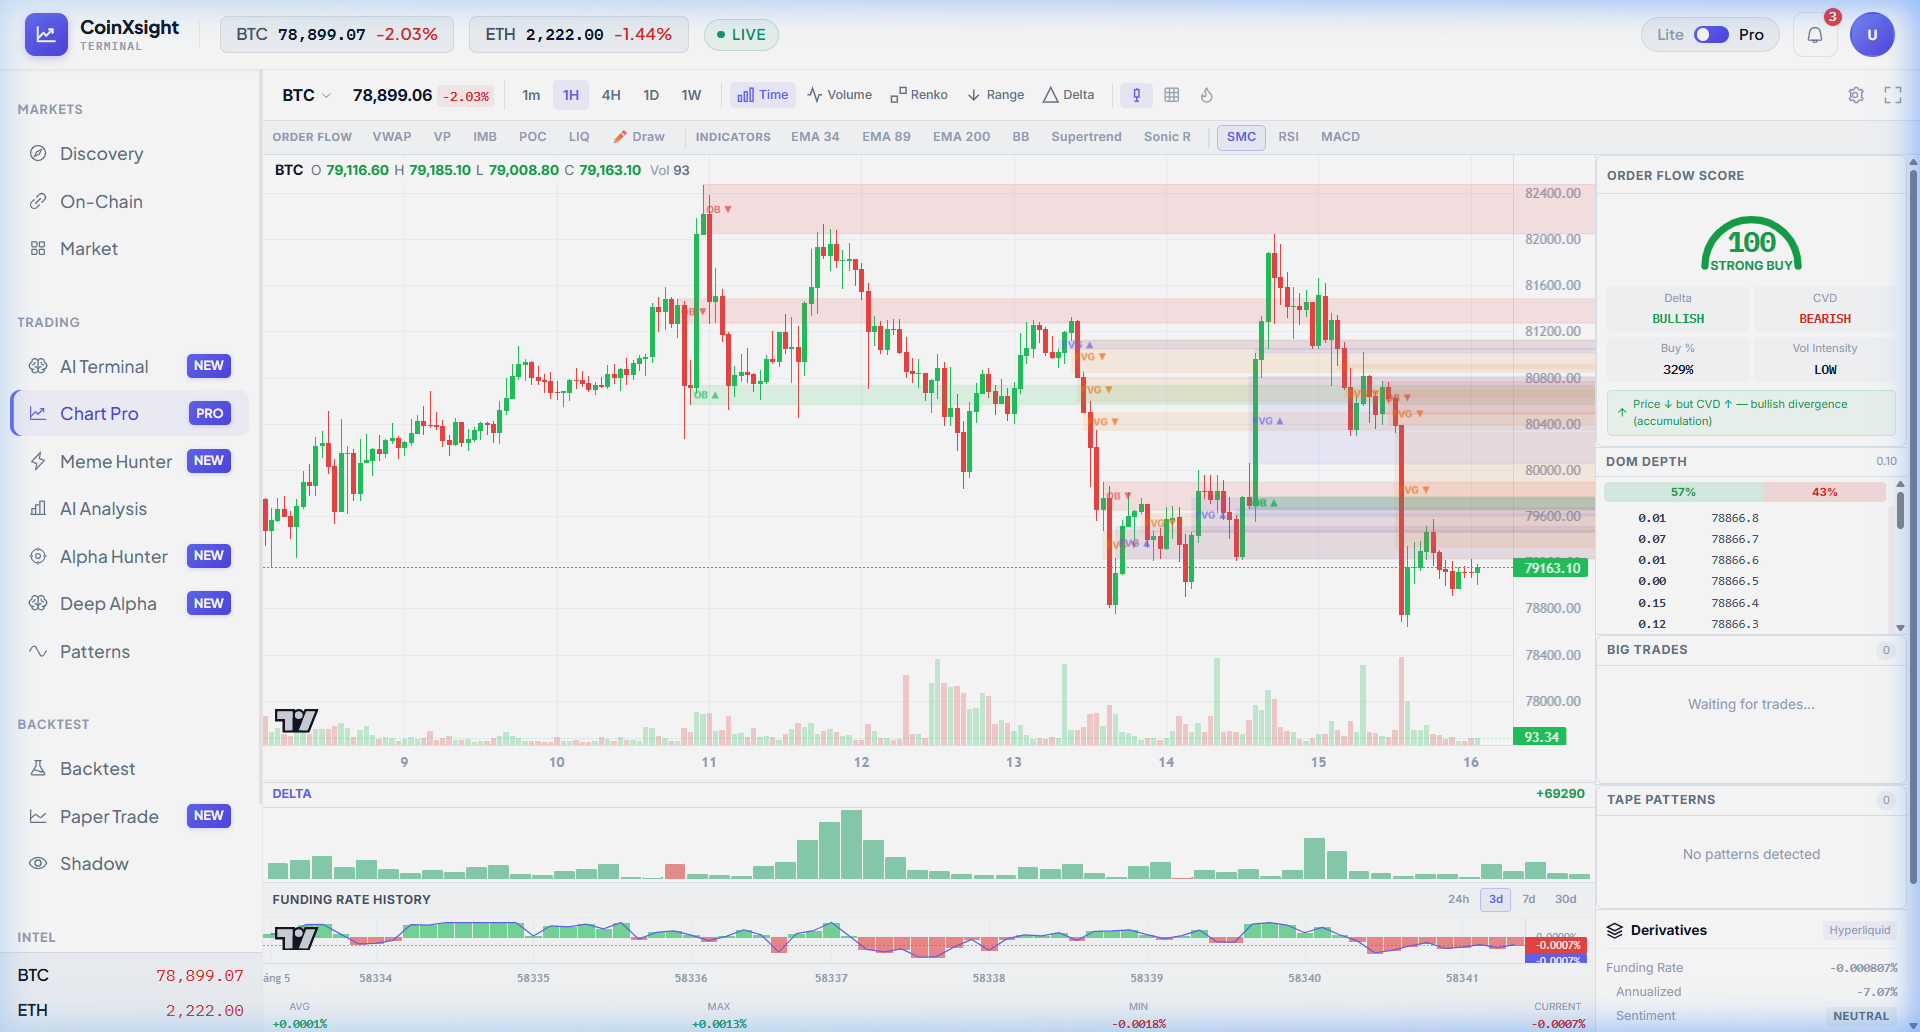
Open Chart Pro → toggle SMC from the indicator toolbar. The chart auto-labels all SMC structures. In the screenshot below, BTC 1H shows the complete institutional map:
OB ▼ at $81,500-$82,400 (red zones) — multiple bearish Order Blocks marking where institutions initiated sells. These are resistance zones with institutional supply.
OB ▲ at $79,800-$80,200 (green zone) — a bullish Order Block marking where accumulation occurred. This is institutional demand.
FVG ▲ (green band) — a bullish Fair Value Gap near $80,200 where price created an imbalance.
BOS labels connecting swing points — these Break of Structure markers confirm whether the institutional activity has created a trend or reversal.
The critical read: OB ▼ zones are stacking at swing highs → sellers are in control. The single OB ▲ at $80K is the last line of institutional demand. If that zone breaks, expect a flush to the next OB below.
Navigate to Deep Alpha → search BTC. The header confirms: Trend: BEARISH, Market Regime: MIXED, Confluence: PARTIAL. The SMC Layer score within the Confluence reflects the OB and FVG zones we just mapped on Chart Pro. With a BEARISH trend, the bearish OB ▼ zones have higher probability of holding as resistance. The bullish OB ▲ at $80K needs STRONG confluence (not PARTIAL) to be a reliable buy zone.
Order Blocks represent past institutional activity. On-Chain tells you what institutions are doing right now. Navigate to On-Chain. Exchange Inflow is +$32.8M — active distribution. This confirms the bearish SMC picture: institutions created the OB ▼ zones (sells), and current on-chain flow shows continued selling.
Meme token SMC analysis requires an extra step. Navigate to Meme Hunter → the Safety Score panel shows wallet concentration metrics. A meme coin with a beautiful OB on the chart but a Safety Score of 2/10 (3 wallets holding 80% of supply) is a trap — those wallets can create artificial Order Blocks by coordinating buys, then dump through them. Only trade meme SMC setups with Safety Scores above 6.
Frequently Asked Questions
Are Smart Money Concepts proven to work?
SMC is based on observable market microstructure — institutions do leave identifiable footprints. However, like all trading methods, it is probabilistic. Academic research on order flow and institutional footprints supports the core principles, but no framework guarantees profits. CoinXSight combines SMC with three other analytical layers to increase reliability.
What is the difference between Order Blocks and support/resistance?
Traditional S&R is identified by visible price bounces. Order Blocks are specific candle patterns that represent institutional positioning. An Order Block at $68,400 might not look like a traditional support level — it is one candle in a series — but it marks where large-scale accumulation occurred. Both are useful; OBs provide more precision about the nature of the orders at that level.
Can retail traders really see what institutions are doing?
Not directly — institutions do not broadcast their orders. But the effects of institutional activity leave patterns on the chart (Order Blocks, FVGs, liquidity sweeps) that are statistically significant. CoinXSight's SMC engine scans for these patterns automatically, removing the need for manual chart reading.
Which timeframe is best for SMC analysis?
4H and daily timeframes produce the most reliable Order Blocks and FVGs because they reflect decisions made by larger players. 1H can be used for fine-tuning entries within daily OB zones. Timeframes below 1H generate too much noise for institutional analysis.
How does CoinXSight detect Order Blocks?
CoinXSight's Deep Alpha module runs a multi-step algorithm: (1) Identify impulsive moves that break structure; (2) Locate the last opposing candle before the impulse; (3) Validate the OB by checking impulse strength, volume, and structure break criteria; (4) Tag the zone as unmitigated or mitigated based on whether price has returned.