How AI Detects Whale Accumulation Before Price Moves
Learn how AI-powered whale detection uses wallet clustering, behavioral pattern matching, and anomaly detection to identify institutional accumulation phases before they impact price.
DP
David ParkChief On-Chain Data Analyst·May 22, 2026 · Updated Oct 6
Every major crypto rally has the same origin story: smart money accumulates quietly, price consolidates, retail gets bored, and then — suddenly — a breakout happens that "nobody saw coming." Except somebody did see it coming. The accumulation was happening on-chain the entire time, visible to anyone who knew where (and how) to look.
The problem? Looking is no longer humanly possible. Ethereum alone processes over 1 million transactions per day. Bitcoin has over 800,000 active addresses daily. Across all chains, there are tens of millions of daily transactions — each one potentially carrying information about what the largest players in the market are doing.
This is where AI transforms on-chain analysis from an interesting hobby into a genuine trading edge. Building on the fundamentals covered in our Whale Tracking Guide and On-Chain Analysis for Beginners, this guide explains exactly how AI-powered whale detection works, what the technology can and cannot do, and how you can integrate whale intelligence into your trading process.
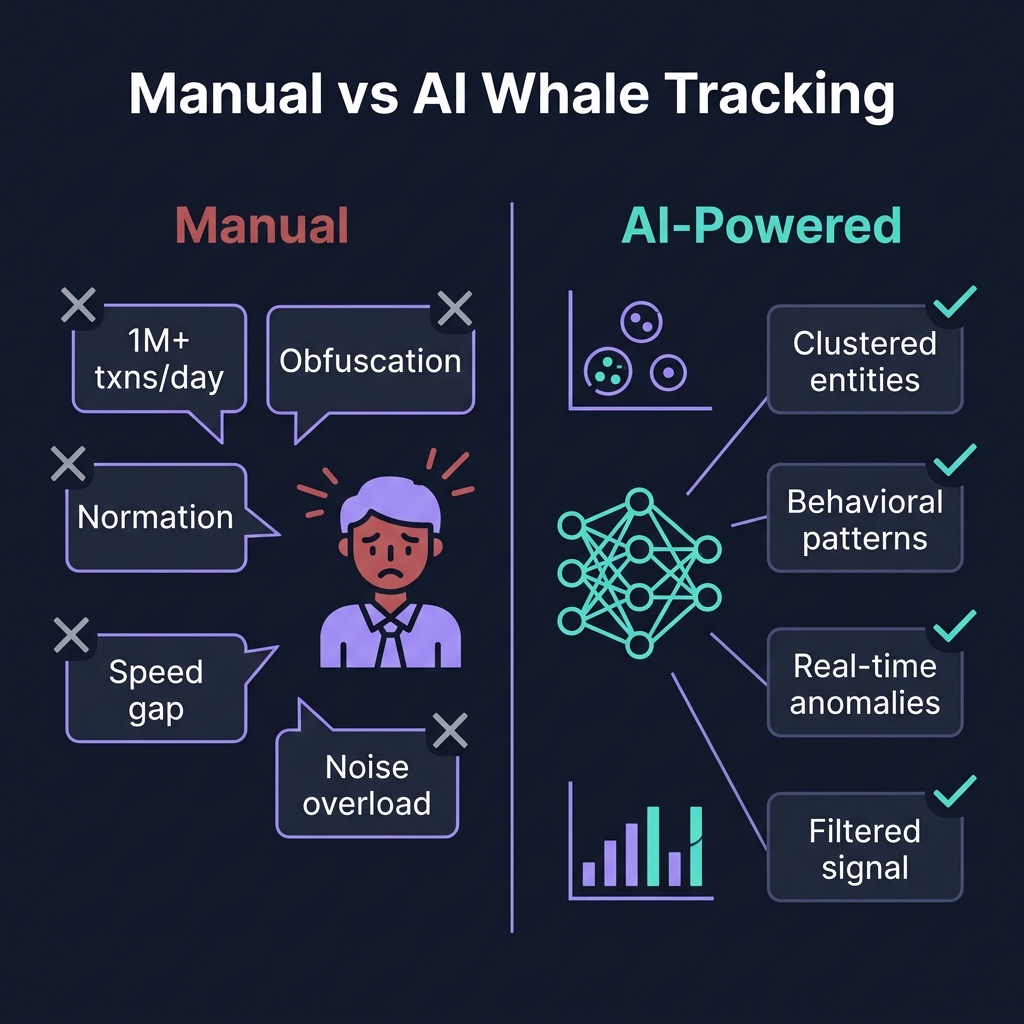
Why Manual Whale Tracking Fails at Scale
Before understanding how AI solves the problem, you need to understand why the problem is so hard in the first place.
The Volume Problem
A single large wallet address might interact with dozens of exchanges, hundreds of DeFi protocols, and thousands of individual tokens. Tracking one whale is already a full-time job. Tracking the 500+ addresses that collectively control meaningful market share across major tokens? That requires computational scale that no human team can match.
The Obfuscation Problem
Sophisticated whales don't move $50 million from one wallet to Binance in a single transaction. They split it across dozens of wallets, use mixers or bridges, execute through OTC desks, and time transactions to blend into normal network activity. What looks like 200 unrelated small transactions might be one whale distributing a position — but you'd never know without connecting the dots across time, wallets, and chains.
The Speed Problem
When a whale starts accumulating a token, the window between "quiet buying" and "price impact" can be as short as 48–72 hours. Manual monitoring that checks wallet activity once a day misses the window entirely. By the time you notice the accumulation, the move has already started.
The Noise Problem
For every genuinely significant whale transaction, there are hundreds of meaningless ones — exchange rebalancing, internal transfers, protocol treasury management, failed transactions. Without AI-powered classification, you drown in noise and miss the signal entirely.
How AI Solves the Whale Detection Problem
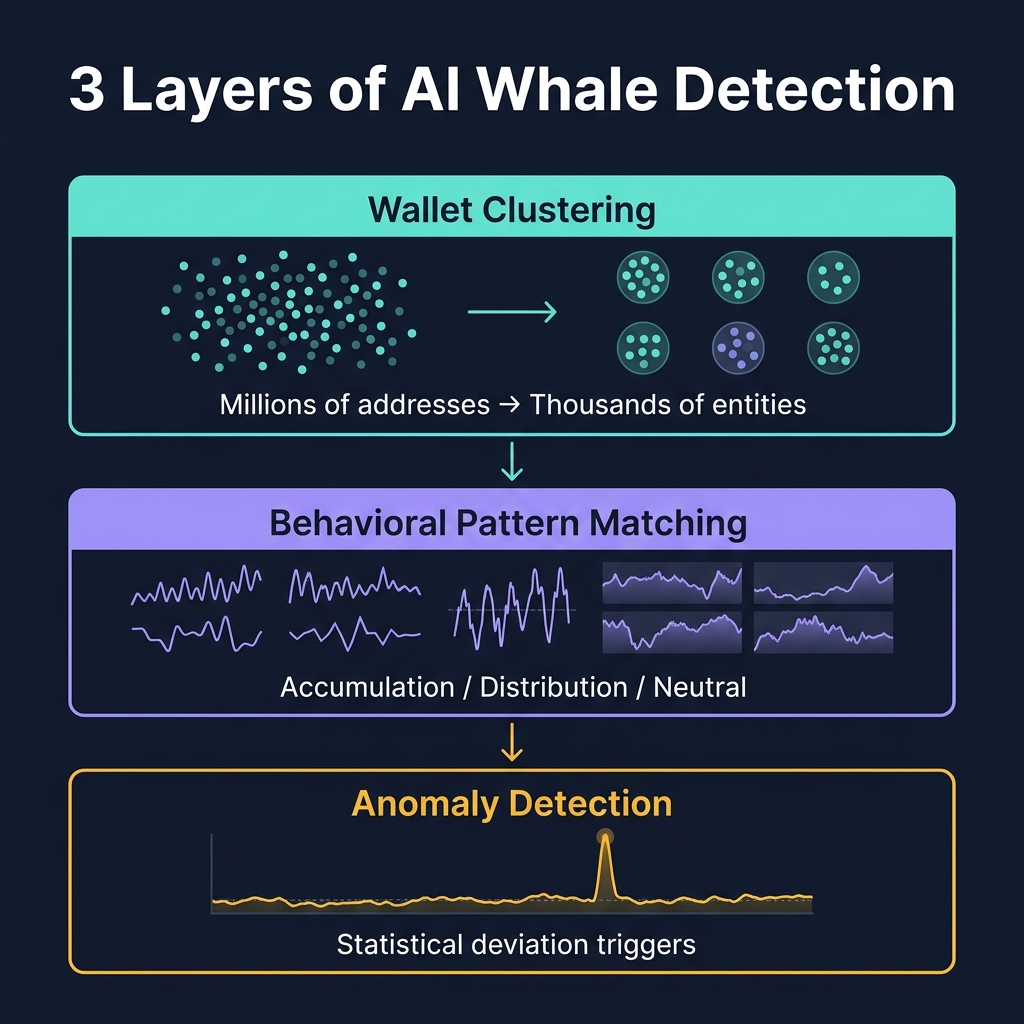
AI-powered whale detection operates across three technical layers, each building on the previous one to transform raw blockchain data into actionable intelligence.
Layer 1: Wallet Clustering
What it does: Groups related addresses into entities.
A single whale often controls hundreds of wallet addresses. Wallet clustering algorithms identify which addresses belong to the same entity by analyzing:
Transaction patterns: Wallets that frequently send to the same intermediate address or share common funding sources
Timing correlation: Addresses that consistently transact within minutes of each other across different protocols
Balance flow: When one wallet sends, another receives in a pattern that suggests common ownership
Smart contract interaction: Wallets that interact with the same set of custom contracts or multi-sig wallets
The result is a mapping from "millions of anonymous addresses" to "thousands of identified entities." This compression is what makes meaningful analysis possible.
Example: What looks like 47 separate wallets buying $200K–$500K of SOL each might actually be ONE entity accumulating a $15 million position. Without clustering, each individual buy looks unremarkable. Together, they reveal a massive conviction bet.
Layer 2: Behavioral Pattern Matching
What it does: Classifies entity behavior as accumulation, distribution, or neutral.
Once wallets are clustered into entities, AI models analyze the behavioral sequence to determine what the entity is doing:
Accumulation Patterns
The AI looks for these specific sequences:
Gradual buying: Consistent purchase activity over 5–14 days, typically larger during low-volume periods
Exchange withdrawals: Moving tokens from exchanges to cold storage (signal of long-term holding intent)
DeFi positioning: Adding tokens to lending protocols as collateral (leverage for bigger positions)
Gradual selling: Consistent sells across multiple exchanges to minimize slippage
Exchange deposits: Moving from cold storage to exchanges (preparation to sell)
Stablecoin conversion: Converting token holdings to USDT/USDC (de-risking)
Bridge activity: Moving to chains with deeper liquidity for larger exits
Neutral Patterns (False Signals to Ignore)
Exchange rebalancing: Hot wallet management that looks like accumulation but is operational
Protocol treasury operations: DAO treasuries managing diversification
Yield farming rotation: Moving between protocols for APY optimization, not directional betting
Bridge arbitrage: Cross-chain moves that exploit price differences, not accumulation
Layer 3: Anomaly Detection
What it does: Flags unusual activity that deviates from historical baselines.
This is the most sophisticated layer. Rather than looking for predefined patterns, anomaly detection identifies behavior that is statistically unusual compared to the entity's own history and the network's baseline activity.
The AI tracks:
Metric
Baseline
Anomaly Trigger
Transaction size
Entity's average transaction
> 3x standard deviation
Transaction frequency
Entity's normal cadence
> 2x in 24h period
New token interaction
Entity's known token universe
First interaction with token
Exchange preference
Entity's usual exchange
New exchange or OTC counterparty
Time-of-day pattern
Entity's usual active hours
Activity during unusual hours
When multiple anomaly triggers fire simultaneously for the same entity, the confidence level of the signal increases exponentially. One anomaly is noise. Three anomalies on the same day for the same wallet cluster? That's signal.
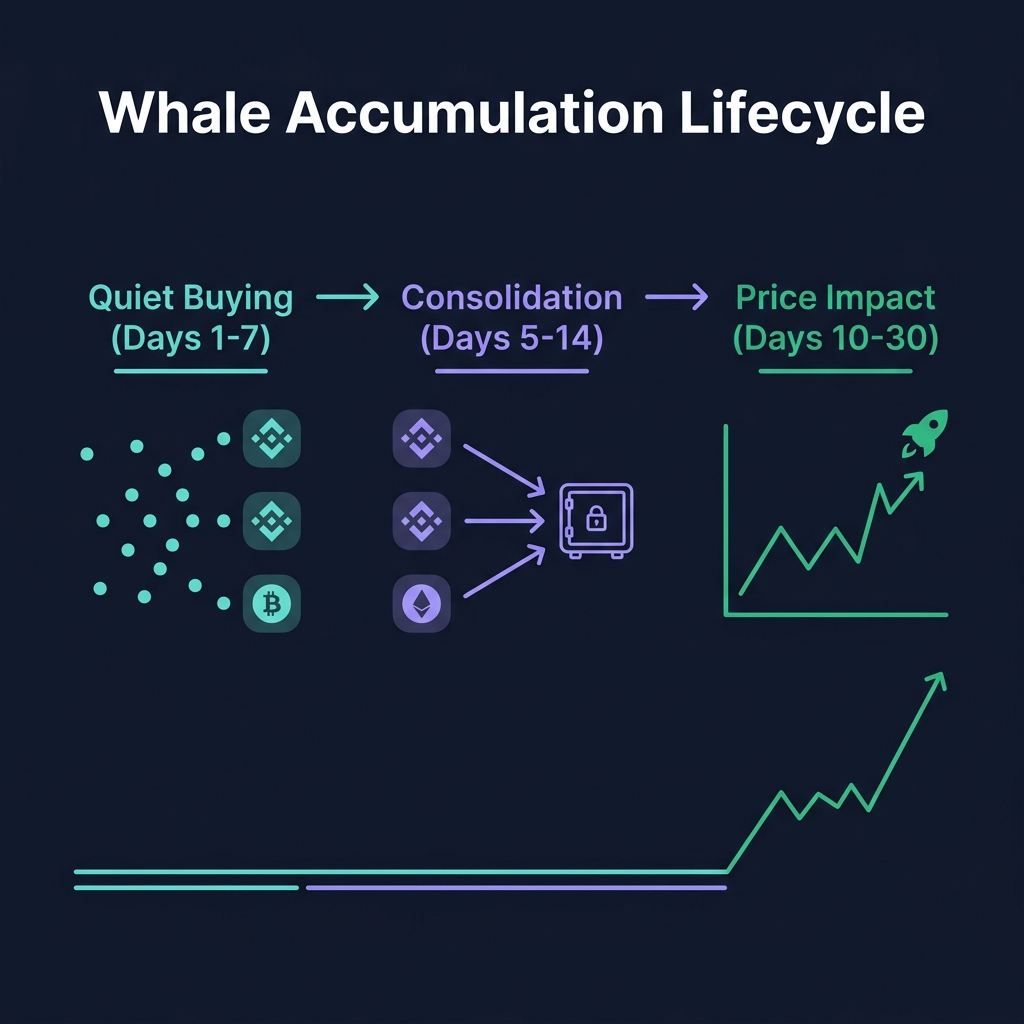
The Whale Accumulation Lifecycle
Understanding the lifecycle helps you time your trades relative to the whale's position.
Phase 1: Quiet Buying (Days 1–7)
What happens: The whale begins acquiring the token through multiple channels simultaneously — small orders across 3–5 exchanges, OTC desk purchases, and sometimes DeFi accumulation through limit orders on decentralized exchanges.
On-chain signal: Wallet cluster shows increasing token balance despite no large individual transactions. Each buy is small enough to avoid triggering exchange-level whale alerts.
Price impact: Minimal. Volume might increase slightly, but price remains range-bound because the buying is distributed across venues and time.
AI detection: Behavioral pattern matching identifies the gradual accumulation sequence. Anomaly detection flags the entity's new exposure to this token (if it's a first-time holding) or the deviation from normal buying cadence.
Phase 2: On-Chain Consolidation (Days 5–14)
What happens: After accumulating on exchanges, the whale begins withdrawing to cold storage or depositing into DeFi protocols as collateral. This is the highest-conviction phase because moving to cold storage signals intent to hold, not to trade.
On-chain signal: Large exchange outflows to identified cold storage addresses. The whale's total on-exchange balance decreases while total holdings increase.
Price impact: Moderate. Exchange supply decreases, reducing available sell-side liquidity. This creates the conditions for Phase 3.
AI detection: Exchange flow analysis identifies the outflow pattern. Wallet clustering connects the exchange withdrawals to the same entity that was buying in Phase 1. The AI now has high confidence that this is genuine accumulation, not exchange rebalancing.
Phase 3: Price Impact (Days 10–30)
What happens: The cumulative effect of reduced exchange supply and continued buying pressure finally overwhelms available sell-side liquidity. Price begins to move.
On-chain signal: Exchange reserves for the token reach local lows. The whale may stop buying (position is complete) or switch to more aggressive buying as the breakout begins.
Price impact: Significant. Breakouts of 20–50% are common after multi-week whale accumulation phases, particularly for mid-cap tokens where the whale's position represents a meaningful percentage of circulating supply.
AI detection: The system generates a high-confidence alert combining: confirmed accumulation pattern + exchange supply reduction + anomalous volume increase. By this phase, the AI has been tracking the setup for days or weeks.
Practical: How CoinXSight's Whale Detection Works
CoinXSight integrates all three AI layers into a unified whale tracking system accessible through the On-Chain Module:
Whale Stream
The real-time feed of significant whale transactions, filtered to remove noise (exchange rebalancing, protocol operations) and labeled with:
Entity type: Known fund, identified whale cluster, new wallet
Confidence score: How confident the AI is that this is genuine directional activity (not noise)
Net Flow Analysis
Aggregated view showing whether whales are net buyers or sellers for each major token over 24H, 7D, and 30D periods. This strips away individual transaction complexity and shows the bottom line: is smart money flowing in or out?
Accumulation Alerts
AI-generated notifications when a whale cluster triggers multiple accumulation signals simultaneously. These alerts include:
The token being accumulated
Estimated position size
Phase of accumulation (quiet buying, consolidation, or impact)
Historical accuracy of this entity's previous accumulation patterns
Case Studies: AI-Detected Accumulation Before Major Moves
Case Study 1: SOL Accumulation Before the 2025 Rally
In late 2024, CoinXSight's wallet clustering identified a group of 23 related wallets that began systematically buying SOL between $140–$160 over a 12-day period — a pattern consistent with the smart money flow dynamics we've documented extensively. Key signals:
Phase 1: Small buys averaging $300K each across Binance, Coinbase, and Bybit — individually unremarkable
Phase 2: Exchange withdrawals totaling 180,000 SOL moved to cold storage over 5 days
Anomaly trigger: This entity had never held SOL before — first-time exposure for a wallet cluster previously focused on ETH and BTC
The total accumulated position was approximately $28 million. Within 21 days of the accumulation completing, SOL rallied from $158 to $210 — a 33% move that "surprised" most of the market.
Case Study 2: ETH Distribution Before the April 2026 Correction
Conversely, AI detected distribution patterns from three major whale clusters beginning in early April 2026. Signals:
Exchange deposits: 45,000 ETH moved from cold storage to exchange hot wallets over 8 days
Behavioral shift: These entities switched from 6+ months of accumulation to active distribution
Options activity: Correlated increase in put option purchases from the same entities
ETH corrected 18% over the following two weeks, validating the distribution signal.
Integrating Whale Detection Into Your Trading
Daily Workflow
Morning (5 minutes): Check the Whale Stream for overnight significant transactions. Filter by your watchlist tokens.
Before any trade: Verify that net whale flow is aligned with your trade direction. Don't buy when whales are selling.
Weekly (during your Sunday routine): Review 7-day net flow trends. Add tokens showing whale accumulation to your watchlist.
Signal Weighting
Whale data should be used as confirmation, not as a primary signal:
Scenario
Action
Technical setup bullish + whale accumulating
High conviction — full position
Technical setup bullish + whale neutral
Normal conviction — standard position
Technical setup bullish + whale distributing
Low conviction — skip or reduce size by 50%
No technical setup + whale accumulating
Add to watchlist, wait for technical confirmation
Position Sizing Adjustments
When whale accumulation confirms your technical setup, consider increasing conviction:
Standard position: 1% portfolio risk
Whale-confirmed position: Up to 1.5% portfolio risk
Multiple whale clusters accumulating: Up to 2% portfolio risk (rare, high conviction)
Never exceed your maximum position size rules, regardless of whale confirmation. For detailed position sizing frameworks, see our Risk Management Guide.
When AI Whale Detection Gets It Wrong
No system is perfect. Understanding the failure modes helps you avoid costly mistakes:
Exchange Rebalancing
Even with AI filtering, some exchange internal transfers are misclassified as whale activity. Mitigation: Look for exchange withdrawals TO cold storage, not transfers between exchange wallets.
OTC Desk Activity
Large OTC trades may appear on-chain as massive accumulation or distribution, but they're often pre-arranged deals that don't reflect market sentiment. Mitigation: Check if the counterparty is a known OTC desk. If yes, reduce confidence weighting.
Protocol Treasury Management
DAOs and protocol foundations regularly manage their treasuries — diversifying, paying contributors, or rebalancing. These look like whale distribution but have zero market sentiment value. Mitigation: AI labels known protocol treasuries to exclude them from directional analysis.
Coordinated Pump Groups
Some entities intentionally create fake "accumulation" signals by making many small purchases across wallets, hoping that whale watchers will follow. Mitigation: Cross-reference with token fundamentals. If a low-cap, low-utility token suddenly shows "whale accumulation" with no fundamental catalyst, treat with extreme skepticism.
Frequently Asked Questions
Q: Can AI track whales across all blockchains?
Currently, comprehensive whale tracking works best on transparent chains like Ethereum, Bitcoin, and Solana where all transactions are publicly visible. Privacy-focused chains (Monero, Zcash in shielded mode) are inherently resistant to whale tracking. Cross-chain tracking is improving but still has gaps at bridge boundaries.
Q: How far in advance does AI detect accumulation before price moves?
Typically 3–14 days. Phase 1 (quiet buying) can be detected within 2–3 days if the AI has previously clustered the entity's wallets. Phase 2 (consolidation) is the highest-confidence signal and usually precedes price impact by 5–10 days.
Q: Do whales know they're being tracked?
Yes, sophisticated whales are aware of on-chain analytics. This has led to an arms race: whales use increasingly complex obfuscation (splitting across more wallets, using mixers, timing transactions to look normal), and AI responds with more advanced clustering and anomaly detection. The advantage still favors AI because even obfuscated behavior creates statistical patterns that machine learning can identify.
Q: Should I follow every whale accumulation alert?
No. Whale accumulation is a confirmation signal, not a standalone strategy. Many whales take positions with 12–24 month time horizons that are impractical for retail traders. Always combine whale data with technical analysis, sentiment, and your own trading timeframe.
Q: How is whale tracking different from copy trading?
Whale tracking identifies what large players are doing to inform your own analysis. Copy trading blindly replicates another trader's positions. The key difference: whale tracking gives you information, copy trading gives you dependency. Use whale data as one input in your decision framework, not as a replacement for judgment.
Building Your Whale Intelligence System
Start integrating whale detection into your process today:
Week 1: Observe. Open the On-Chain Module daily and familiarize yourself with the Whale Stream and Net Flow data. Don't act on it yet.
Week 2: Correlate. For every trade you take, note the whale flow direction. After 10+ trades, you'll start seeing whether whale alignment improves your results.
Week 3: Integrate. Begin using whale flow as a confirmation filter — adjusting position sizes based on whale alignment as described above.
Week 4+: Refine. Track your whale-confirmed trades separately from non-confirmed trades. The data will show you exactly how much edge whale intelligence adds to your specific strategy.
The whales aren't going away. But with AI, you can finally see what they're doing — before the rest of the market catches on.
DP
David Park
ON-CHAIN // ALPHA
Chief On-Chain Data Analyst·On-Chain Forensics Desk
On-chain data engineer tracking entity-adjusted exchange netflows, smart money clustering, whale wallet accumulation, and liquidity cluster dynamics.
QUANTITATIVE SUITE // DEEP ALPHA ENGINEACTIVE
BTC/USDT // LIVE SCANNER
CONFLUENCE 93
LIVE SPOT PRICE$83,908.89STRONG_BUY
TP2
$89,725.68
+6.94%
TP1
$86,233.44
+2.77%
ENTRY
$83,905.28
ZONE
SL
$82,741.19
-1.39%
Auto-detect Order Blocks, Fair Value Gaps and risk-adjusted DCA ladders in < 5s.