Liquidity Sweeps Explained: How Stop Hunts Create Crypto Trading Opportunities
Understand liquidity sweeps and stop hunts in crypto. Learn how institutions grab liquidity below support, and how to trade the reversal using CoinXSight's SMC engine.
MC
Marcus ChenSenior Quantitative Strategist·May 16, 2026 · 10 min read · Updated Oct 6
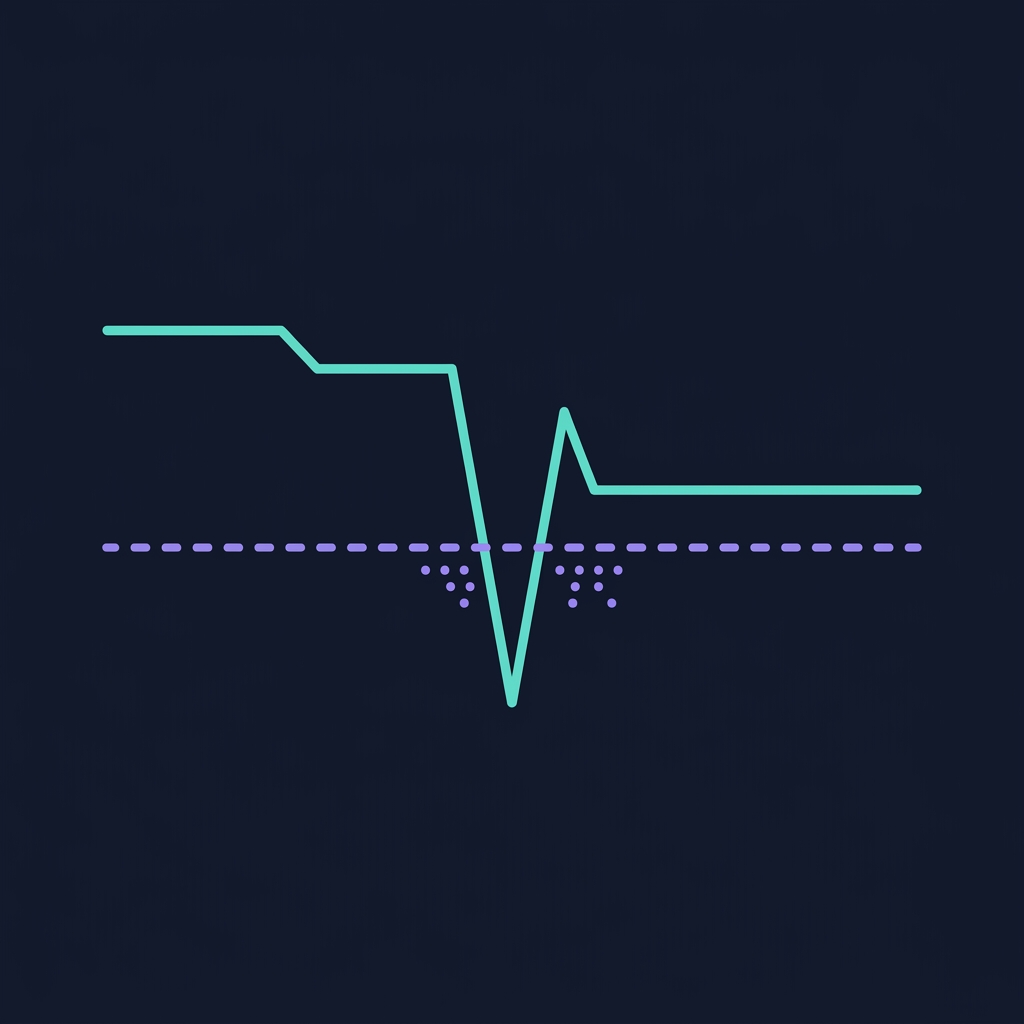
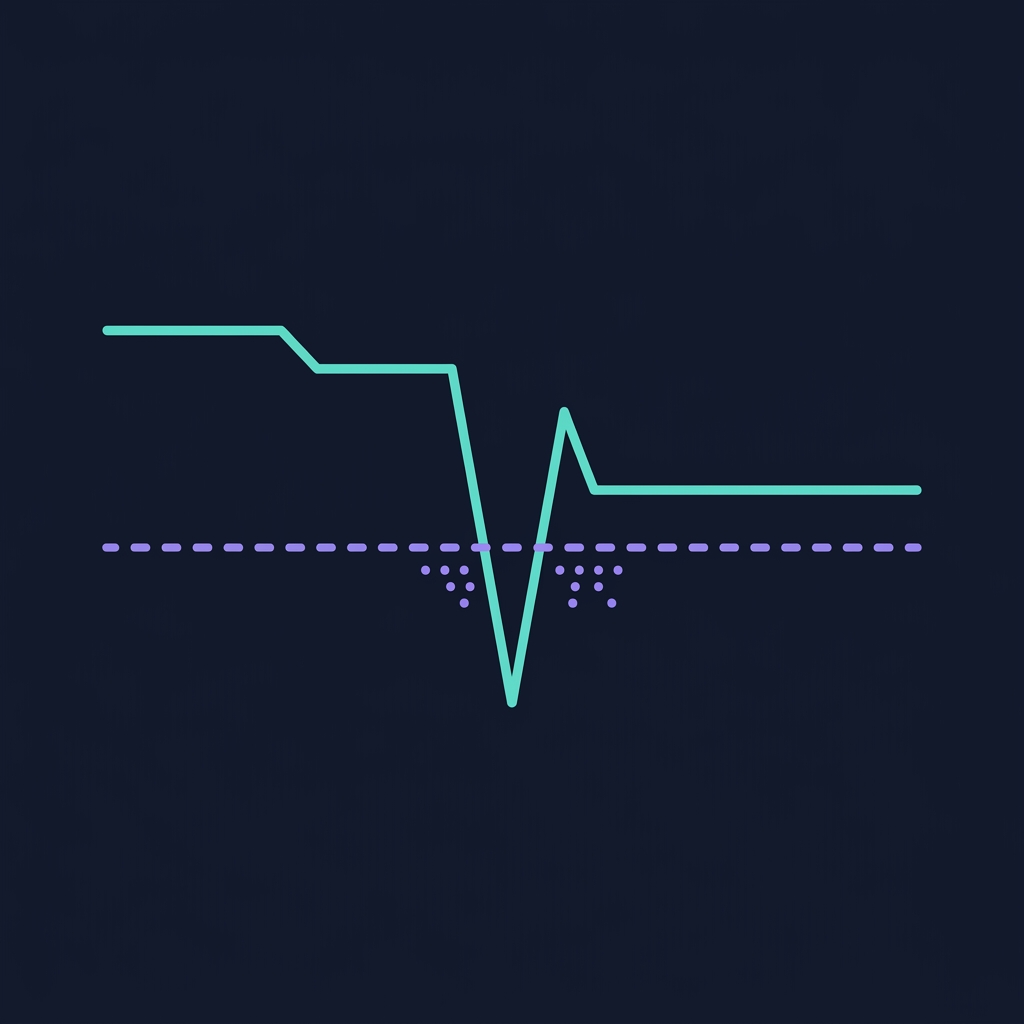
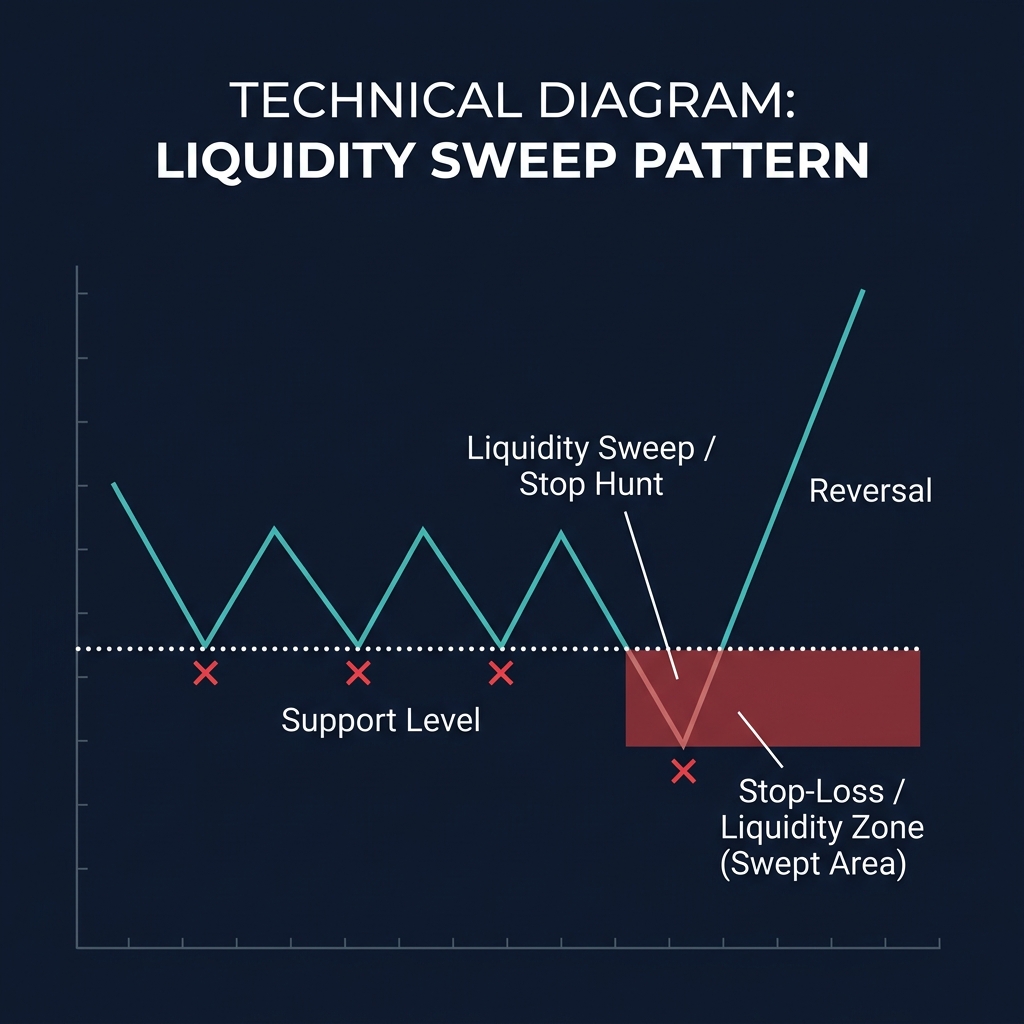
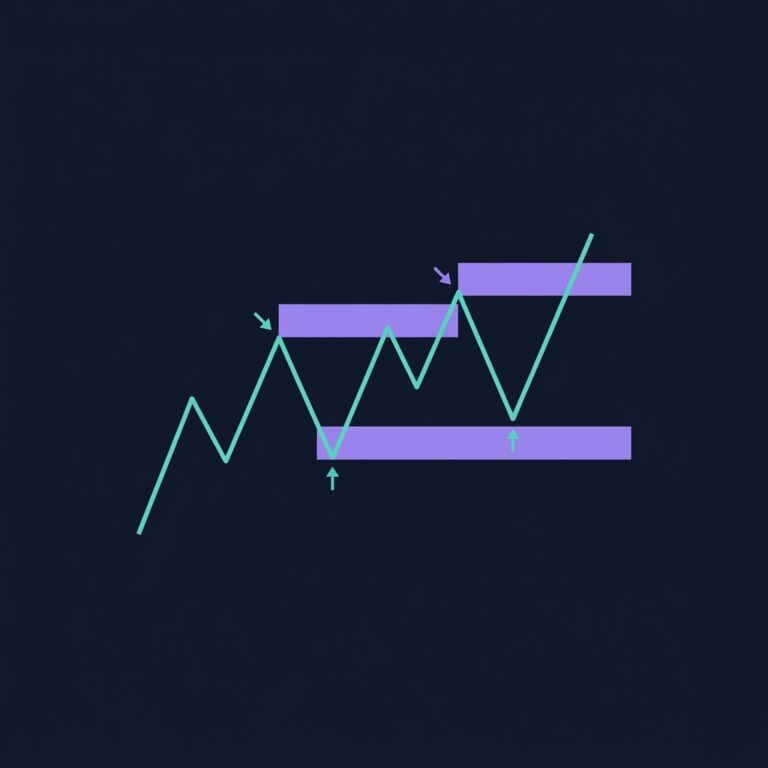
A liquidity sweep (also called a stop hunt or liquidity grab) occurs when price briefly moves beyond a key support or resistance level — triggering stop-loss orders clustered at that level — then immediately reverses. This is not random price noise. It is a deliberate mechanism used by large players to fill their orders using the liquidity created by retail stop-losses.
Why institutions need liquidity sweeps: A fund wanting to buy $20M of BTC cannot place a single market order without moving the price against themselves. Instead, they trigger a cascade of stop-losses below a well-known support level — those stop-losses create sell orders that the institution absorbs as buy orders at a discounted price. The result: price briefly dips below support, retail traders get stopped out, and the institution fills their position at a better price.
💡 On CoinXSight, liquidity zones are identified automatically by the platform's SMC engine and surfaced across multiple modules — Deep Alpha flags them in the SMC panel, Chart Pro marks them visually on the chart, and Discovery uses them in signal triage. The Whale Alerts sidebar shows real-time large transactions that often coincide with liquidity sweeps.
How Liquidity Sweeps Work — Step by Step
Phase 1: Liquidity Builds
Stop-loss orders accumulate in predictable locations:
Below obvious support levels — where textbook traders place their stop-losses
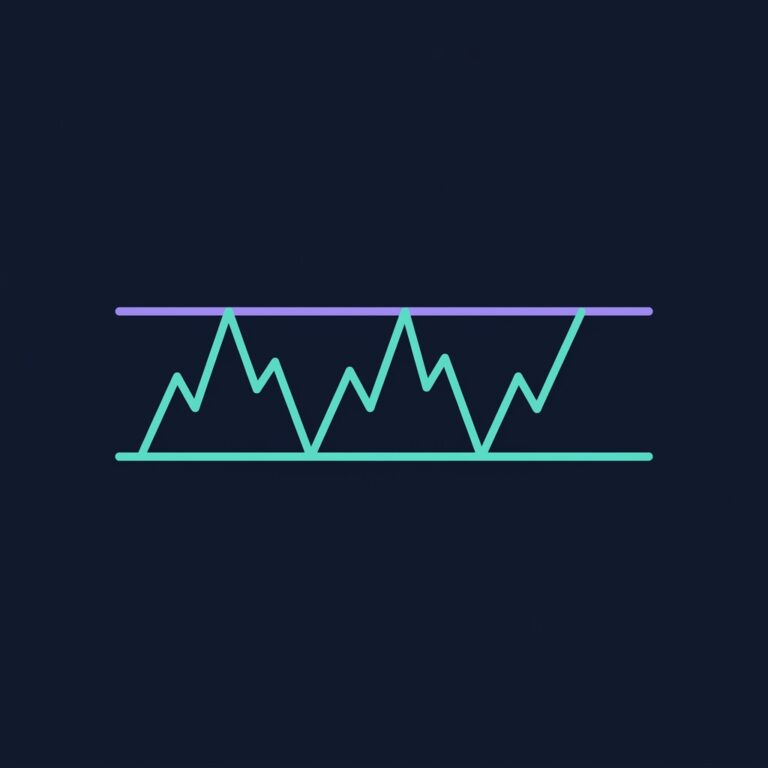
Below equal lows — a series of lows at the same price creates a visible "floor" that retail traders anchor to
Above obvious resistance — where short sellers place their stop-losses
Above equal highs — the mirror image of equal lows
The more visible the level, the more stop-losses cluster there, and the more attractive it is for institutions to sweep.
Phase 2: The Sweep
Price moves beyond the level, triggering the clustered stop-losses:
A bullish sweep dips below support, triggers sell stops, then reverses upward
A bearish sweep spikes above resistance, triggers buy stops, then reverses downward
Key identification features:
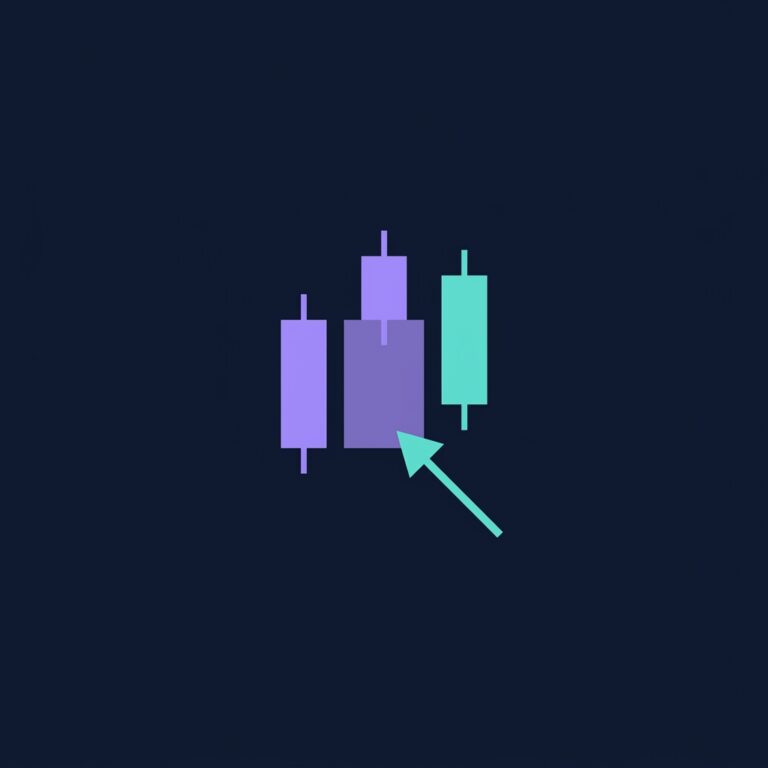
The sweep candle has a long wick beyond the level but closes back inside
Volume spikes during the sweep — this is the liquidity being absorbed
The move beyond the level is brief (1-3 candles, often just a wick)
Phase 3: The Reversal
After absorbing the liquidity, the institutional order is filled, and price moves in the opposite direction — often rapidly. This reversal is the tradeable opportunity.
Identifying Liquidity Zones — Where Stops Cluster
Liquidity Type
Location
Why Stops Are Here
Buy-side liquidity
Above resistance, above equal highs
Short sellers' stop-losses
Sell-side liquidity
Below support, below equal lows
Long traders' stop-losses
Trendline liquidity
Below ascending trendlines
Traders using trendlines as stops
Round number liquidity
Below $70,000, $80,000, etc.
Psychological levels attract stops
The equal lows trap: When price creates two or three lows at nearly the same price (e.g., $68,000, $68,050, $67,980), retail traders see a "strong support." They place stop-losses just below this floor — at $67,500 or $67,000. This creates a dense pool of sell orders that institutions can sweep.
Real-World Scenario: BTC Liquidity Sweep on CoinXSight
As a comprehensive crypto analytics platform, CoinXSight makes this analysis accessible through its integrated toolset:
Scenario — BTC, May 2026, 4H chart:
On May 3, 2026, BTC had established three equal lows around $76,500 over the previous 10 days. Retail traders viewed this as "strong support" and placed stop-losses below $76,000.
What CoinXSight showed before the sweep:
Deep Alpha — SMC Panel:
"Sell-side liquidity cluster: $75,800-$76,000"
Bullish Order Block below at $74,800-$75,200 (unmitigated)
EMA 89 at $75,600 — converging with the liquidity zone
On-Chain data:
Exchange reserves dropping for 3 consecutive days — whales were accumulating
$15.6M in exchange outflows during the 24 hours before the sweep
The sweep:
On May 5, BTC dropped from $77,200 to $75,400 in a single 4H candle — sweeping below the $76,000 stop-loss cluster. The candle wick touched $75,400 (inside the Order Block at $74,800-$75,200) and closed back above $76,200.
Volume: 1.5/2.0 (volume 1.8x average during sweep)
Whale bonus: +0.5
Total: 8.5/10
BTC reversed from $75,400 and rallied to $81,300 over the next 7 days — a 7.8% move from the sweep low. Traders who recognized the liquidity sweep and entered at the Order Block captured the entire recovery.
⚠️ Limitation: Not every move beyond support is a liquidity sweep. Sometimes price breaks support and continues lower — this is a genuine breakdown, not a sweep. The difference: a sweep is a brief wick followed by an immediate reversal candle; a breakdown is a sustained close below the level with follow-through selling. Always wait for the reversal candle before entering.
3 Liquidity Sweep Trading Techniques
Technique 1: Sweep + Order Block Entry
The highest-probability sweep trade occurs when price sweeps liquidity and lands in an unmitigated Order Block.
Entry criteria:
Identify a liquidity pool below obvious support (equal lows, horizontal S&R)
Locate an Order Block below the liquidity pool
Wait for price to sweep through the stops and enter the OB zone
Enter when the sweep candle closes with a long wick back inside the range
Stop-loss below the Order Block
Target: the high that preceded the sweep, then the next resistance
Technique 2: Sweep + FVG Confluence
When a liquidity sweep coincides with an unfilled Fair Value Gap, the probability increases further:
The sweep fills the FVG (rebalancing)
The sweep absorbs stop-loss liquidity
Both actions complete simultaneously → double reason for reversal
Technique 3: Counter-Sweep Timing with On-Chain
Use CoinXSight's On-Chain module to time entries during sweeps:
Before the sweep: Watch for declining exchange reserves and increasing whale outflows → institutions are positioning
During the sweep: Large exchange inflows may appear as retail gets stopped out → this IS the sweep
After the sweep: If exchange outflows resume immediately → institutions absorbed the liquidity → bullish reversal likely
Common Liquidity Sweep Mistakes
Trying to predict sweeps before they happen: You cannot know in advance exactly when a sweep will occur. Identify the liquidity zones, set alerts, and wait for price to show you the sweep with a rejection candle.
Entering during the sweep (not after): Buying while price is still falling through the liquidity zone is catching a knife. Wait for the reversal candle — a strong close back above the swept level.
Confusing a breakdown with a sweep: If price closes below support with high volume and follow-through selling on the next candle, it is a breakdown, not a sweep. A sweep produces an immediate V-shaped reversal.
Ignoring the higher timeframe trend: A liquidity sweep below support in a macro downtrend is far more likely to be a real breakdown. Sweeps produce the best results when the higher-timeframe trend supports the reversal direction.
How to Trade Liquidity Sweeps on CoinXSight — Multi-Module Workflow
The hardest skill in sweep trading is patience. You know the liquidity is sitting below equal lows. You can see the stop-loss cluster forming. But you cannot enter until the sweep actually happens and reverses. Here is the exact process I follow to avoid jumping the gun.
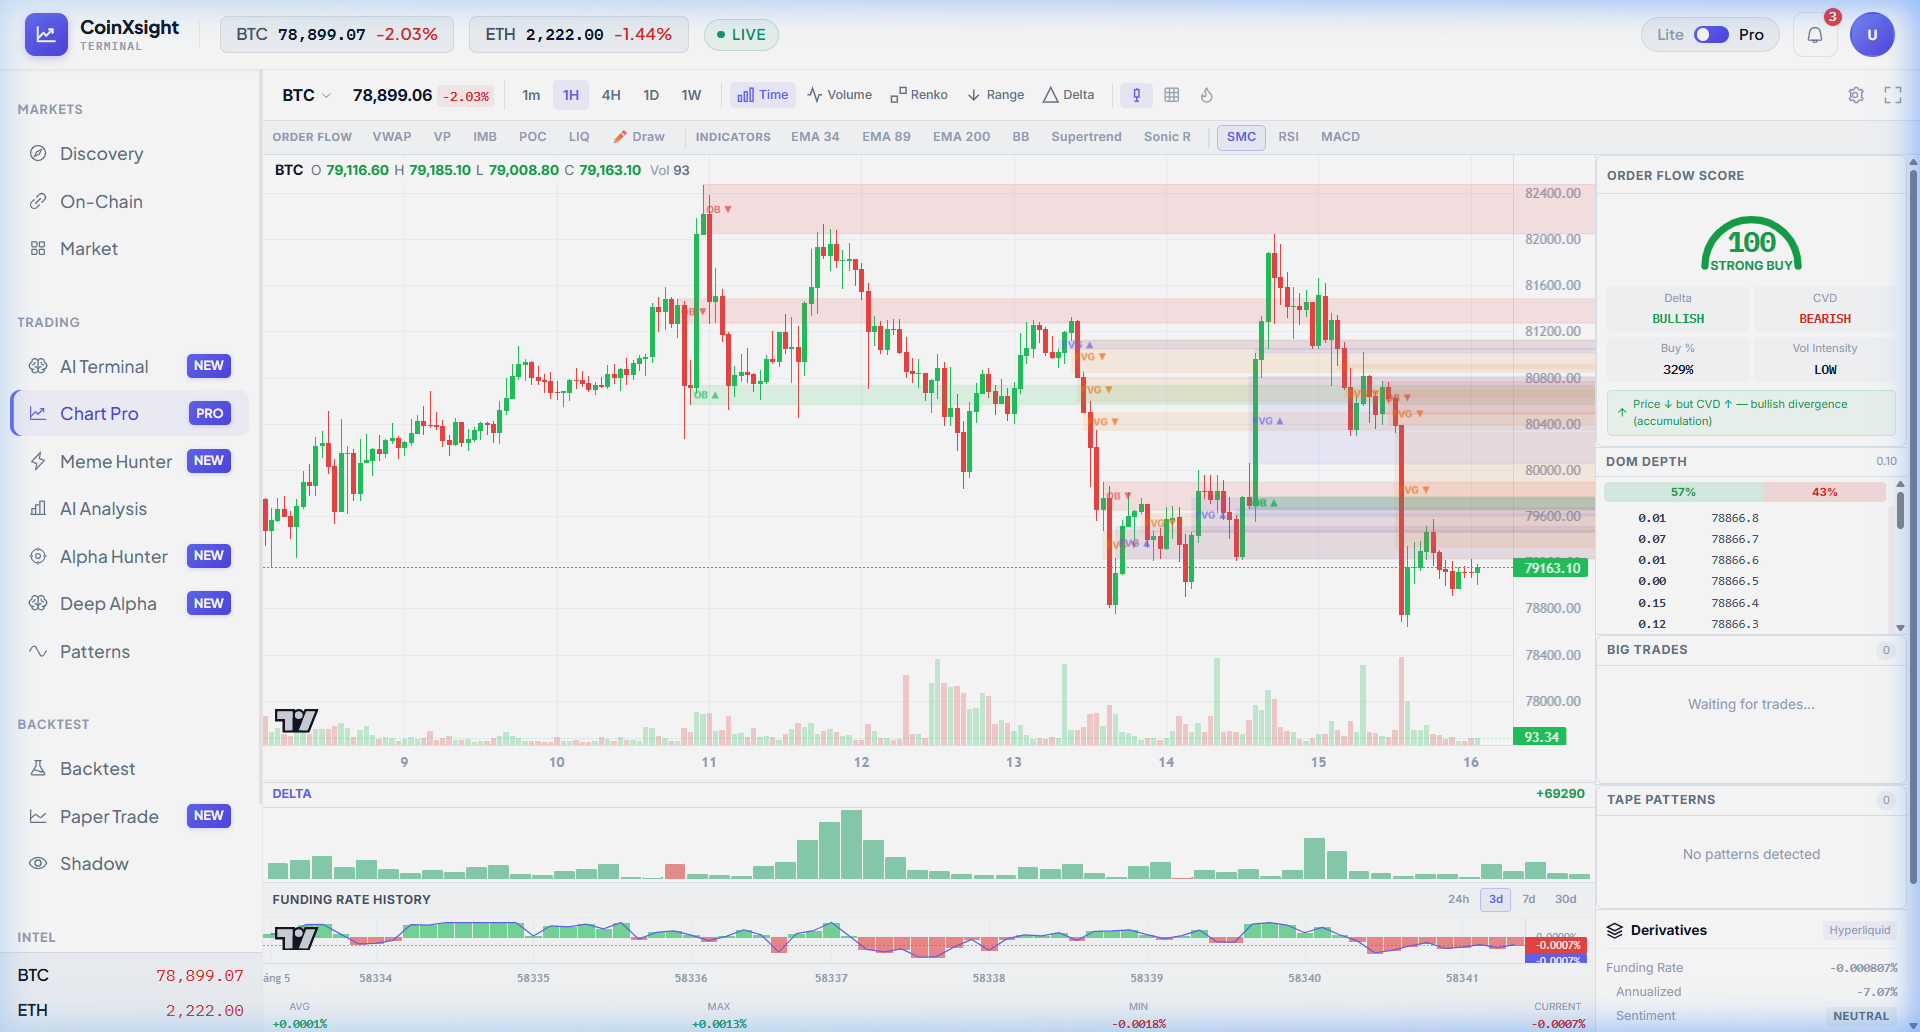
Open Chart Pro → toggle SMC from the indicator toolbar. In the screenshot below, BTC 1H shows critical liquidity architecture. Focus on the labeled zones:
"OB ▼" at $82,000-$82,400 (red zone) — this is a bearish Order Block that also represents buy-side liquidity. Any shorts with stops above $82,400 created a liquidity pool there. Price swept this zone and reversed sharply downward — that is a textbook bearish liquidity sweep.
"OB ▲" at $79,800-$80,200 (green zone) — this bullish Order Block sits right where sell-side liquidity pools. Traders who went long near $80,000 with tight stops below $79,800 are vulnerable. If price sweeps below this zone and immediately reverses, that is the buy entry.
Notice the BOS labels connecting swing points — each BOS confirms the structural trend. A sweep that reverses into a BOS confirmation is the highest-probability setup. The current chart shows bearish BOS below $80,000 is still pending — meaning if price sweeps below the OB ▲ zone and then prints a bullish BOS back above it, that is the entry trigger.
Before a sweep happens, Deep Alpha tells you whether the setup has backing. Navigate to Deep Alpha → search BTC. The header shows MTF Alignment: MOSTLY_BEARISH. This is critical context: in a bearish multi-timeframe environment, sell-side sweeps (below support) are more likely to be genuine breakdowns, not reversals. Bullish sweep trades work best when the higher-timeframe trend supports the reversal direction. With MOSTLY_BEARISH alignment, I would size down any bullish sweep entry to 50% of normal, or wait for MTF to shift to MIXED first.
Step 3: Track institutional flow during the sweep on On-Chain
The single best real-time filter for sweep quality: watch exchange flows during the sweep. Navigate to On-Chain. Currently, Exchange Inflow is +$32.8M — capital flowing IN. During a true bullish sweep, you want to see this number flip: retail sells into exchanges (the sweep), then institutional outflows begin (the absorption). If inflows remain high after the sweep candle, institutions are not absorbing — the "sweep" is actually a breakdown. In the current environment, the sustained inflow tells me this is not the time for aggressive sweep entries.
Frequently Asked Questions
How do I tell the difference between a liquidity sweep and a real breakdown?
A sweep produces a rapid reversal — typically within 1-3 candles. The sweep candle has a long wick beyond the level but closes back inside the range. A real breakdown has follow-through: the candle closes below the level, the next candle continues lower, and volume sustains. If you see two consecutive closes below support with increasing volume, it is likely a breakdown.
Why do institutions need to sweep liquidity?
Large orders cannot be filled in thin markets without moving the price. By triggering stop-losses, institutions create a temporary flood of orders that they can absorb as counter-parties. A $10M buy order needs $10M in sell orders to match against — stop-loss cascades provide exactly that.
Can I use liquidity sweeps on any timeframe?
Higher timeframes produce more reliable sweeps because they represent larger institutional activity. Daily and 4H sweeps are the most tradeable. 1H sweeps can work for fine-tuning entries within a higher-timeframe setup. Below 1H, the noise level makes it difficult to distinguish sweeps from random volatility.
How does CoinXSight detect liquidity zones?
CoinXSight's SMC engine identifies areas where stop-losses are likely to cluster: below equal lows, below horizontal support, above equal highs, and above horizontal resistance. The engine tracks whether these zones have been swept (visited and reversed from) or remain untested.
Should I always trade the reversal after a sweep?
Not always. A sweep is most tradeable when it coincides with other SMC and technical factors — an Order Block, a Fair Value Gap, oversold RSI, and whale accumulation. A naked sweep without supporting factors has a lower win rate. Use CoinXSight's Confluence Score to filter: 7+/10 at the sweep low is a strong entry signal.