When systemic shockwaves from the $6.3 billion Binance DevOps security breach collided with Wall Street’s $1.8 trillion Friday equity drawdown, the cryptocurrency derivatives landscape suffered its most violent deleveraging event since the collapse of FTX. Across an intense 12-hour liquidation window concluding October 31, automated liquidation engines wiped out over $1.57 billion in leveraged positioning across major perpetual venues, with over-leveraged longs accounting for 84.2% of all forced closures.
Yet beneath the catastrophic headline figures, a profound structural divergence materialized across digital asset orderbooks. While secondary altcoins experienced severe liquidity evaporation—plunging between 8% and 22%—Bitcoin demonstrated institutional-grade absorption capability. Spot taker bids aggressively defended the $76,500 to $77,500 baseline, maintaining market composure while systemic leverage was cleanly excised from the perpetual complex.
Anatomy of the Cascade: How Long Leverage Was Methodically Liquidated
The liquidation cascade was catalyzed by compounding cross-asset margin calls. Following the closure of traditional U.S. financial markets, institutional multi-strategy desks faced immediate capital replenishment demands to cover equity index shortfalls. Digital asset markets, operating 24/7 with instantaneous on-chain liquidity, became the immediate venue for emergency collateral extraction.
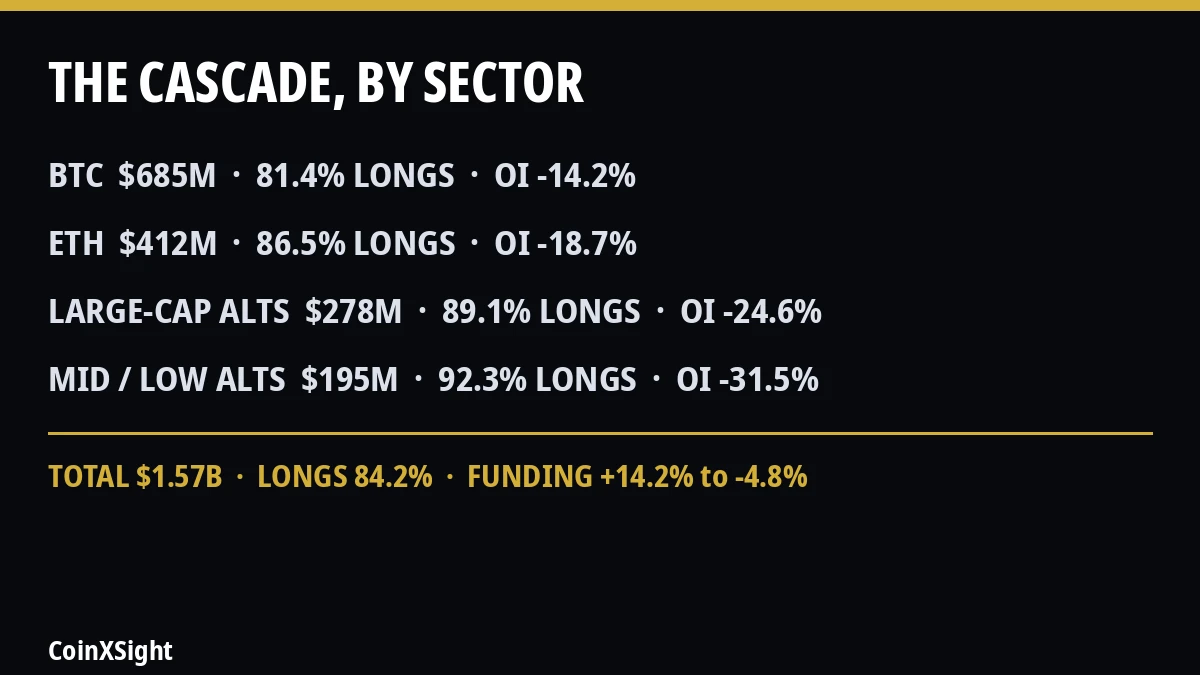
Perpetual orderbooks were ill-prepared for the sudden concentration of market sells. As automated margin call thresholds triggered on Binance, OKX, and Bybit, trailing liquidation algos initiated cascading market-order unrolls:
Asset Sector
24H Liquidation Volume
Long / Short Ratio
Open Interest Contraction
Spot Price Impact
Bitcoin ($BTC)
$685,000,000
81.4% Longs
-14.2% ($2.1B erased)
-3.8% (Defended $77,200)
Ethereum ($ETH)
$412,000,000
86.5% Longs
-18.7% ($940M erased)
-6.4% (Tested $2,480)
Large-Cap Altcoins (SOL, XRP, ADA)
$278,000,000
89.1% Longs
-24.6% ($610M erased)
-9.5% to -14.2%
Mid/Low-Cap Altcoins & Memecoins
$195,000,000
92.3% Longs
-31.5% ($380M erased)
-16.0% to -23.5%
The asymmetry between Bitcoin and the broader market highlights the structural divide in institutional custody. While altcoin open interest contracted by nearly a third as retail stops cascaded into empty bid books, Bitcoin’s liquidation volume was met with dense, resting institutional limit orders.
Funding Rate Inversion: The Pivot from Greed to Deep Negative Sentiment
The immediate consequence of the cascade was a violent reset in derivative financing costs. Perpetual funding rates across Bitcoin pairs plummeted from an annualized +14.2% (reflecting aggressive pre-PCE speculative longs) to an inverted -4.8% baseline.
This statistical inversion is highly diagnostic for quantitative desks. Negative funding indicates that market participants are aggressively bidding perpetual short contracts, paying a premium to hedge spot holdings or speculate on further downside continuation. Historically, sustained negative funding amidst resilient spot orderbooks marks a classical structural bottoming signal—the perpetual basis becomes unsustainably discounted relative to spot index prices, creating the conditions for sharp short squeezes.
Meanwhile, Cumulative Volume Delta (CVD) profiles demonstrated a stark dichotomy between venues:
– Derivatives CVD: Slid into deeply negative territory, driven by forced liquidation orders and aggressive taker short fills.
– Spot CVD (Coinbase, Bitstamp, Kraken): Exhibited sharp upward curvature, confirming that institutional allocators and treasury managers were actively absorbing dumped coins without pushing price lower.
Why the $77K Orderbook Defended While Altcoins Fractured
The resilience of the $77,000 zone can be attributed to three interlocking microstructure mechanics:
1. Exchange Proof-of-Reserves & Solvency Backstops: In the wake of the Binance DevOps exploit, immediate confirmation that all user deposits remained backed 1:1 and that Tether and Circle had neutralized $2.38B in illicit stablecoins prevented contagion-driven bank runs.
2. Institutional ETF Liquidity Floor: Unlike past market selloffs driven by uncollateralized lending desks (Three Arrows Capital, Celsius), institutional capital held via spot ETFs remained sticky. Net inflows of $17.2M logged into spot products during the height of the panic underscored that macro allocators viewed the $77K test as a strategic accumulation range.
3. Altcoin Liquidity Drain: Capital rotated out of high-beta speculative altcoins directly into Bitcoin and fiat cash reserves, as examined in our Altseason Rotation and Dominance Framework. Altcoins bore the brunt of collateral liquidation, sparing Bitcoin from severe price dislocations.
Strategic Outlook: The Path to Weekly Close
As digital asset markets approach the pivotal Sunday weekly candle close, the elimination of $1.57 billion in excess speculative froth has substantially cleared the derivative deck. With perpetual open interest flushed to multi-month lows and spot taker absorption intact, market microstructure has pivoted from euphoric fragility to institutional solidity.
Allocators should now monitor the restoration of funding equilibrium and spot exchange net outflow telemetry. Provided Bitcoin maintains weekly closure above the $76,500 demand shelf, the violent deleveraging of October 30–31 will be remembered not as a structural breakdown, but as a mandatory liquidity cleanse clearing the runway for November price discovery.
Disclaimer: This market microstructure analysis is provided strictly for educational and technical research purposes and does not constitute financial, investment, or trading advice. Derivatives markets involve substantial capital risk, execution slippage, and volatility. Quantitative models, liquidation heatmaps, and funding rate indicators reflect historical telemetry and do not guarantee future price trajectory. Always exercise disciplined risk management.
CX
CoinXSight Alpha Desk
ALPHA // DESK
Quantitative Research Desk·Global Alpha Division
CoinXSight Institutional Research Desk produces quantitative crypto market intelligence, algorithmic models, and on-chain forensics.
QUANTITATIVE SUITE // DEEP ALPHA ENGINEACTIVE
BTC/USDT // LIVE SCANNER
CONFLUENCE 74
LIVE SPOT PRICE$82,807.47WEAK_BUY
TP2
$89,522.75
+9.07%
TP1
$85,056.42
+3.63%
ENTRY
$82,078.86
ZONE
SL
$80,590.09
-1.81%
Auto-detect Order Blocks, Fair Value Gaps and risk-adjusted DCA ladders in < 5s.