Bitcoin’s Brutal Week: A $2 Billion Flush, Seven Straight ETF Outflows, and a Fed About to Hike
Bitcoin's sixth straight red week: a $2 billion liquidation flush, seven straight sessions of ETF outflows, and a Fed now priced to hike in December — plus Nvidia earnings and the Anthropic IPO in the week ahead.
CX
CoinXSight Alpha DeskQuantitative Research Desk·Nov 16, 2026 · Updated Nov 17
Bitcoin has now spent five straight weeks falling. This week, it stopped falling politely.
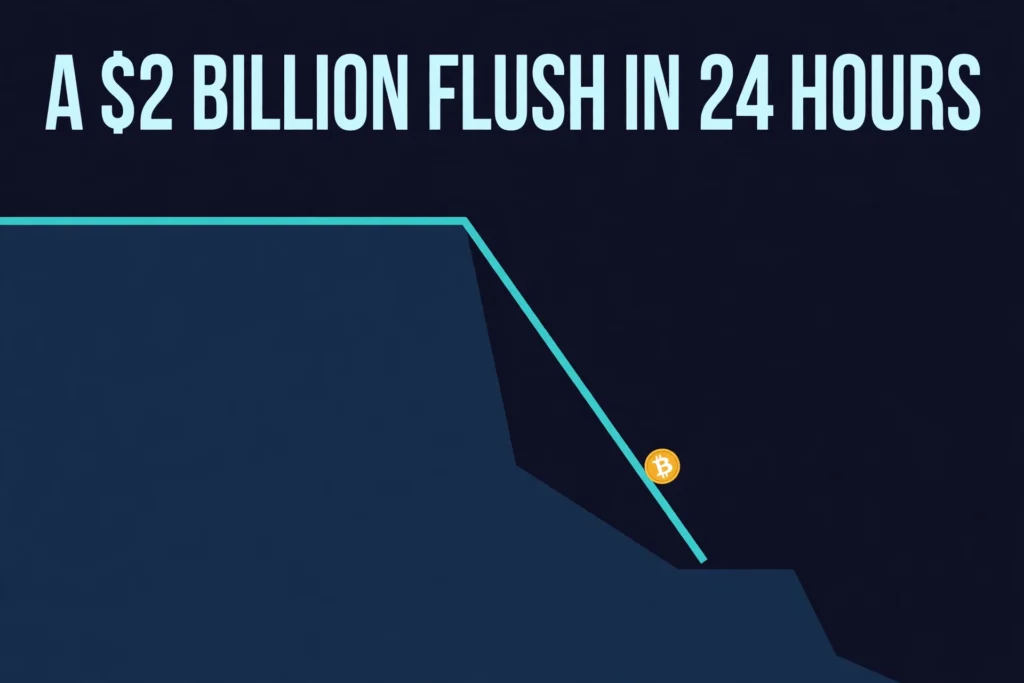
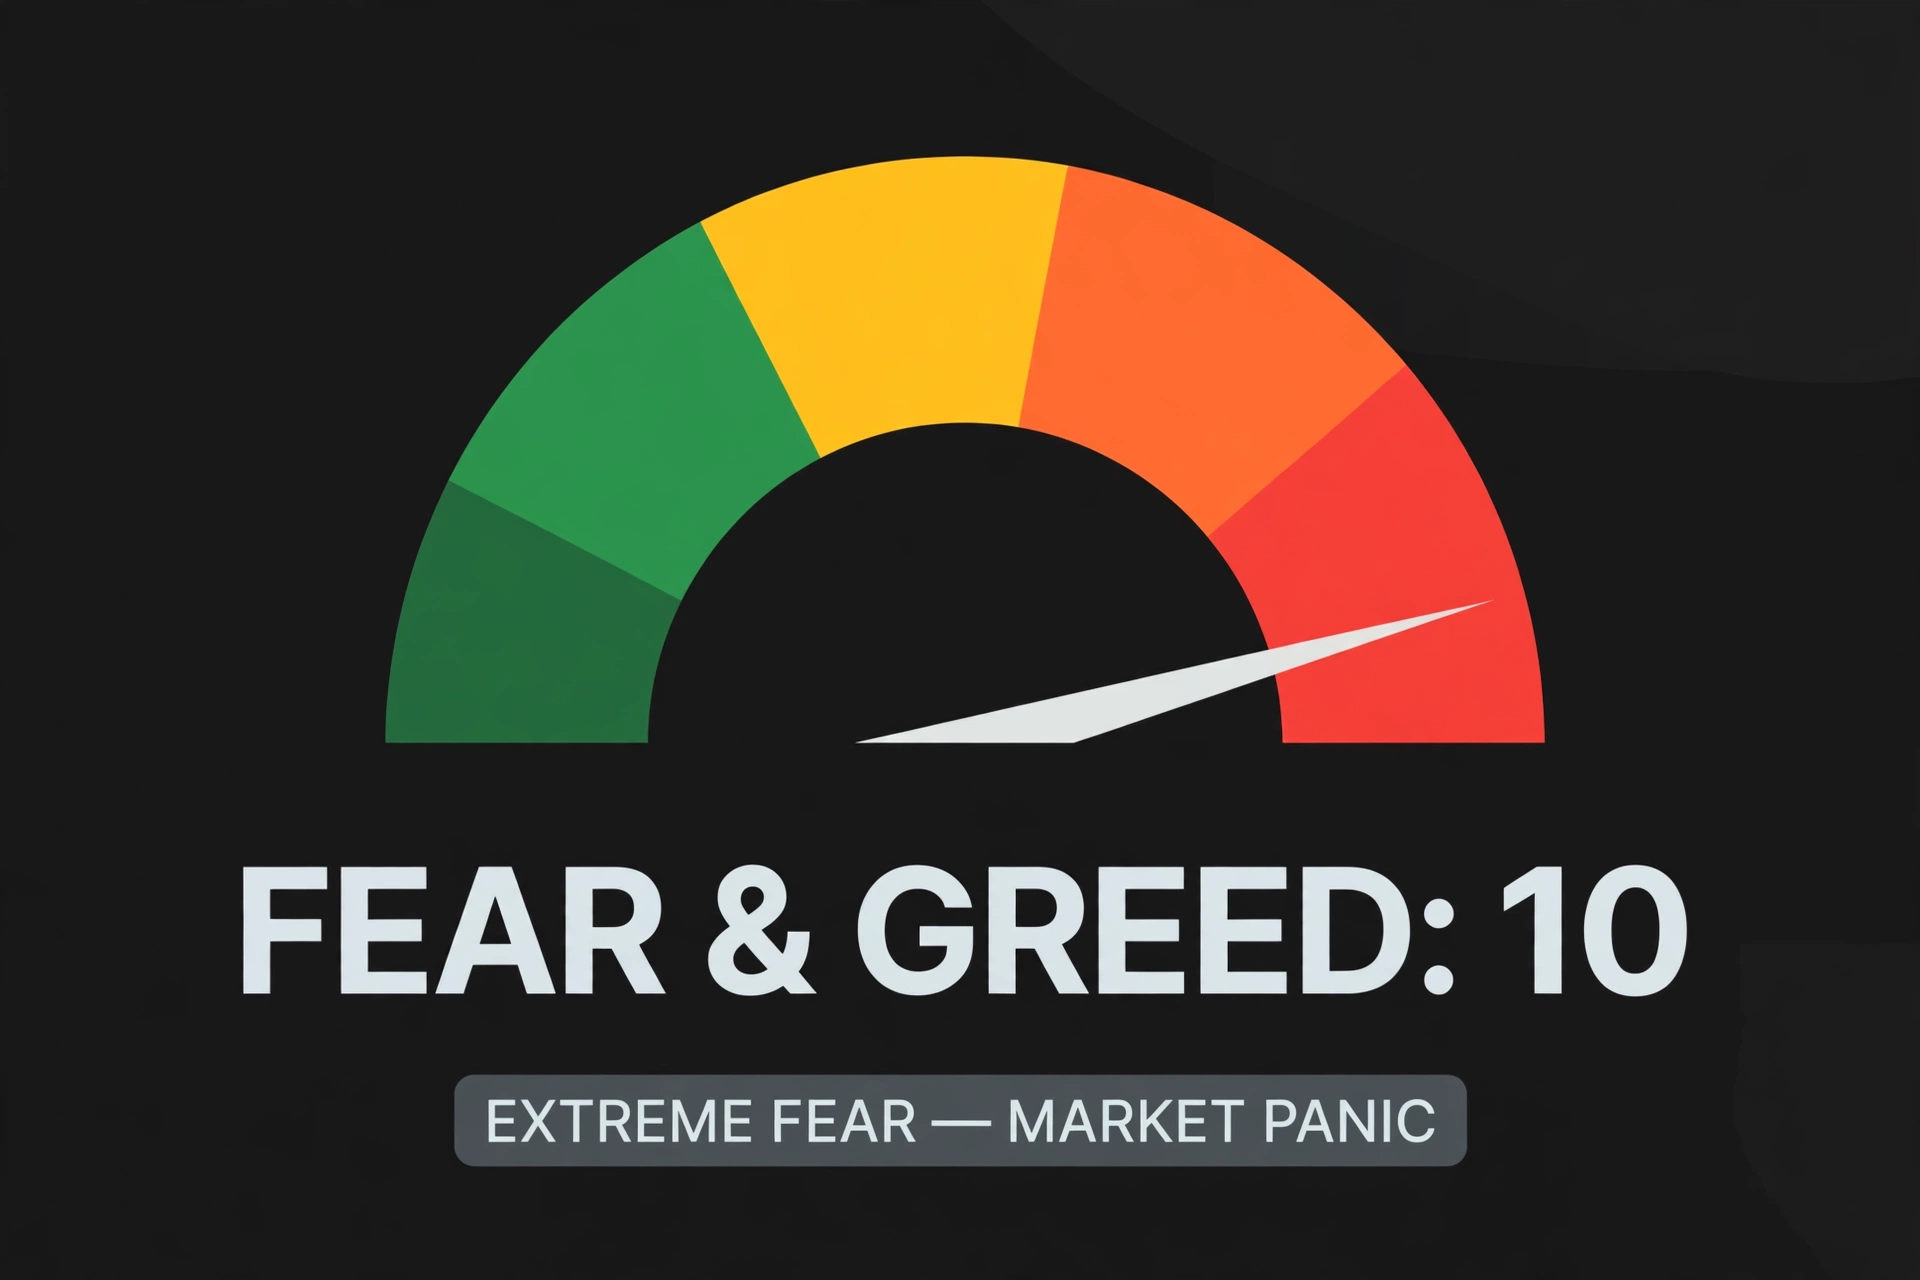
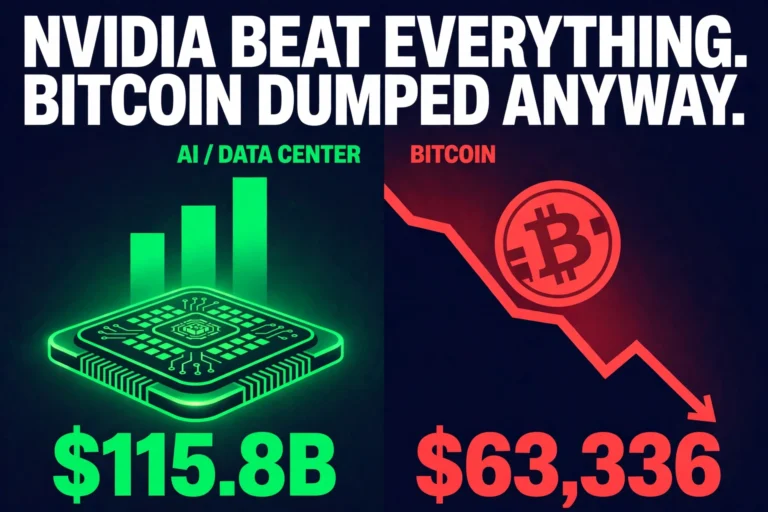
The largest cryptocurrency lost roughly 12% of its value in seven days, broke below $63,000, and at one point on Sunday morning traded at $61,946 on Coinbase — its lowest print since the summer. About $2 billion of leveraged positions were wiped out in a single day. Spot bitcoin ETFs recorded their seventh consecutive session of outflows. The Fear & Greed Index reads 10, a number that translates, in plain language, to panic.
And the week is not even over yet. The weekly candle does not close until 07:00 on Monday morning, Vietnam time. What happens between now and then decides whether this is remembered as the week bitcoin merely traded below its 200-week moving average — or the week it closed below it.
The week in numbers
Measure
Reading
Source / time
Bitcoin
$65,456 (−2.64% / 24h)
CoinGecko, Sun 15 Nov ~18:52 VN
Bitcoin, week to date
−12.4% from last weekly close $74,737.9
CoinGecko / prior close
Bitcoin, week low
$61,946 (Coinbase); lowest hourly close $62,603
Coinbase, 15 Nov
Bitcoin vs 200-week moving average
~$2,557 below the ~$68,013 line
Chart data, 15 Nov
Bitcoin vs all-time high
−48.1% from ~$126,080
CoinGecko
Ethereum
$1,832 (−4.06% / 24h), below $2,000
CoinGecko, 15 Nov
Solana
$72.53 (−4.46% / 24h)
CoinGecko, 15 Nov
Liquidations, rolling 24h
~$1.9–2.05B, ~93% long
CoinGlass via multiple outlets
Spot BTC ETFs, 7 sessions 5–13 Nov
−$1.91B; IBIT −$1.42B
Farside
Spot BTC ETFs, week 9–13 Nov
−$1.07B — five red sessions
Farside / SoSoValue
Fear & Greed Index
10 — Extreme Fear
alternative.me, 15 Nov
December Fed hike odds
~100% hike; 25bp ~88.5%, 50bp ~11.5%
CME FedWatch, 14 Nov
The flush, hour by hour
The selling did not arrive as one event. It arrived as a staircase down, and each step took out another layer of leverage.
Friday did the first damage. Roughly $1.3 billion in long crypto positions was erased over 24 hours as bitcoin broke below $70,000. That was the warning. The weekend was the execution.
Saturday’s US session took bitcoin down 5.7%. Asian trading added another 1.7%. Then, in the small hours of Sunday, the market fell through $65,000, then $64,000, then $63,000. In a single hour, about $691 million of positions were liquidated — $671 million of it long. In a 30-minute window, another $645 million of longs went. At one point, $360 million disappeared in five minutes. By Sunday morning, roughly $2 billion of leveraged bets had been closed by force in 24 hours, and somewhere between 318,000 and 329,000 traders had their positions liquidated for them.
The numbers differ slightly between sources because each is a rolling window read at a different minute of a fast weekend. The direction does not differ at all: this was longs being closed, not shorts. About 93% of the liquidations were long positions — traders who had bet prices would rise, and who were wrong, quickly and expensively.
Then came the bounce. From the $61,946 low, bitcoin recovered to around $65,500 by Sunday evening. That is a move of roughly 6% off the bottom, and it matters, because it shows buyers still exist at these levels. It does not change what the week did. A 6% bounce after a 17% fall from the week’s open is a relief rally until proven otherwise.
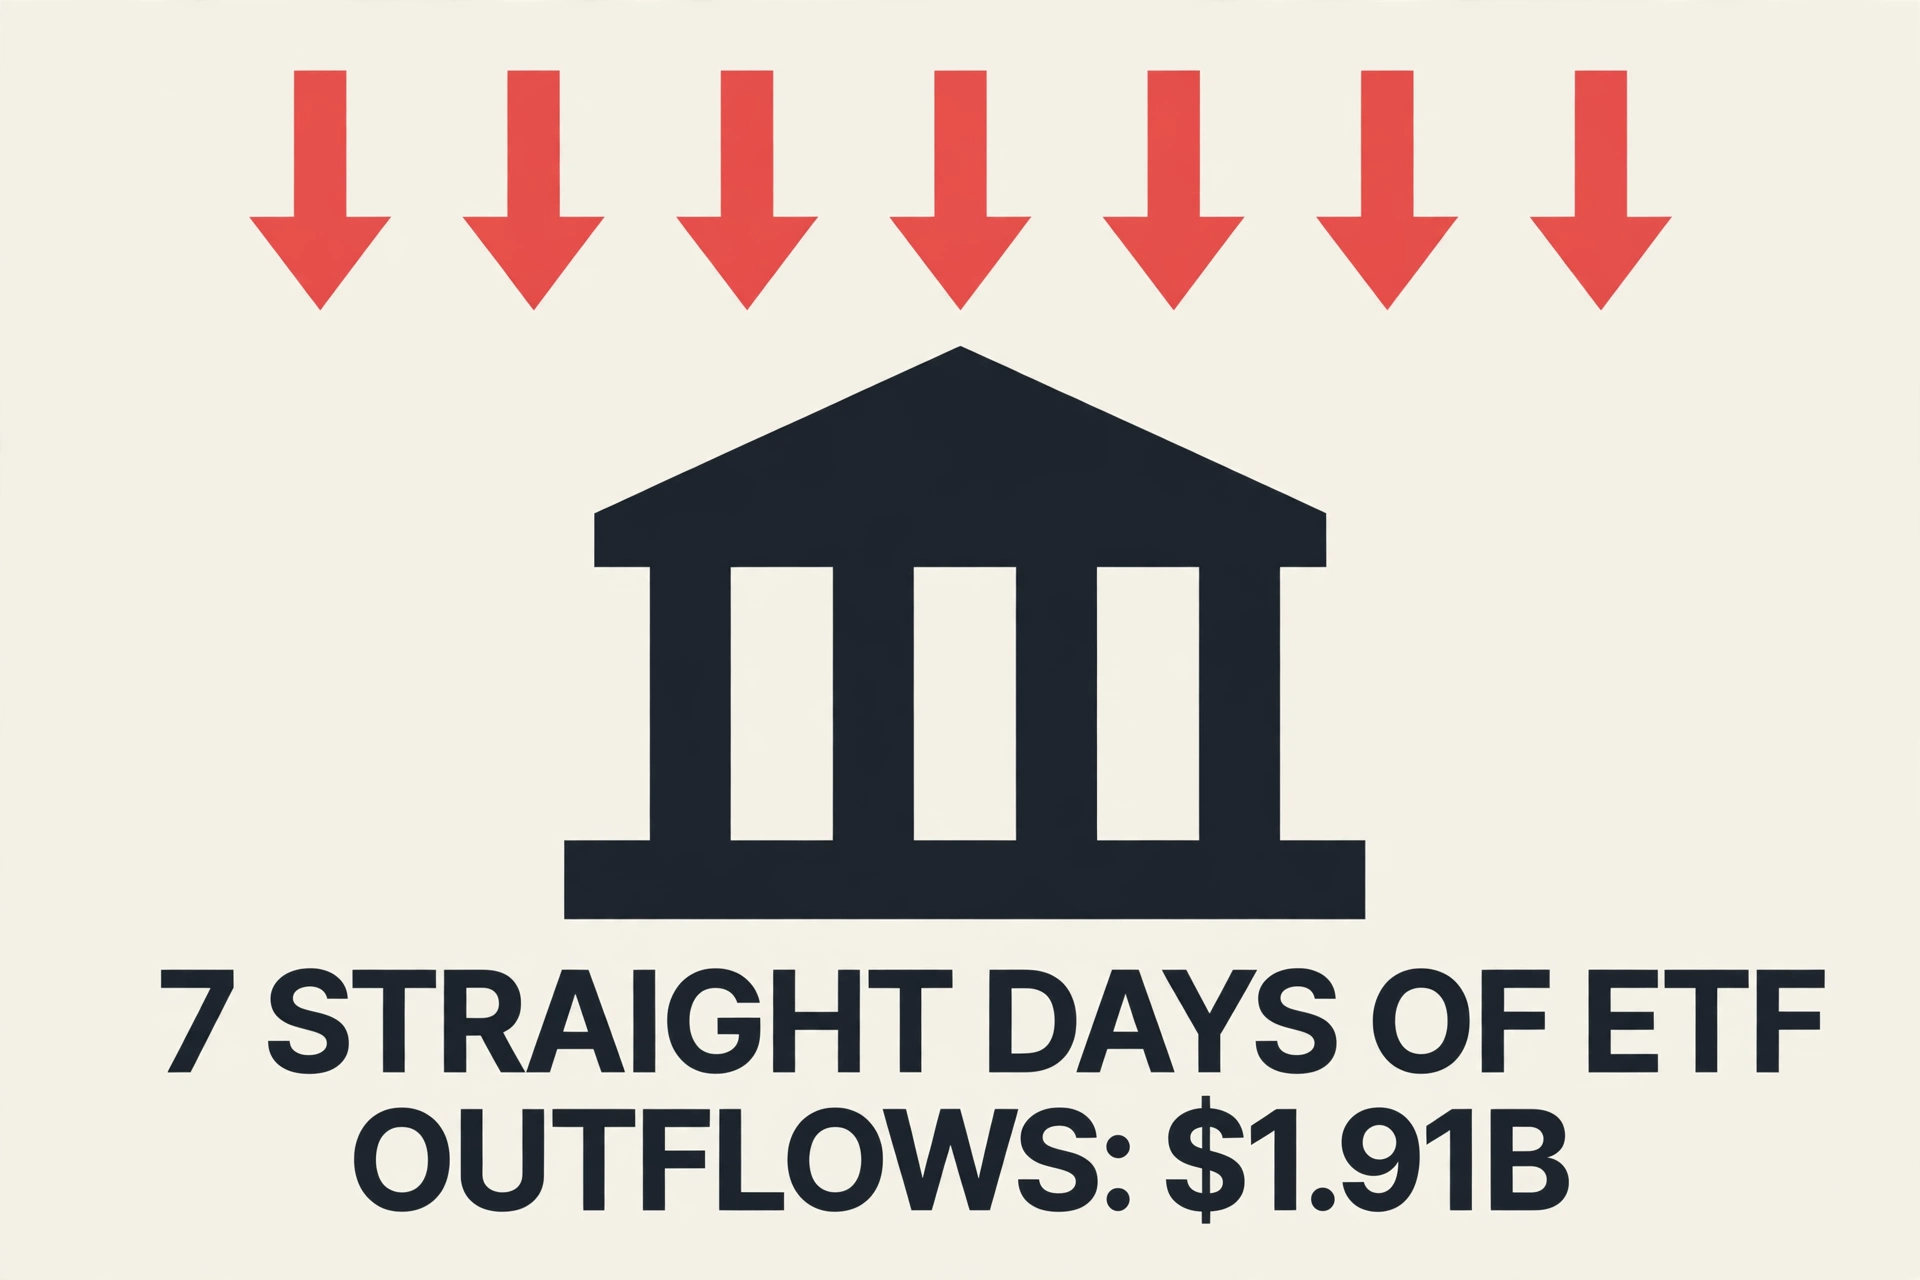
Seven consecutive sessions of net outflows from US spot Bitcoin ETFs drained institutional market depth.
The line that marked every bear-market bottom
Here is the number that makes this week different from the five red weeks before it.
Bitcoin’s 200-week moving average sits at roughly $68,013. For a decade, that line has marked the floor of every bear market. In 2015, in 2018, in 2022, price touched it, held it, and turned. It has never closed a week below it and stayed there for long — and the one time it did, in the depths of 2022, the market spent months clawing back.
Bitcoin is now trading about $2,557 below that line. It first bounced off it on Friday, recovering toward $69,200. Then on Saturday it fell straight through. The question is no longer whether the line can be tested. It is whether Monday’s close confirms the break.
If the weekly candle closes below roughly $68,000 on Monday morning, it is the first confirmed weekly close under the 200-week average in this cycle — and the framing of the whole market changes. The supports below are $62,006, the week’s low; then $60,000, a round number that has never been tested as support in this cycle; then $57,742, the year’s low from July 1. If the candle closes back above the line, the break was a false one, and the week is still the sixth straight red week — painful, but not a regime change.
Either way, the week is already the sixth consecutive weekly decline, and at roughly 12% down so far it is the steepest weekly drop since the slide began in early November. The last weekly close, $74,737.9, now sits about $9,300 above the current price. From the all-time high near $126,080, bitcoin has now lost 48.1% — within a whisker of the technical definition of a bear market, which is a 50% drawdown. From the November 4 high of $81,131, the drop is 19.3%.
The ETF bleed is slow, and that is the point
If the liquidations were the loud part of the week, the ETF flows were the quiet part — and arguably the more important one.
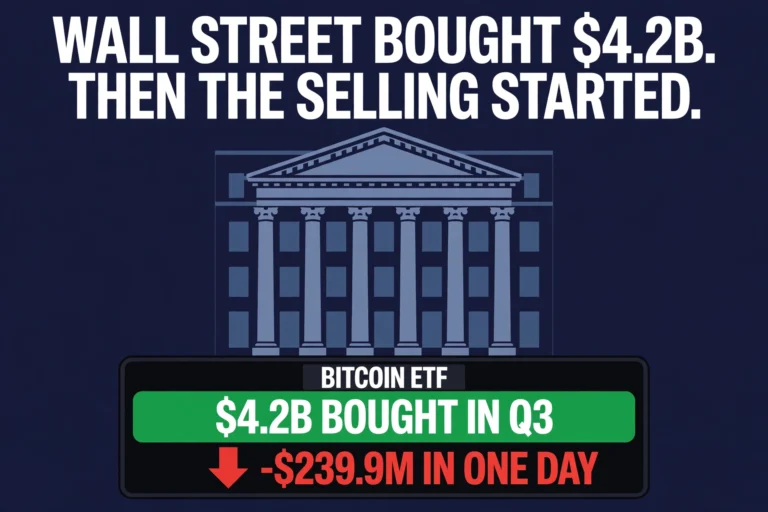
US spot bitcoin ETFs have now recorded seven consecutive sessions of net outflows, totalling $1.91 billion between November 5 and 13. BlackRock’s IBIT alone lost $1.42 billion over those seven sessions, and has now seen outflows for eleven straight sessions, losing roughly $2.35 billion since October 30. The latest week alone took $1.07 billion out of spot bitcoin funds. Friday’s session, the smallest of the week in percentage terms, still took $185.4 million.
Two things deserve emphasis here. First, a number that circulated widely this weekend — that ETFs lost $1.43 billion in a single day — is wrong. No single day in the current run came within a billion dollars of that figure. The worst day of the run, Thursday November 5, took $430 million. The $1.43 billion figure is roughly the size of a week of IBIT outflows, compressed by careless repetition into a day. We verified this against Farside and SoSoValue data before publishing, and the full correction is in our afternoon report on the flows.
Second, the slow bleed matters more than a one-day panic would. A single day of $1.4 billion in outflows would be a capitulation event — sharp, scary, and often close to a bottom. Seven straight sessions of steady selling is something else: institutional holders reducing exposure, day after day, because their view of the next three months has changed. That is harder to reverse, and it is why the ETF flows, not the liquidations, are the number to watch on Monday, when the funds trade again.
Ethereum funds tell a similar story, with one crack of light. Spot ether ETFs lost $398.9 million for the week, but Friday saw a small net inflow of $2.3 million — the first buying session after six straight days of selling. It is a small number, and one day does not make a turn, but in a week of almost uniformly red flow data, it is the only green print worth noting.
For perspective: cumulative net inflows into US spot bitcoin ETFs since launch still stand at roughly $54.7 billion. The current outflow run has not erased the year’s accumulation. It has, however, erased about a third of it in two weeks — $2.35 billion over the last two weeks alone, the first time two consecutive weeks have each exceeded $1 billion since late May and early June.
Extreme Fear index readings matched levels not observed since the mid-2024 capitulation corridor.
The Fed problem
Underneath all of this sits a problem that has nothing to do with crypto.
October’s inflation data came in hot. Headline CPI rose 0.4% month-on-month against a 0.3% consensus; core CPI rose 0.3% for the third consecutive month. Producer prices rose 0.3% on the month and 6.5% year-on-year, the highest since November 2022. Within hours of the CPI print, Fed Governor Christopher Waller said a 50-basis-point hike “should be considered” at the December meeting if core inflation matched the prior months — which it did.
The market heard him. CME FedWatch now prices a December rate hike as effectively certain: an 88.5% probability of a 25-basis-point increase and 11.5% for a 50-basis-point move, with no probability assigned to holding rates or cutting. Prediction market Kalshi puts a hike at 97%. The Fed’s December meeting is on December 8–9, and November CPI — due December 10, after the meeting — cannot save the market from whatever the Fed decides.
This is the inversion of the story that carried crypto for most of the year. For months, the market’s working assumption was that the Fed’s next move was a cut, and that cheaper money would eventually arrive. That assumption is gone. The Fed’s next move is now priced as a hike, and the only open question is the size. Bitcoin, an asset with no yield and no cash flow, is the worst place to be when the price of money is going up instead of down.
The contrast with equities is striking. The S&P 500 gained about 2.5% in the week to Friday, even after falling 0.40% on Friday itself. The 10-year Treasury yield closed the week at 5.15%, up 27 basis points. Stocks and bonds are telling a story about an economy that is still growing and inflation that is still sticky. Crypto is telling a story about leverage being removed. Both can be true at once. The divergence is the point: this is not a general risk-off panic. It is a crypto-specific unwind, inside a macro environment that has turned hostile to it.
Ethereum and Solana: no hiding place
Ethereum fell below $2,000 this week and stayed there, trading at $1,832 on Sunday evening — down 4.1% in 24 hours and roughly 9% from its November 13 open near $2,018. Its low for the week was around $1,711, the weakest since July. The $2,000 level, which held as support through most of the autumn, is now resistance.
Solana traded at $72.53, down 4.5% in 24 hours. Breakpoint, Solana’s flagship conference, opened in London this weekend — an unfortunate backdrop for a token that spent the week being sold alongside everything else.
The breadth of the decline matters. When bitcoin falls alone, it can be a bitcoin story. When ether, Solana, and the rest of the market fall together, and when the selling is driven by forced liquidations rather than by any single piece of news, it is a leverage story. Leverage stories end when the leverage is gone, not when the news improves.
The AI week ahead
Two events outside crypto will shape the week, and both belong to the AI trade that has dominated equity markets all year.
Nvidia reports third-quarter earnings on Tuesday, November 17 — its first earnings since the resignation of Jensen Huang. The board accepted Huang’s resignation as president, chief executive, and board member, effective November 11, according to a Form 8-K filed on November 12. Chief financial officer Colette Kress is interim chief executive, and Harvey C. Jones is board chair. The company gave no reason for the resignation, and reporting about the circumstances remains unproven — we are not repeating it as fact. What matters for markets is simpler: Nvidia is the most important stock in the world right now, it reports on Tuesday, and it does so with a new interim chief executive at the helm.
Anthropic, the maker of the Claude AI models, prices its initial public offering on Wednesday, November 18, with trading expected to begin on the Nasdaq on Thursday under the ticker ANT. The deal is 825 million shares at $70 to $78 each, which would raise up to $64.4 billion and value the company at up to roughly $1.4 trillion on a fully diluted basis. Orders are reported at about six times the shares available, and seven strategic partners — including Google and Nvidia at $10 billion each — have agreed to buy $26 billion of stock at the IPO price in a concurrent private placement. In a week when risk assets are being sold, the biggest IPO of the year is a test of whether appetite for AI exposure has actually broken, or merely paused.
The week ahead
Monday: China activity data at 09:00 VN; the weekly candle closes at 07:00 VN. Fed speakers: John Williams at 21:05 VN, and Kevin Warsh at 00:00 VN on Tuesday. Spot ETF flows resume — the first read on whether the outflow streak extends to an eighth session.
Tuesday: US retail sales at 20:30 VN — the most important data point before the December Fed meeting, since November CPI arrives after it. Nvidia earnings after the US close.
Wednesday: Anthropic IPO pricing. Nvidia’s earnings call lands around 04:20 VN on Wednesday morning.
Thursday: FOMC minutes at 02:00 VN — though the minutes predate the hot CPI print, so live Fedspeak matters more. Philadelphia Fed survey and jobless claims later in the day.
Friday: Consumer sentiment data, and Fed Governor Waller speaks — the man whose 50-basis-point comment helped set this week’s tone.
The bottom line
This was the week the market stopped arguing about whether bitcoin was in a correction and started pricing something worse. A 12% weekly decline, a break of the 200-week moving average, $2 billion in forced selling, seven straight sessions of ETF outflows, and a Federal Reserve that is now expected to raise rates — each of those alone would be a bad week. Together, they are a regime change in sentiment.
What has not changed is the structure of the market. There is no single catastrophic event behind this fall — no exchange failure, no regulatory shock, no fraud. The selling is leverage being removed and institutions reducing exposure, inside a macro environment that turned against risk. Those are the kinds of declines that end when the selling exhausts itself, not when a headline reverses.
Monday morning will tell us the first part of the story: whether the weekly candle closes below the 200-week line, or whether the line holds one more time. The rest of the week — retail sales, Nvidia, the Anthropic pricing, the Fed minutes — will tell us whether the market is ready to buy the dip, or whether the dip is still looking for its buyers.
Watch the ETF flows on Monday. If the outflow streak extends to eight sessions, the institutions have not finished selling. If it breaks, the first green print in two weeks will be the most important number of the day.
Disclaimer: This article is for informational purposes only and does not constitute financial advice. Figures are cited from official releases and market data as reported at the time of writing and are subject to revision. Cryptocurrency markets are volatile; always do your own research before making investment decisions.
Access institutional-grade macro telemetry, ETF flow tracking, and cross-exchange liquidation analytics in real time at CoinXSight Terminal.
CX
CoinXSight Alpha Desk
ALPHA // DESK
Quantitative Research Desk·Global Alpha Division
CoinXSight Institutional Research Desk produces quantitative crypto market intelligence, algorithmic models, and on-chain forensics.
QUANTITATIVE SUITE // DEEP ALPHA ENGINEACTIVE
BTC/USDT // LIVE SCANNER
CONFLUENCE 74
LIVE SPOT PRICE$82,807.47WEAK_BUY
TP2
$89,522.75
+9.07%
TP1
$85,056.42
+3.63%
ENTRY
$82,078.86
ZONE
SL
$80,590.09
-1.81%
Auto-detect Order Blocks, Fair Value Gaps and risk-adjusted DCA ladders in < 5s.