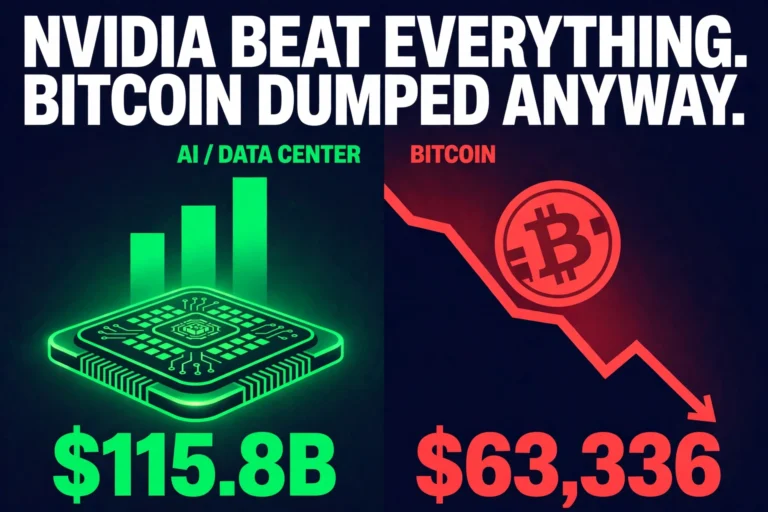
Bitcoin Stood Still While Stocks Lost $1.4 Trillion — Decoupling, or Just a Week Early?
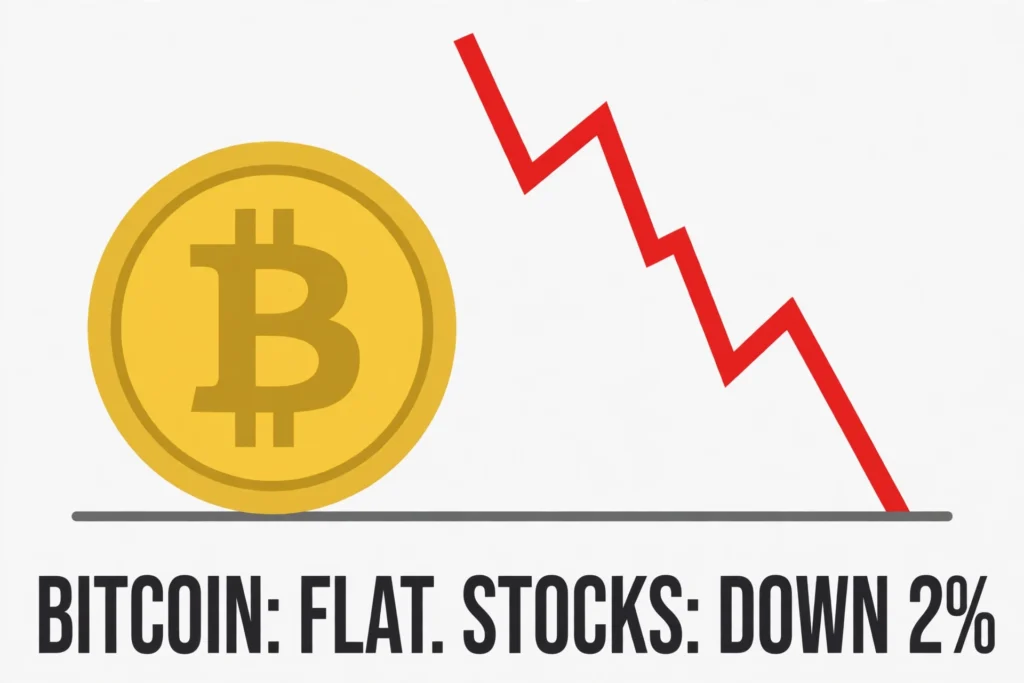
Bitcoin hovered near $65,000 while the S&P 500 lost 1.92% and the Nasdaq fell 2.49% into a correction. The divergence is real — but crypto fell first, and stocks are only now catching down.
CX
CoinXSight Alpha DeskQuantitative Research Desk·Nov 17, 2026 · Updated Nov 18
On Monday, the American stock market lost well over a trillion dollars in a single session. The Nasdaq fell 2.49% and slid into a correction, more than 10% below its October high. The S&P 500 dropped 1.92%. Nvidia, the most important stock in the market, lost 4.12% the day before its earnings report. The VIX jumped nearly 20%.
Bitcoin, in the middle of all that, did almost nothing.
It spent the American session hovering near $65,000 — rising to $65,500 shortly after the US open, flat over the previous 24 hours when Wall Street closed, according to CoinDesk’s live coverage. Ether sat near $1,815. The crypto market, six days removed from a $2 billion liquidation flush and a weekly close below its 200-week moving average, watched the stock market fall apart and refused to join in.
The obvious reading is decoupling: the asset that spent November collapsing has finally stopped following stocks down. The more honest reading is timing. Bitcoin did not decouple from the selloff. It front-ran it by a week.
Monday flipped the script. The S&P 500 lost 1.92% to 7,416.59. The Nasdaq lost 2.49% to 24,509.76. The Dow fell 1.41% to 51,608.17. The Philadelphia Semiconductor Index dropped 5.28%. And bitcoin, which had already done its falling, closed the day at $64,174 — down 1.80% from Sunday’s close, and trading near $64,540 on Tuesday morning.
That is not two markets moving apart. It is the same risk-off trade arriving in two instalments. Crypto, which trades around the clock and has no circuit breakers and no closing bell, took the hit first. Stocks, which had spent the same week climbing on AI earnings optimism, caught up on Monday when the AI story itself cracked.
The question for the rest of the week is not whether bitcoin has decoupled. It is whether stocks have further to fall to meet crypto where it already is — or whether crypto, having fallen first, has already priced in what stocks are only now discovering.
Equity drawdown magnitude across major US indices and tech giants compared to Bitcoin spot stability. Source: CoinXSight Telemetry.
Monday in numbers
Measure
Reading
Source / time
Bitcoin, Tue 17 Nov ~07:30 VN
$64,543 (−0.65% / 24h)
CoinGecko
Bitcoin, Mon 16 Nov close
$64,173.68 (open $65,351.05, low $63,905.01)
Finnhub, Binance BTC/USDT
Weekly close, week of 9 Nov
$65,510.09, −12.35% vs prior close
Finnhub weekly candle
200-week moving average
~$67,982 — weekly close ~$2,470 below
Finnhub
Bitcoin 14-day RSI
22.6 — deeply oversold
TradingView, via CoinDCX
S&P 500, Mon 16 Nov
7,416.59, −1.92%
CNBC / Reuters close
Nasdaq Composite, Mon 16 Nov
24,509.76, −2.49% (correction)
CNBC / Reuters close
Market value lost, S&P 500
~$1.06 trillion in one session
BeInCrypto
Market value lost, global
~$2.2 trillion (incl. gold, Asia)
BeInCrypto
US dollar index (DXY)
103.47 — highest since Apr 2025
Reuters, 16 Nov
Spot BTC ETF flows, Mon 16 Nov
−$180.85M — 8th straight outflow session
Lookonchain
Fear & Greed Index
12 — Extreme Fear
alternative.me, 17 Nov
What actually broke on Monday
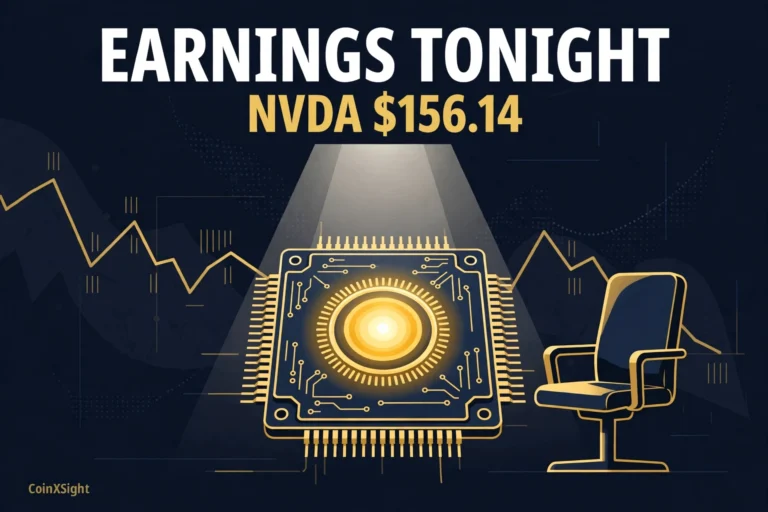
The proximate cause was the AI trade itself. Nvidia fell 4.12% to $156.14, its lowest close since July 1, on the day its board was reported not to be discussing the return of Jensen Huang — who resigned as CEO a week earlier. The chip index fell 5.28%. Micron dropped 7.62%. Alphabet and Amazon each fell about 3%. Intel fell more than 6% after a class action alleged it misled investors.
But the selling was not only about one company. Five forces converged, according to the day’s reporting: the Nvidia leadership turmoil, Federal Reserve Chair Kevin Warsh’s warning about AI risks, tighter chip-export restrictions, pre-earnings caution, and higher yields — plus outages at major US banks (Bank of America, Wells Fargo, Chase) that left customers locked out of their accounts on the same day.
The breadth is what made Monday different from Friday. On Friday, the damage was concentrated in the names that had run furthest. On Monday it spread: the Dow fell 739 points, the Russell 2000 lost about 1.7%, and even gold — the year’s great haven — gave back $420 billion in market value. When gold, stocks, and Asian equities all fall together, the market is not rotating. It is de-risking.
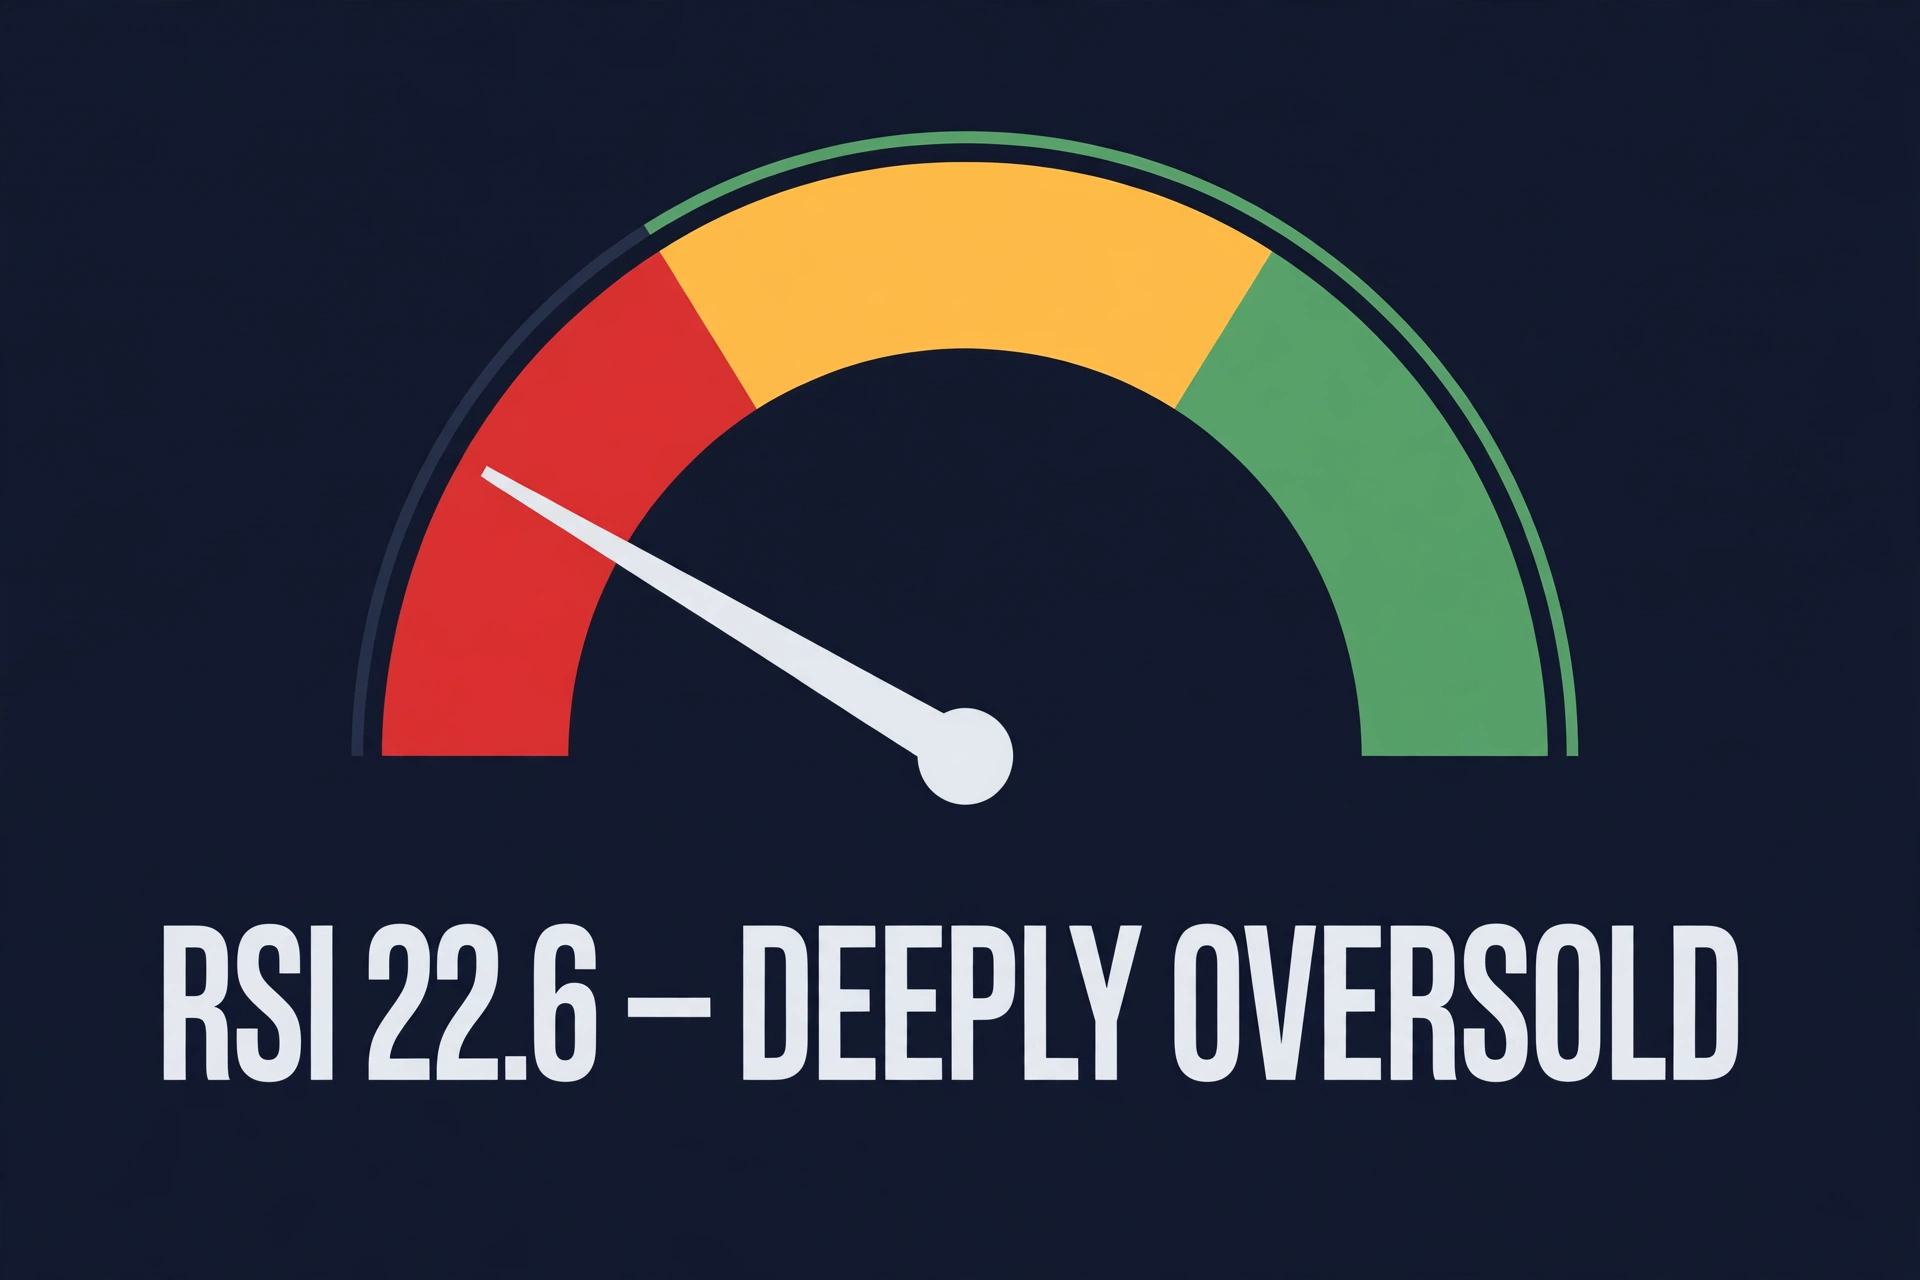
And yet bitcoin did not de-risk further. That is the part worth sitting with. After a week in which it lost 12.35% and printed its lowest level since July, bitcoin spent Monday in a $1,487 range — $63,905 to $65,392 — and finished the American session essentially where it started it. The 14-day RSI at 22.6 says the selling is exhausted, at least for now. Liquidations, which ran at roughly $2 billion a day over the weekend, had collapsed to about $272 million over the rolling 24 hours by Monday afternoon — and were split almost evenly between longs and shorts, which is what a market looks like when the forced selling is over, not when it is gathering.
None of that means bitcoin has bottomed. An oversold reading is a condition, not a signal, and $62,006 — the weekend low — remains the level that matters. Below it sits $60,000, then the year’s low at $57,742. But Monday showed something real: after a week of leading the market down, bitcoin stopped leading. For one session, at least, it watched.
Bitcoin on-chain cost basis distribution and institutional liquidity cushions around $65,000. Source: CoinXSight Quantitative Research.
What the Fed chair actually said
The day’s most important speech came not from a CEO but from the Federal Reserve chair — and it is worth reading carefully, because the market spent Monday reacting to it in two opposite directions.
Kevin Warsh, speaking at the Fed’s Productivity and Jobs Task Force conference in San Francisco, laid out three scenarios for what he calls “super intelligence” — the artificial intelligence boom that has driven both the stock market’s gains and, now, its anxiety. In the best case, he said, the technology could “supercharge idea generation” and deliver “an increase in productivity and economic gains that are shared broadly across labor and the owners of capital,” with real GDP growth “persistently above its long-run average” and the US “close to full employment.”
In the worst case, he said, “after significant capital investment and stock market gains, expected returns could turn down and equity valuations could fall, leading to an economic slowdown and a more notable rise in unemployment.” The middle path keeps the growth but displaces enough jobs to push unemployment up anyway.
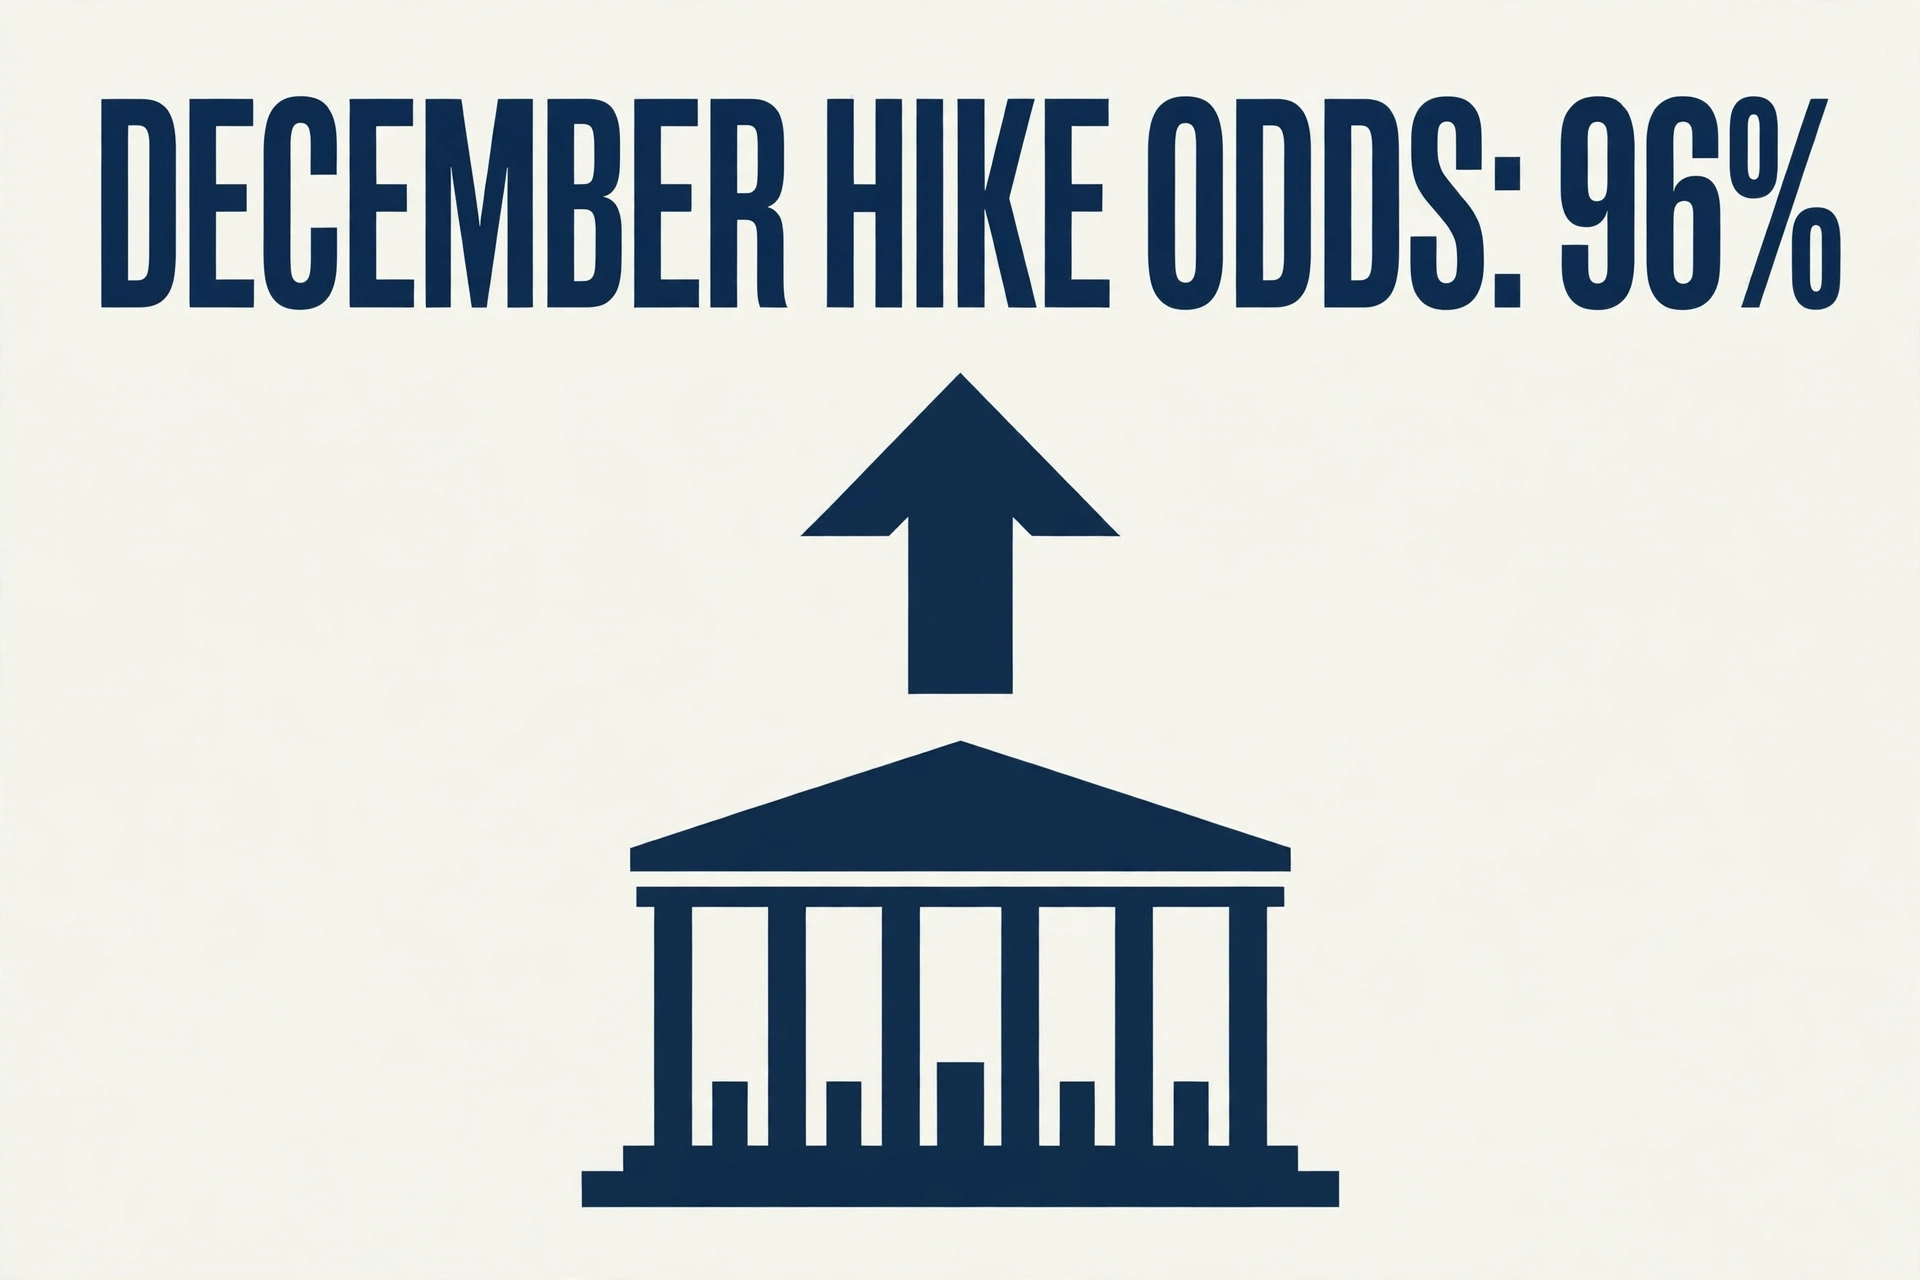
Warsh stressed that these are illustrative scenarios, not forecasts. He gave no guidance on interest rates and did not mention inflation at all. That silence matters: the Fed’s next decision is December 8–9, and markets now price a hike at 96% — 87.5% for 25 basis points and 8.5% for 50, according to Kalshi’s per-meeting contract, with CME FedWatch putting 25 basis points at 95.7% against 4.3% for 50. The question is no longer whether the Fed hikes. It is whether the economy Warsh described — one where AI either lifts everything or breaks something — can absorb another hike at all.
New York Fed President John Williams, speaking earlier in the day at the Fed’s FX conference, gave brief opening remarks with no policy guidance quoted in coverage. His latest on-record line remains from November 13: “inflation is far too high and it continues to be high even in the latest data,” with the Fed needing to “take actions over time that will ensure that we get inflation back to our 2% goal in a timely manner and on a sustained basis” — while “making sure that we don’t do undue harm to our maximum employment mandate.” That tension, between an inflation problem that has not gone away and a labour market the Fed does not want to break, is the whole December debate in two sentences.
Governor Michael Barr, speaking the same day, added a number that should worry anyone watching the AI trade: more than $3 trillion in potential off-balance-sheet AI financing obligations. It is the kind of figure that makes a 5.28% drop in the chip index look less like a buying opportunity and more like a repricing.
The flows tell two stories at once
If Monday was a test of whether anyone still wants bitcoin exposure, the answer came back split — and the split is the most interesting part of the day.
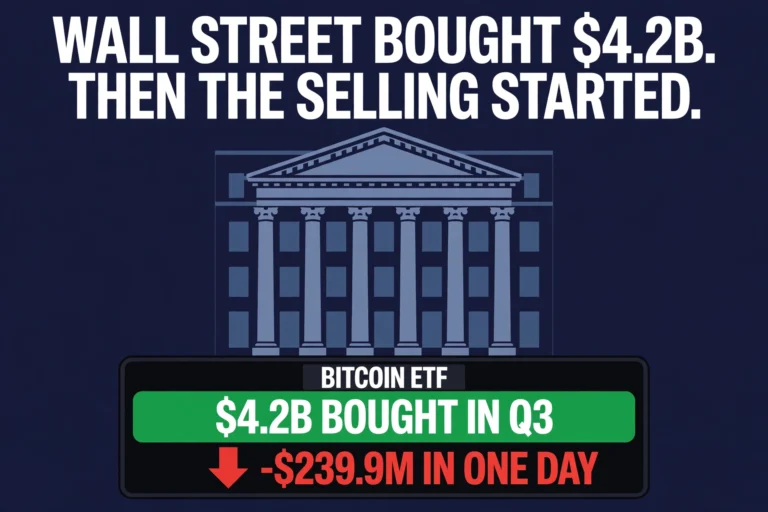
US spot bitcoin ETFs lost another $180.85 million on Monday, the eighth straight session of outflows. The run now stretches back to November 5, and the funds have shed about $2.1 billion in November alone. Ether ETFs, by contrast, took in a small 1,237 ETH on the day.
But the quarterly 13F filings, which landed the same day, tell the opposite story about the same asset. Harvard Management Company held its IBIT share count steady in the third quarter while the position’s value rose 42.2% to $144.1 million — the gain came from price, not from buying more shares, but the point stands: the endowment did not sell. Wells Fargo, Bank of America and Morgan Stanley all increased their IBIT holdings in the quarter, according to the filings.
And the corporate treasuries kept buying the dip, in their own diminished way. Strategy bought 485 bitcoin for $33.4 million between November 9 and 15, at an average of $68,887 per coin, lifting its stack to 850,849 BTC — though it spent $228.1 million repurchasing its own preferred shares in the same period, roughly seven times what it spent on bitcoin. Strive added 251 BTC for $17.5 million. The buying is real. It is also, at these prices, much smaller than the selling: Strategy’s stack now sits roughly $9.7 billion underwater on paper against its $75,452 average cost.
Read together, the two stories say the same thing: daily flows are driven by traders and momentum funds leaving; quarterly holdings are driven by institutions that bought the thesis and are sitting on it. The daily flow is the weather. The 13F is the climate. Monday’s weather was bad. The climate has not changed yet.
Canada’s inflation print, out Monday morning, added a small counterweight to the hawkish mood. Consumer prices rose 3.1% year over year in October, unchanged from September and a touch below the 3.2% economists expected. Strip out energy and the rate was 2.0%. It is one country’s data point, and a modest one — but on a day when every inflation print has been read as a reason to hike, a softer-than-expected one was the closest thing to good news the bond market got.
What decides the rest of the week
Monday’s divergence — stocks down, crypto flat — will resolve one way or the other, and the calendar gives it three chances to do so quickly.
Tonight, at 20:30 VN, US retail sales for October land, with forecasts split between +0.2% (Bloomberg) and flat (JPMorgan, Morgan Stanley, Deutsche Bank). A strong number feeds the hawkish case; a weak one feeds the recession case. Either way it moves the December hike odds, and with them, risk assets.
After the US close tonight, Nvidia reports earnings — the most important single print of the season, from a company with no permanent CEO, a board reported not to be discussing its founder’s return, and a stock down 4.12% on Monday alone. Consensus is about $109 billion in revenue and $2.47 in earnings per share. The options market cannot agree on how big the move will be, which is itself a kind of answer.
And on Wednesday at 02:00 VN, the Fed publishes minutes from its October 27–28 meeting. They predate the hot CPI print, so they will not settle the December debate — but they will show how the committee was thinking before inflation re-accelerated, and whether anyone inside the building was already worried about the AI buildout Warsh described on Monday.
For bitcoin, the levels are unchanged and unforgiving. Above: $65,000, then the 200-week moving average near $68,000 — the line it closed below last week for the first time since October 2023. Below: $62,006, then $60,000, then the year’s low at $57,742. Monday proved that bitcoin can stand still while stocks fall. It did not prove that it can stand still if stocks fall again. The decoupling question will be answered the next time the Nasdaq drops 2.5% — and on the evidence of the last two weeks, the next time is never far away.
Disclaimer: This article is for informational purposes only and does not constitute investment advice. Market data and figures are cited as of the time of publication and subject to revision. Cryptocurrency trading involves substantial risk; conduct independent research before committing capital.
CX
CoinXSight Alpha Desk
ALPHA // DESK
Quantitative Research Desk·Global Alpha Division
CoinXSight Institutional Research Desk produces quantitative crypto market intelligence, algorithmic models, and on-chain forensics.
QUANTITATIVE SUITE // DEEP ALPHA ENGINEACTIVE
BTC/USDT // LIVE SCANNER
CONFLUENCE 74
LIVE SPOT PRICE$82,807.47WEAK_BUY
TP2
$89,522.75
+9.07%
TP1
$85,056.42
+3.63%
ENTRY
$82,078.86
ZONE
SL
$80,590.09
-1.81%
Auto-detect Order Blocks, Fair Value Gaps and risk-adjusted DCA ladders in < 5s.