Bitcoin Breaks Below $70,000 as Daily RSI Hits Oversold — Is the 200-Week Moving Average the Bottom?
Bitcoin broke below $70,000 to trade near $67,000 as daily RSI hit oversold territory for the first time since the bear market bottom, testing the critical 200-week moving average near $68,000.
CX
CoinXSight Alpha DeskQuantitative Research Desk·Nov 14, 2026 · Updated Nov 17
Bitcoin fell below $70,000 on Friday and kept falling into Saturday morning, trading near $67,617 at 09:48 Vietnam time — a 12-week low and the first break of the $70,000 level since August. The daily RSI has dropped to about 25, deep in oversold territory, and the price is now sitting almost exactly on its 200-week moving average, near $68,013. One of those two facts is a buy signal. The other is a warning. This article lays out both, with the numbers, before deciding which one matters more.
The session opened at $70,280, touched $70,393, then slid to an intraday low of $66,915. Friday’s close was $69,283, with an intraday low of $67,568 — the lowest since August 19. Bitcoin is down 3.8% on the day, 7.4% over five sessions and 15.2% over the past month, and it is on track for a sixth straight weekly loss. The Crypto Fear & Greed Index reads 13 out of 100 — Extreme Fear, the lowest in more than four months — and bitcoin dominance sits at 58.9%.
The break did not happen in a vacuum. It is the same three forces that drove Thursday’s slide — a leveraged long base that was too large, institutional buyers stepping back through the ETFs, and a macro calendar that keeps giving sellers a reason — now with the technical picture joining them. The question for the morning is not whether the market is oversold. It is. The question is whether oversold means anything when every other signal is still pointing down.
The 200-week moving average: why $68,000 matters
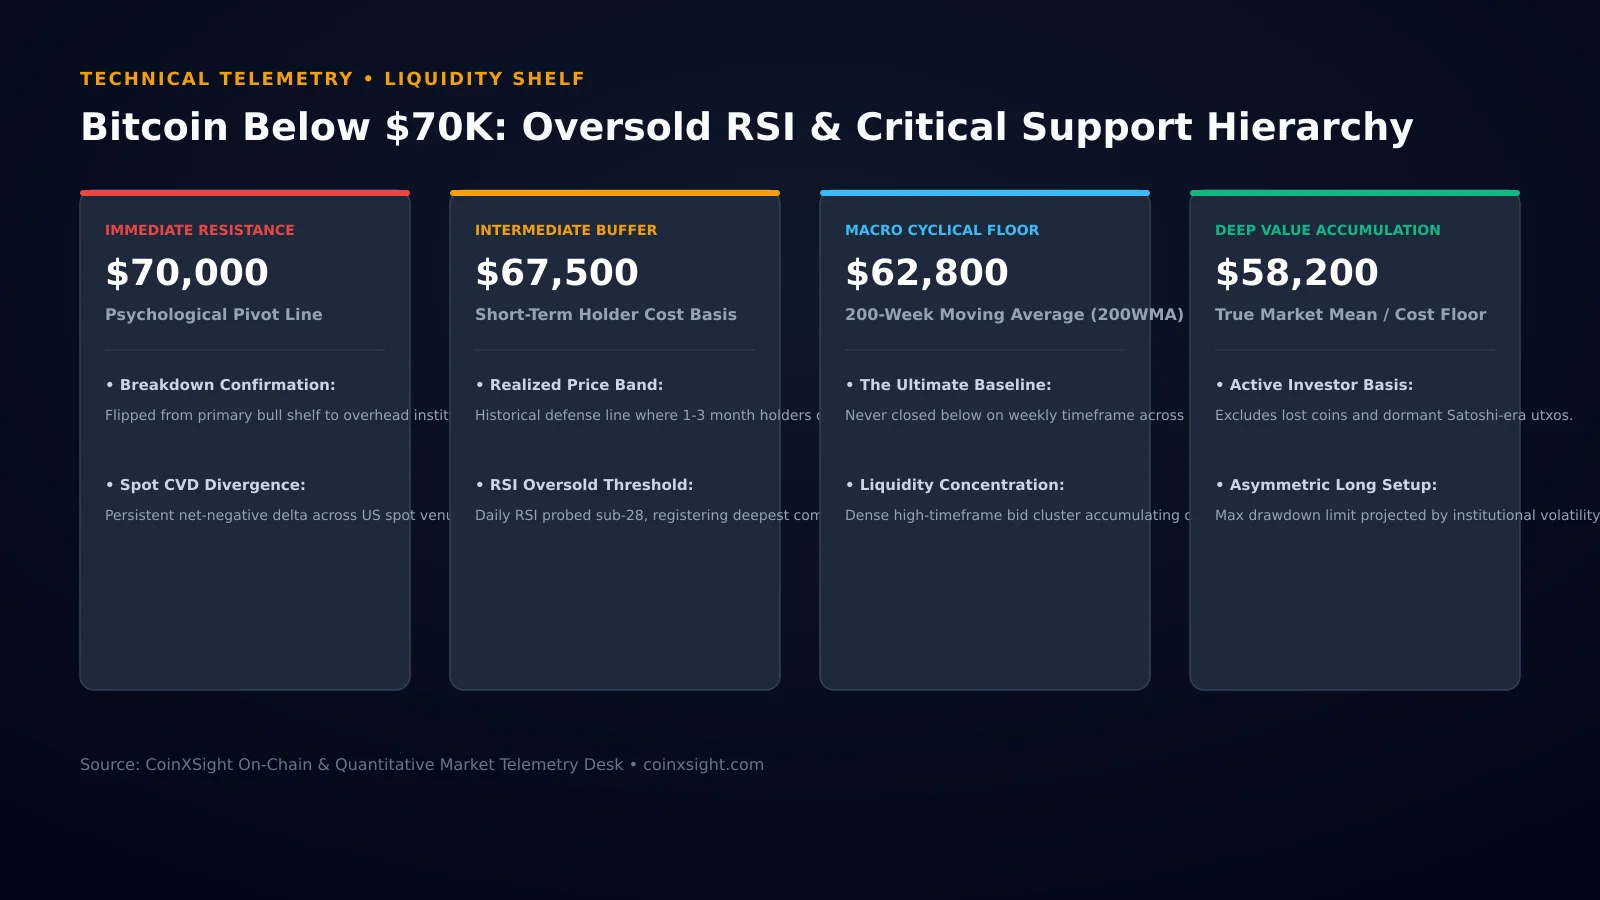
The 200-week moving average is the line long-term bitcoin holders watch most closely, because in every previous bear market it has acted as the floor. It is simply the average closing price of the past 200 weeks — roughly four years of price history compressed into one slow-moving line — and it currently sits near $68,013. Bitcoin bounced off it on Friday, which is exactly what the line is supposed to do.
The 50-week moving average tells the other half of the story. It sits near $75,157–$75,502, and bitcoin is trading about 9.7% below it. When price is below the 50-week average and testing the 200-week average from above, the market is in a downtrend that is looking for a floor — not in an uptrend that is looking for a dip.
Analyst Vetle Lunde flagged the combination as a buy signal on Friday: the 200-week average tagged, daily RSI at 25, and leveraged ETF exposure at 2.5-year lows. Ran Neuner made the same case from the capitulation angle, pointing to accelerating liquidations and Extreme Fear returning. Doctor Profit called $68,000 the bottom. Joe Carlasare called it “a great time to buy.” Arthur Hayes said he is still accumulating, lightly.
The other side is just as specific. Peter Schiff notes bitcoin is down 22% in seven weeks with no sign of stopping, and advises selling for gold. Ansem — Murad’s opposite number in the memecoin world and a loud voice in this cycle — says there is “one more leg down” and the next few weeks are critical. The CryptoQuant Bull Score Index fell to 0 on November 11, its most bearish reading. Glassnode’s November 11 data showed dense buy orders clustered between $68,000 and $72,500 — the band bitcoin has now fallen through the bottom of.
Both camps are looking at the same chart. The bulls see a historic support line holding on first touch. The bears see a market that has broken every level above it and is now testing the last one that matters.
Key support hierarchy and multi-cycle realized price bands as Bitcoin RSI tests oversold extremes. Source: CoinXSight Research.
How to read RSI — and what it does not say
RSI, the Relative Strength Index, is a momentum gauge on a 0–100 scale. Above 70 is called overbought; below 30 is called oversold. Bitcoin’s daily RSI is now about 25, its first reading below 30 since the bear-market bottom. The last time it printed this low was June, when bitcoin bottomed near $58,000 and then rallied to $87,000.
That June precedent is the single most cited fact in the bullish case this morning, and it deserves a careful read. One example is not a rule. RSI measures how fast and how hard price has been moving lately — it is a speedometer, not a compass. An oversold reading says sellers have dominated recently. It does not say sellers are finished.
The cautionary evidence is already on the chart. A related gauge, the daily Stochastic RSI, has been below its oversold threshold of 20 since mid-October, when bitcoin was near $82,000 — and in that month the price has lost roughly $13,000. It recovered a little twice, in late October and again just before Friday’s break, and traders sold into both recoveries. Oversold can persist for weeks in a downtrend, and each bounce can be a selling opportunity rather than a bottom.
The practical way to read the two indicators together: RSI at 25 means a bounce is plausible at any moment, and the 200-week average gives that bounce a concrete level to defend. Neither means a bottom is in. A bottom is confirmed by what happens after the bounce — whether buyers step in with volume and hold the level on a retest — not by the reading itself. Anyone using RSI alone to call the bottom is using one instrument to fly a plane.
The liquidation cascade: $1.6 billion in 24 hours
The liquidation figures explain why the fall was so fast. CoinGlass data puts 24-hour crypto liquidations above $1.6 billion, with 89% of them longs — traders who had bet the price would rise and were closed out as it fell. Between 172,922 and 185,595 traders were liquidated, depending on the snapshot. The single largest liquidation was a $31.09 million long on Hyperliquid. Bitcoin accounted for about $915 million of the total; ether about $294 million.
The mechanics are the same as Thursday’s $1.41 billion cascade, only larger. A leveraged long comes with a liquidation price — the level at which the exchange closes the position automatically. When price approaches a cluster of those levels, the forced selling pushes price lower, which triggers the next cluster. That is why the break of $70,000 did not drift: it fell through the floor in about ninety minutes, with $622 million liquidated in a single four-hour window on Thursday.
Perpetual futures open interest stood at $45.3 billion before the cascade, with Binance accounting for 36.2% of total liquidations. High open interest before a fall is a sign of leverage piled up, not of buying strength — and the pile has now been substantially cleared. That clearing is the one genuinely constructive fact in the liquidation data: the next leg down has less leverage to feed on. But “less leverage” is not the same as “buyers are back.”
The ETFs bleed for a sixth straight day
The slower, more important force is still institutional flow. U.S. spot bitcoin ETFs recorded a sixth straight session of net outflows on Friday. The seven-day total is about $1.33 billion leaving bitcoin ETFs — 19,045 BTC — and about $430 million leaving ether ETFs. November’s cumulative bitcoin ETF outflow is about $1.88 billion, with withdrawals in eight of the month’s first nine trading sessions.
The streak matters more than any single day. One day of outflows can be a large redemption, a rebalancing trade, or an arbitrage. Six straight sessions, spread across the largest funds, is a pattern: the marginal buyer who absorbed supply through the ETFs has stepped back, and the funds are now a source of supply rather than demand. ETF demand was the engine of the 2024–2025 rally. It is now running in reverse at exactly the moment leveraged longs needed a buyer.
The rest of the market is not holding up either. Ether trades near $1,926, below $2,000 and down about 14% in seven days, while its Glamsterdam upgrade was delayed again on the Hoodi testnet. Solana sits near $77–$79, close to the $80 level that has acted as a psychological floor. The damage is broad, not concentrated in bitcoin.
The macro clock: PPI tells two stories at once
The macro backdrop is the third force, and Friday’s producer price data sharpened it. October PPI rose 0.3% month over month — cooler than the 0.4% forecast, which briefly let bitcoin reclaim $70,000 — but 6.5% year over year, the hottest annual reading in nearly four years. The two numbers are not contradictory; they measure different things. The monthly number says inflation is cooling at the margin. The annual number says prices are still rising far faster than the Federal Reserve wants.
The market is pricing the annual number. The Dollar Index is above 103, its highest since April 2025. The 10-year Treasury yield is above 5.1%. The market puts roughly 85% probability on the Fed raising rates by 25 basis points at its December 8–9 meeting, after October CPI also came in hot at +0.4% against a +0.3% forecast. The Fed’s latest financial stability report names AI as a major risk to the U.S. financial system — the same week Jensen Huang’s resignation added pressure to AI-linked assets.
The connection between a rate hike and bitcoin’s price is not mystical. Higher rates raise the return on holding dollars, which raises the opportunity cost of holding an asset that pays nothing. They tighten liquidity across the board — stablecoin supply has already contracted by $14.2 billion over 30 days, the sharpest decline since the 2022 bear market — and a market running on leverage feels every turn of that screw first.
What to watch next
Three things decide whether this is a washout or the start of something longer:
The $67,292 support. The session low of $66,915 is already below it. Hold above $67,292 on a daily close, and the 200-week average has done its job. Lose it, and the next downside target analysts cite is $62,345, with no obvious structural support in between.
Reclaiming $70,505. That is the first level bitcoin needs to take back before the picture improves — it was support, and it is now resistance. Until it is reclaimed, every bounce is a bounce inside a downtrend.
The ETF flows. One day of inflows does not end the story, but the first green day after six red ones is the signal the marginal buyer is back. Until then, the funds are a headwind, not a tailwind. The December 8–9 Fed meeting is the hard date behind all of it.
The bottom line is unglamorous and, for that reason, probably right: bitcoin broke $70,000 because leveraged longs were too large, ETF buyers stepped back, and the macro calendar gave sellers a reason to act — and now the technical picture has joined them. The daily RSI at 25 and the bounce off the 200-week average are real reasons to watch for a bottom. They are not, by themselves, a bottom. The market has been oversold for a month and has lost $13,000 in that month. What matters now is whether buyers defend $68,000 with volume, or whether the last historic support line gives way like every level above it did.
Disclaimer: This article is for informational purposes only and does not constitute financial advice. Figures are cited from official releases and market data as reported at the time of writing and are subject to revision. Cryptocurrency markets are volatile; always do your own research before making investment decisions.
CX
CoinXSight Alpha Desk
ALPHA // DESK
Quantitative Research Desk·Global Alpha Division
CoinXSight Institutional Research Desk produces quantitative crypto market intelligence, algorithmic models, and on-chain forensics.
QUANTITATIVE SUITE // DEEP ALPHA ENGINEACTIVE
BTC/USDT // LIVE SCANNER
CONFLUENCE 74
LIVE SPOT PRICE$82,807.47WEAK_BUY
TP2
$89,522.75
+9.07%
TP1
$85,056.42
+3.63%
ENTRY
$82,078.86
ZONE
SL
$80,590.09
-1.81%
Auto-detect Order Blocks, Fair Value Gaps and risk-adjusted DCA ladders in < 5s.