Bitcoin Just Closed a Week Below Its 200-Week Moving Average for the First Time Since 2023
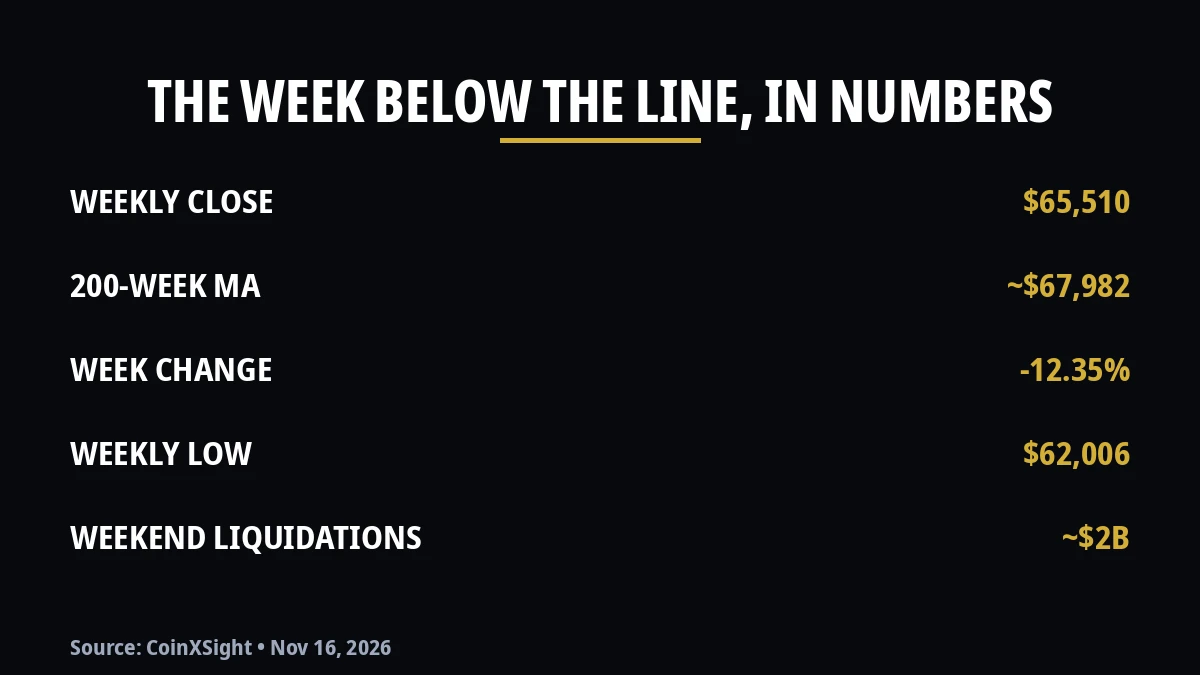
Bitcoin closed the week at $65,510, down 12.35% — the first weekly close below the 200-week moving average since October 2023, and the sixth straight red week. A $2 billion liquidation flush, seven straight ETF outflow sessions, and a Fed about to hike frame a market that finally broke its floor.
CX
CoinXSight Alpha DeskQuantitative Research Desk·Nov 16, 2026 · Updated Nov 18
For eleven years, the 200-week moving average has been the line bitcoin comes back to when everything else fails. It caught the bottom in 2015. It caught the bottom in 2018. It caught the bottom in 2022. Traders who have survived more than one cycle treat it less like an indicator and more like a floor — the last place where long-term buyers have always shown up.
This week, bitcoin closed below it. Not a wick through it. Not an intraday dip that recovered by dinner. A weekly close, printed at 07:00 VN on Monday, at $65,510 — roughly $2,470 under a line sitting near $67,982. The first weekly close below the 200-week average since October 2023. The sixth straight red week, down 12.35% in seven days.
That is the difference between this week and every scare of the past month. The market did not just test the line. It finished the week underneath it.
The week in numbers
Measure
Reading
Source / time
Weekly close, week of 9 Nov
$65,510.09
Finnhub, Binance BTC/USDT
Weekly change
−12.35% vs prior close $74,737.9
Finnhub
200-week moving average
~$67,982
Finnhub, 200 weekly closes
Distance below the line
~−$2,470 (−3.6%)
Calculated
Weekly low
$62,006 — lowest since 17 Aug
Finnhub
Weekend liquidations, rolling 24h
~$2.0–2.05B, ~93% long
CoinGlass, window to ~09:00 UTC 15 Nov
Spot BTC ETF outflows, 7 sessions
−$1.91B (IBIT −$1.42B)
Farside
Bitcoin, Mon 16 Nov ~07:53 VN
$64,850 (+1.94% / 24h)
CoinGecko
Fear & Greed Index
10 — Extreme Fear
alternative.me, 16 Nov
Bitcoin printed its first weekly close below the 200-week moving average since October 2023.
How a $75,000 week became a $62,000 week
The week opened at $74,851, already bruised. Bitcoin had spent the previous week sliding from above $81,000, and the $75,000 level that held through the first days of November was gone before the weekend arrived. Friday’s session closed at $68,314 — a 4.5% day that put the 200-week average, then sitting near $68,000, directly in the market’s path.
Saturday did the rest. Bitcoin fell through $68,000, then $65,000, then $64,000, in a single session that looked less like a market and more like a margin call with a price attached. In one hour alone, $691 million of leveraged positions were liquidated, $671 million of them longs — over 97% of that hour’s damage on one side of the book. By the time the dust settled, CoinGlass’s rolling 24-hour count stood near $2 billion, with roughly 329,000 traders liquidated and about 93% of the wiped positions long. Bitcoin alone accounted for $684–774 million of it, Ethereum another $466–488 million.
The low printed at $62,006 — the weakest price since August 17, and below the August low the market had spent three months defending.
Sunday brought the bounce, and it was real but shallow. Bitcoin reclaimed $65,000, traded as high as $66,132, and closed the day — and the week — at $65,509. The recovery hour after the low was worth 3.66%, the kind of violent snapback that happens when everyone is short at the same time. But a bounce is not a reclaim. The weekly candle closed below the 200-week average, and by Monday morning the price had slipped back under $65,000 again, trading around $64,850 at 07:53 VN. The line that was supposed to be support is now, for the first time in three years, overhead resistance.
The liquidation wave broke — and then it flipped
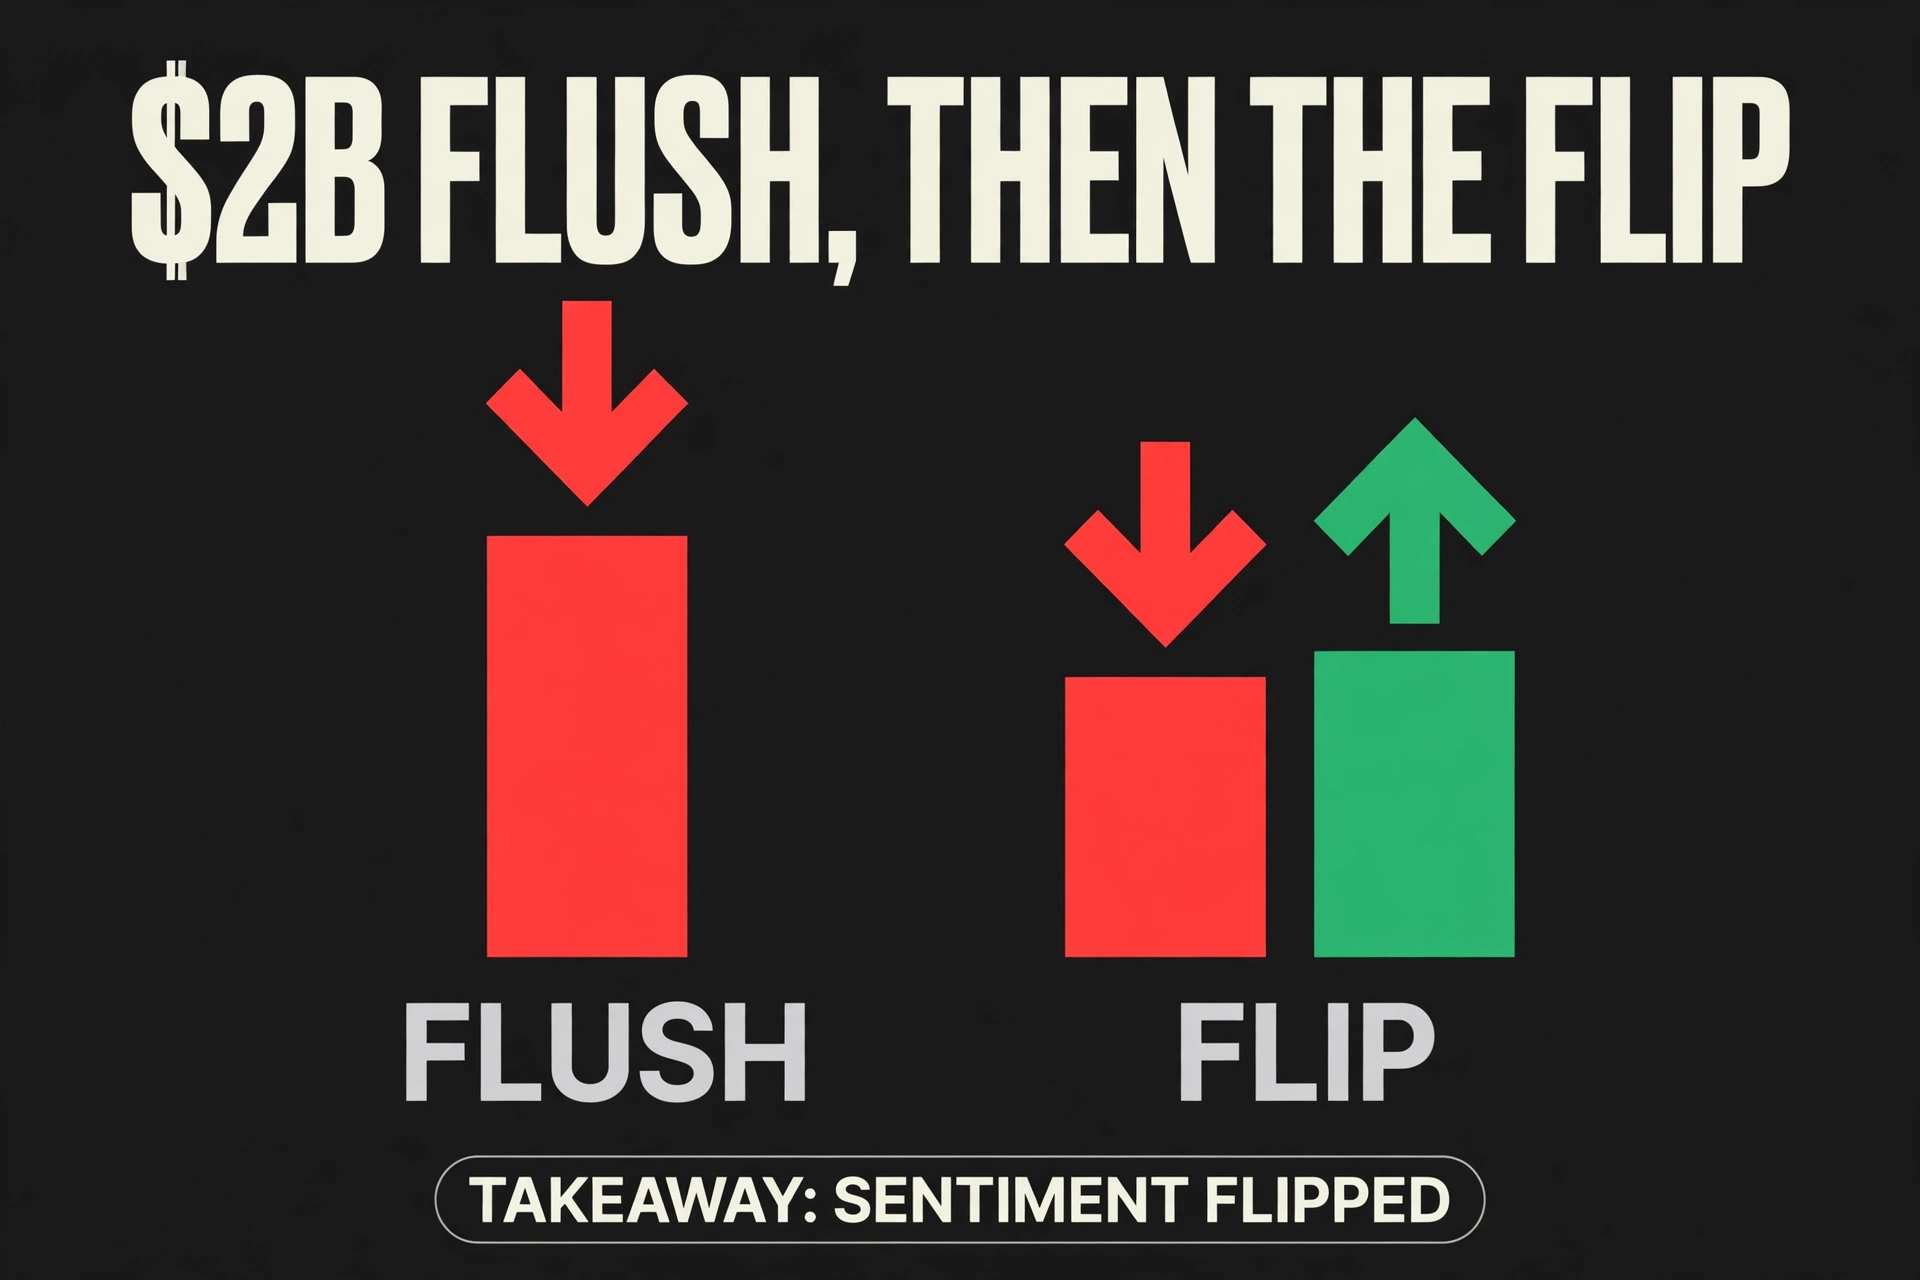
There is a second story inside the liquidation data, and it matters more than the headline total. The weekend’s roughly $2 billion flush was a long liquidation event: almost everything wiped out belonged to traders betting on higher prices. That is what a capitulation looks like.
Monday’s numbers look different. In the 24 hours to Monday morning, about $566.5 million in crypto positions were liquidated across roughly 94,000 traders, according to CoinGlass data reported by Aju Press — and bitcoin futures liquidations over the same window totalled $336 million, split almost evenly between longs (49%) and shorts. Open interest is down more than 6% in a day, and funding has gone flat.
Read plainly: the forced selling has slowed, and the forced buying has started. Shorts who piled in below $65,000 are now the ones getting squeezed as the price bounces. The market is no longer a one-way liquidation machine. It is a two-sided fight around $65,000, with neither side in control. That is healthier than the weekend, and it is also more dangerous — two-sided markets chop traders up in both directions.
One accounting note, because the numbers in circulation disagree with each other by design: different sources quote the weekend wave at $1.23 billion, $1.96 billion, or just over $2 billion. They are not contradicting each other. Each is a rolling 24-hour window read at a different minute of a fast weekend. The $1.65 billion figure belongs to Friday’s wave alone, and it stays separate.
Over billion in liquidations flushed through the crypto derivatives complex over the weekend, predominantly long positions.
The institutional bid went quiet first
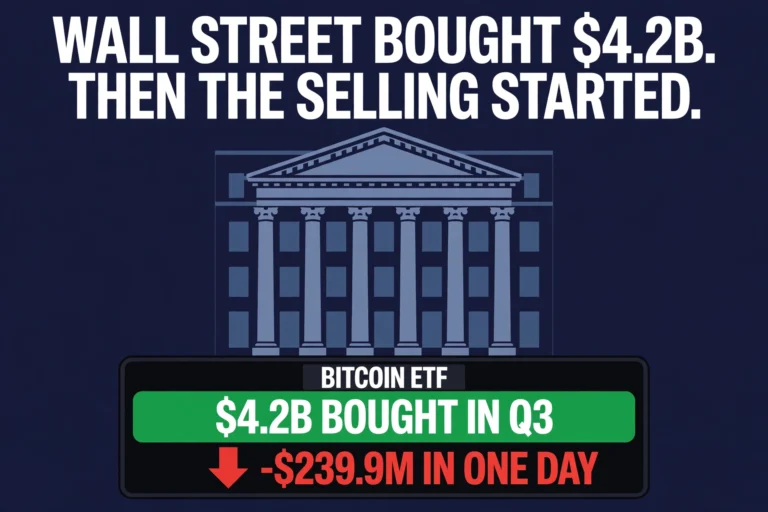
The spot bitcoin ETFs saw none of the weekend, because they do not trade on weekends. What they did before it is the more important signal. US spot bitcoin ETFs recorded net outflows in seven consecutive sessions from November 5 to November 13 — $1.91 billion in total, with BlackRock’s IBIT accounting for $1.42 billion of it and redeeming for eleven straight sessions. The week of November 9–13 alone took $1.07 billion out, including $185.4 million on Friday.
That is the institutional version of the same story the liquidation data tells: the bid that defined the last two years of bitcoin has not just paused, it has reversed. The contrast with the rest of institutional crypto is sharp — the same week, twenty-one of the world’s largest banks committed $270 million to their own stablecoin, with the OCC finalising the GENIUS rulebook. The industry is still being built. The ETF money just is not buying right now. The next flow print arrives after Monday’s US session, and it is the first real test of whether the weekend flush scared the remaining buyers out or finally brought bargain hunters in. Ethereum’s funds tell a smaller version of the same tale — $398.9 million out for the week, though Friday actually saw a small $2.3 million net inflow, the first buying session after six straight days of redemptions.
The Fed is about to hike — and the market has known it for a week
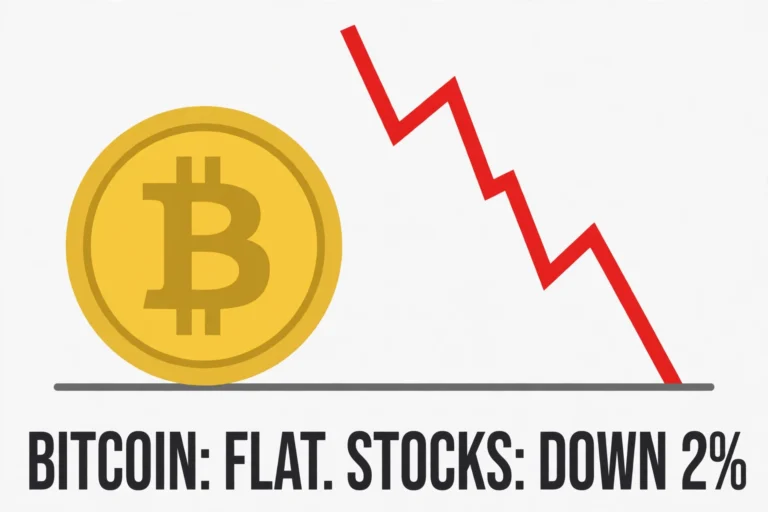
Hovering over all of this is the December Federal Reserve meeting, and the reason bitcoin has been falling while stocks have not. The S&P 500 finished last week up 2.51% even as bitcoin lost 12.35%. The decoupling that started in October is now a chasm, and the proximate cause is the repricing of US rates.
The market now prices a December hike as near-certain. CME FedWatch had a 25-basis-point increase at 88.5% and a 50-point move at 11.5% on Saturday, with no chance of a cut or a hold. The split between stocks and crypto is not new — last week stocks rallied while bitcoin gave back $74,000 — but the gap has widened into a different regime. Prediction markets on Sunday told the same story: roughly 88% for 25bp, 8.5–9% for 50bp. The 50-point option stays on the table because of one number — core CPI printed +0.3% month-on-month in October, the third straight month at that level, and Governor Waller has said a core print at or above 0.3% means the committee “should consider” a 50-point move.
Two Federal Reserve speakers land tonight, after this article’s deadline: John Williams at 21:05 VN and Kevin Warsh around midnight. Their words will shape Tuesday, not today. What already shapes today is the Fed’s own Financial Stability Report, published Friday, which ranked a “correction in risk assets” as the second-most-cited risk among market contacts. The weekend delivered exactly that correction.
The irony is worth naming. Bitcoin was supposed to be the asset that thrives when trust in fiat wobbles. Right now it is trading like a leveraged bet on easy money — and easy money is precisely what the Fed is taking away.
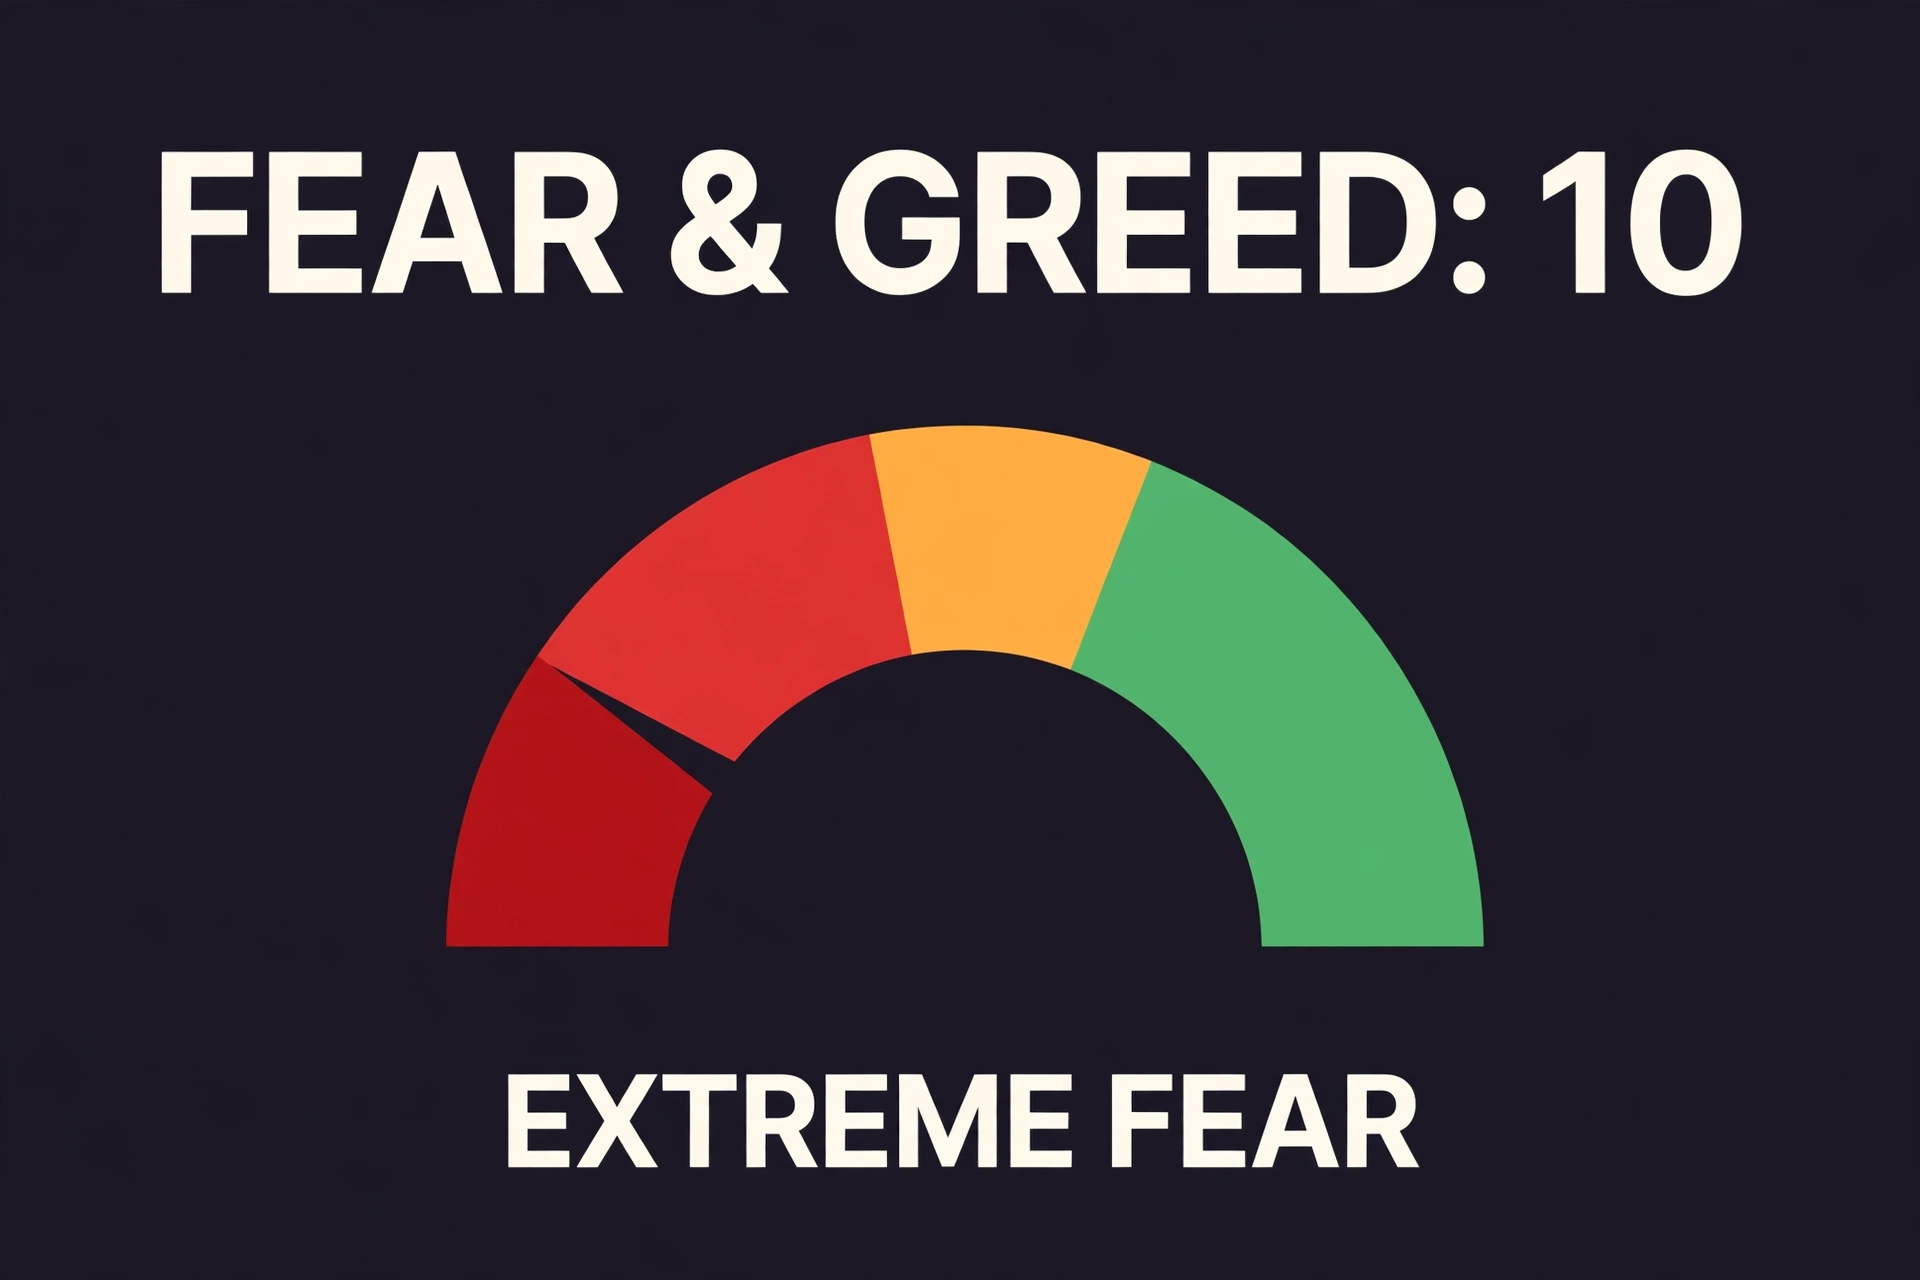
The Crypto Fear and Greed Index collapsed to 10 (‘Extreme Fear’) following six consecutive red weekly closes.
What actually matters now
First, the levels. The weekly low at $62,006 is the line in the sand; it sits just above the August low the market defended for months, and below it the next round numbers are $60,000 and $57,742, the year’s low from July 1. Above, the 200-week average near $68,000 is the first resistance, and $70,000 — the level that broke on Friday — is the second. A weekly close back above the average would turn this break into a false one. Until that happens, every bounce is a bounce inside a broken structure.
Second, the flows. Monday’s ETF print, due after the US close, answers the only question that matters for the medium term: did the weekend flush bring buyers back, or did it confirm the exit? Seven straight outflow sessions is a trend, not a blip, and trends in ETF flows have a habit of lasting longer than anyone expects.
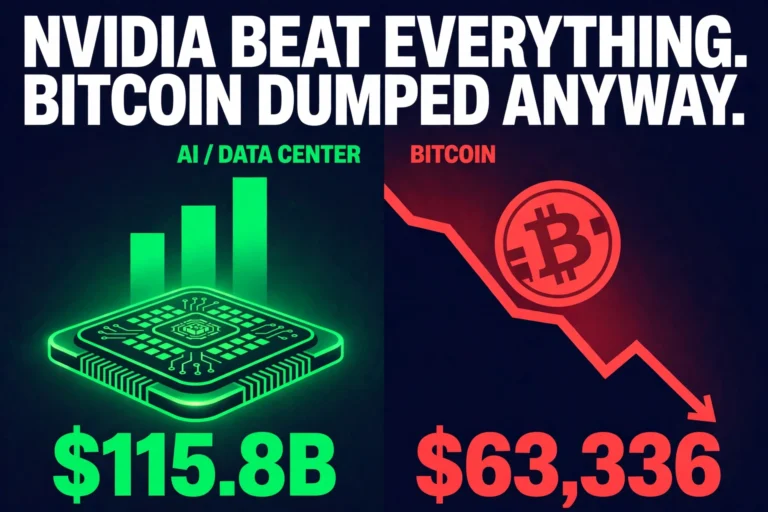
Third, the calendar. China’s October activity data lands at 09:00 VN today, before this article’s deadline passes. Retail sales hit Tuesday at 20:30 VN, the same night Nvidia reports earnings — the first since Jensen Huang’s resignation, confirmed by an SEC filing last week. The FOMC minutes arrive at 02:00 VN on Thursday, though they predate the hot CPI print, so live Fedspeak matters more than the minutes themselves.
None of this calls a bottom. Fear & Greed reads 10 — Extreme Fear, unchanged from yesterday, the kind of reading that has marked both capitulation lows and the middle of much worse. The honest statement is narrower: bitcoin has now done something it had not done in three years. It closed a week below the line that marked every bear-market bottom of the past decade. The market gets to decide, over the next two weeks, whether that was the break that defines the bear market — or the trap that ends it.
Disclaimer: This article is for informational purposes only and does not constitute financial advice. Figures are cited from official releases and market data as reported at the time of writing and are subject to revision. Cryptocurrency markets are volatile; always do your own research before making investment decisions.
Track institutional capital flows, live 200WMA deviation analytics, and liquidation telemetry in real time via the CoinXSight Terminal.
CX
CoinXSight Alpha Desk
ALPHA // DESK
Quantitative Research Desk·Global Alpha Division
CoinXSight Institutional Research Desk produces quantitative crypto market intelligence, algorithmic models, and on-chain forensics.
QUANTITATIVE SUITE // DEEP ALPHA ENGINEACTIVE
BTC/USDT // LIVE SCANNER
CONFLUENCE 74
LIVE SPOT PRICE$82,807.47WEAK_BUY
TP2
$89,522.75
+9.07%
TP1
$85,056.42
+3.63%
ENTRY
$82,078.86
ZONE
SL
$80,590.09
-1.81%
Auto-detect Order Blocks, Fair Value Gaps and risk-adjusted DCA ladders in < 5s.