Managing a crypto portfolio manually is like trying to conduct an orchestra while blindfolded. The crypto market operates 24/7 across hundreds of liquid assets, with regime changes that can flip correlations overnight and wipe out months of gains in a single weekend. Traditional portfolio theory was built for markets that close at 4 PM and reopen the next morning. Crypto doesn't play by those rules.
AI portfolio optimization applies machine learning and quantitative models to the specific challenges of crypto asset allocation: extreme volatility, nonlinear correlations, liquidity fragmentation, and narrative-driven sector rotation. Instead of relying on gut feeling or static allocation rules, AI systems continuously analyze price data, on-chain metrics, and cross-asset relationships to construct and maintain portfolios that maximize risk-adjusted returns.
This guide breaks down how AI transforms each stage of portfolio management, from initial allocation and correlation analysis through rebalancing triggers and performance measurement. Whether you're running a $5,000 personal portfolio or managing six figures, the principles are the same: let data drive your allocation decisions, and let AI handle the computational heavy lifting that human intuition simply cannot match.
Before diving into AI-driven solutions, it's important to understand exactly why manual portfolio management breaks down in crypto markets. The failure modes are structural, not psychological.
The 24/7 Problem
Traditional markets operate roughly 6.5 hours per day, five days per week. That gives portfolio managers time to analyze, plan, and execute. Crypto markets never close. A portfolio that was perfectly balanced at midnight can be 15% out of alignment by breakfast because of an Asian session sell-off or a European regulatory announcement.
Manual rebalancing in a 24/7 market means either checking obsessively (unsustainable) or accepting significant drift between check-ins (suboptimal). AI systems monitor continuously without fatigue, executing rebalancing logic at any hour.
The Correlation Trap
Most crypto traders believe they're diversified because they hold BTC, ETH, SOL, AVAX, and a handful of DeFi tokens. In reality, during market stress, almost every crypto asset converges toward a correlation of 1.0 with BTC. Your "diversified" portfolio of ten tokens behaves like a single leveraged BTC position precisely when diversification matters most.
AI models track rolling correlations across multiple timeframes and detect when correlation regimes shift, allowing for dynamic adjustments before a crash reveals your hidden concentration risk.
Regime Changes and Narrative Shifts
Crypto markets cycle through distinct regimes: BTC-dominant accumulation, alt season rotations, meme-driven speculation, and risk-off capitulation. Each regime requires fundamentally different portfolio construction. A portfolio optimized for alt season will underperform dramatically during BTC dominance expansion, and vice versa.
Manual traders typically recognize regime changes after they've already lost money. AI models can detect statistical signatures of regime transitions, such as changes in volatility clustering, cross-asset correlation shifts, and volume distribution anomalies, before they become obvious on price charts.
Modern Portfolio Theory Adapted for Crypto
Harry Markowitz's Modern Portfolio Theory (MPT) won a Nobel Prize for a simple but powerful idea: portfolio risk depends not just on individual asset volatility, but on the correlations between assets. By combining assets with low or negative correlations, you can achieve better returns per unit of risk.
The theory works beautifully for stocks and bonds. Applying it to crypto requires significant adaptation.
The Efficient Frontier with Crypto Assets
The efficient frontier maps all possible portfolio combinations and identifies those that offer the highest expected return for each level of risk. In traditional finance, this produces a smooth curve. In crypto, the frontier is jagged and unstable because:
Return distributions are non-normal. Crypto returns have fat tails and significant skewness. A portfolio model assuming normal distributions will dramatically underestimate tail risk.
Correlations are time-varying. BTC and ETH might have a correlation of 0.65 during calm markets but 0.95 during a crash. Static correlation inputs produce misleading frontier curves.
Asset lifespans are short. Many tokens in a crypto efficient frontier analysis didn't exist two years ago and may not exist in two years. Historical data is limited and may not represent future behavior.
AI addresses these limitations by using dynamic correlation matrices, regime-conditional return distributions, and robust optimization methods that account for parameter uncertainty.
What AI Changes About MPT
Traditional MPT
AI-Enhanced MPT
Static correlation matrix
Rolling 30/60/90-day dynamic correlations
Normal return distribution
Fat-tailed distributions (Student-t, GJR-GARCH)
Single optimization period
Regime-aware multi-period optimization
Mean-variance objective
Conditional Value-at-Risk (CVaR) objective
Quarterly rebalancing
Event-driven + threshold rebalancing
Historical returns as input
Forward-looking factor model returns
AI Allocation Strategies Compared
Understanding AI Allocation Strategies Compared is a key part of crypto technical analysis. Most professional trading indicators on any crypto trading platform will help you apply these concepts in real time.
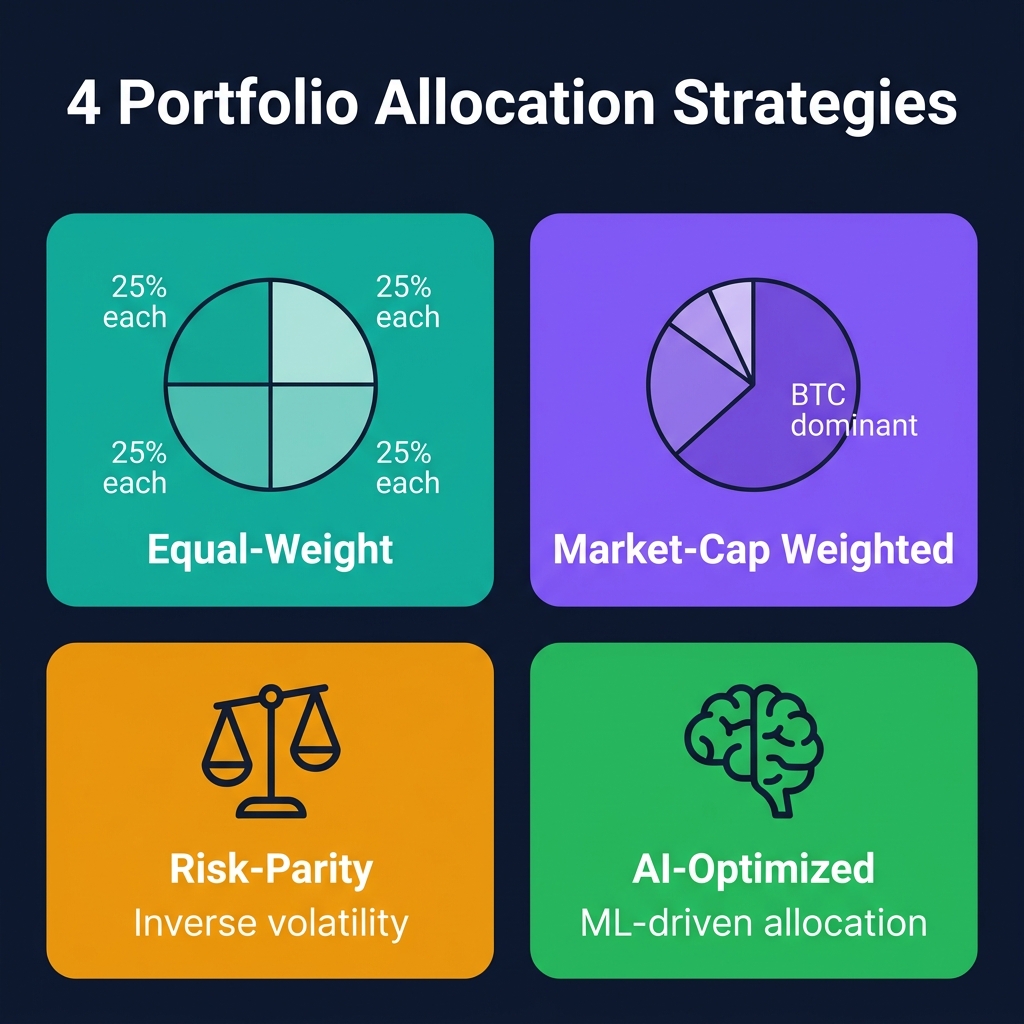
There are four primary approaches to portfolio allocation. Understanding their mechanics and trade-offs is essential before deciding which model fits your risk profile and market outlook.
1. Equal-Weight Allocation
The simplest approach: divide capital equally among selected assets. A five-asset portfolio gives each token 20%.
Strengths: No forecasting required, naturally contrarian (sells winners, buys losers at rebalance), easy to implement.
Weaknesses: Treats a $2 trillion asset (BTC) the same as a $5 billion altcoin. Overweights high-volatility assets relative to their risk contribution. Ignores correlations entirely.
Example (May 2026):
Asset
Allocation
Price
30-Day Vol
BTC
20%
$108,200
3.2%
ETH
20%
$2,720
4.8%
SOL
20%
$176
6.1%
AVAX
20%
$25.40
7.3%
RENDER
20%
$5.85
9.6%
The problem is immediately visible: RENDER contributes 3x the portfolio volatility of BTC despite having the same dollar allocation. One violent RENDER move dominates the entire portfolio's P&L.
2. Market-Cap Weighted Allocation
Weight each asset proportional to its market capitalization. This mirrors how traditional index funds (S&P 500) work.
Strengths: Reflects market consensus, high liquidity in largest allocations, low turnover.
Weaknesses: Extreme BTC concentration (typically 55-65%), minimal altcoin exposure limits alpha, momentum-chasing by design (winners get larger allocations automatically).
Example allocation: BTC 62%, ETH 18%, SOL 8%, AVAX 2%, RENDER 1%, Stables 9%.
3. Risk-Parity Allocation
Allocate so each asset contributes equally to total portfolio risk. High-volatility assets get smaller allocations; low-volatility assets get larger ones.
Strengths: Balanced risk contributions, reduces impact of any single asset's drawdown, mathematically rigorous.
Weaknesses: Requires accurate volatility estimates (backward-looking), ignores expected returns, can result in very high BTC/stablecoin weights and minimal alt exposure.
Example (using the same assets):
Asset
30-Day Vol
Inverse Vol Weight
Risk-Parity Allocation
BTC
3.2%
31.25
35.8%
ETH
4.8%
20.83
23.9%
SOL
6.1%
16.39
18.8%
AVAX
7.3%
13.70
15.7%
RENDER
9.6%
10.42
5.8%
4. AI-Optimized Allocation
Combines return forecasts, dynamic correlations, regime detection, and risk constraints into a single optimization framework. The AI model ingests multiple data sources, including price, volume, on-chain activity, social sentiment, and sector flows, to determine allocations that maximize a risk-adjusted objective function.
Weaknesses: Model risk (the AI could be wrong), requires quality data inputs, black-box concerns for some implementations.
Example output (AI model, May 2026 bull regime detected):
Asset
AI Allocation
Rationale
BTC
30%
Anchor position, reduced from risk-parity due to lower alpha signal
ETH
22%
Strong on-chain metrics, upcoming catalyst
SOL
20%
Highest momentum score in L1 sector
AVAX
8%
Moderate signal, lower conviction
RENDER
12%
AI sector rotation detected, high relative strength
Stables
8%
Dry powder for regime-change protection
Correlation Matrix Analysis
Understanding asset correlations is foundational to AI portfolio optimization. Without it, any allocation strategy is flying blind on diversification.
Reading a Crypto Correlation Matrix
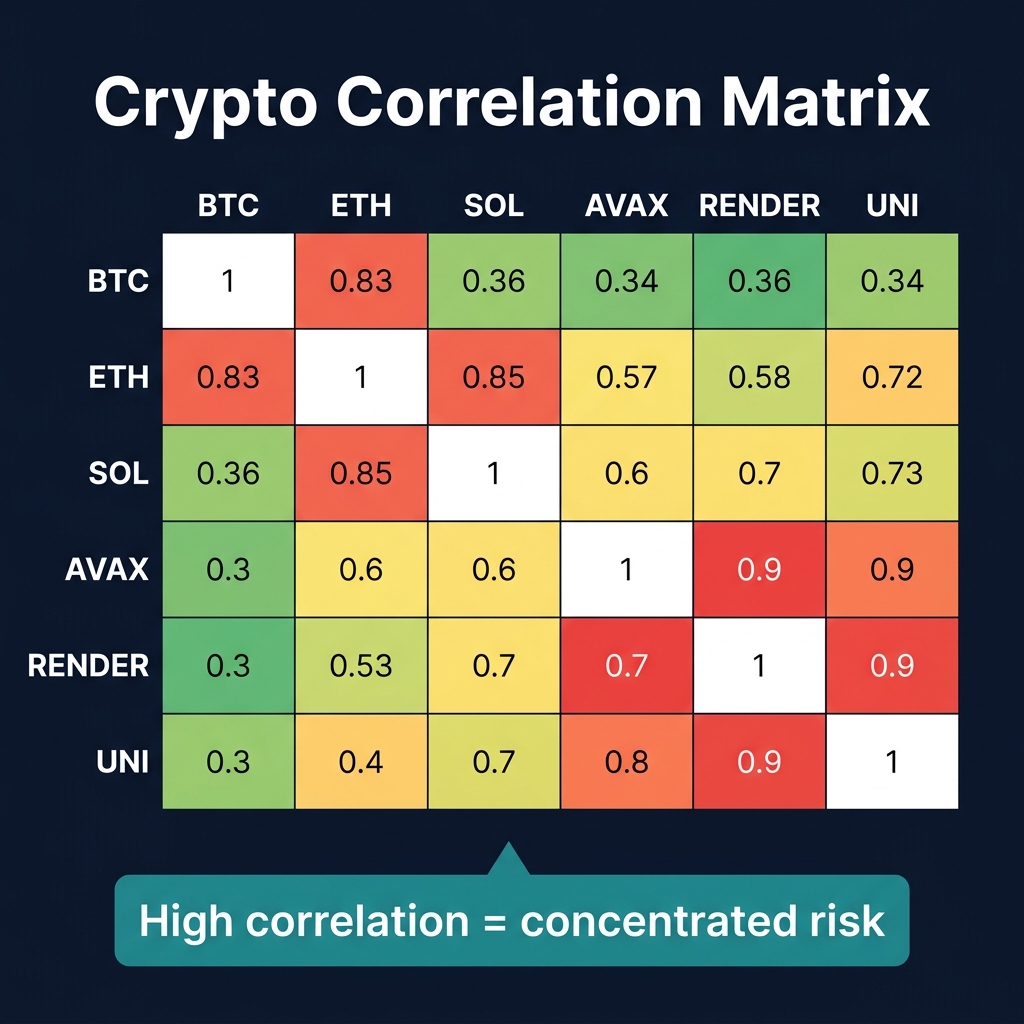
A correlation matrix shows pairwise relationships between assets on a scale from -1.0 (perfectly inverse) to +1.0 (perfectly identical). Here's a representative 60-day rolling correlation matrix for major crypto assets in May 2026:
BTC
ETH
SOL
AVAX
RENDER
UNI
BTC
1.00
0.78
0.72
0.68
0.51
0.63
ETH
0.78
1.00
0.81
0.76
0.59
0.74
SOL
0.72
0.81
1.00
0.83
0.62
0.70
AVAX
0.68
0.76
0.83
1.00
0.55
0.71
RENDER
0.51
0.59
0.62
0.55
1.00
0.44
UNI
0.63
0.74
0.70
0.71
0.44
1.00
Key Observations
High-correlation clusters: SOL and AVAX show 0.83 correlation. Holding both in large sizes creates concentration risk because they move together. If SOL drops 20%, AVAX is likely dropping 15-18% simultaneously.
Lower-correlation opportunities: RENDER shows notably lower correlations with BTC (0.51) and AVAX (0.55). This makes it a genuine diversifier because it captures different market narratives (AI/compute sector versus L1 infrastructure).
The ETH hub effect: ETH is moderately-to-highly correlated with everything. It sits at the center of the crypto correlation web because it connects to DeFi (UNI), L1 competitors (SOL, AVAX), and AI infrastructure (RENDER through shared Ethereum ecosystem exposure).
How AI Uses Correlation Data
AI portfolio optimizers don't just look at a single correlation matrix. They track:
Rolling correlation over multiple windows (7-day, 30-day, 90-day) to detect regime shifts
Conditional correlations (correlation during up-moves vs. down-moves, which often differ significantly)
Tail correlations (correlation during extreme events, typically much higher than average)
Sector-level correlations instead of just token-level, identifying when entire sectors decouple
When the AI detects that SOL-AVAX correlation has risen from 0.72 to 0.93 over two weeks, it flags excessive concentration and recommends reducing one of the two positions.
AI-Driven Sector Rotation
Beyond individual asset correlations, AI models track sector-level capital flows to identify rotation opportunities. The crypto market has distinct sectors, each with different risk characteristics and performance cycles.
Sector
Representative Tokens
Correlation to BTC (May 2026)
Current AI Signal
Layer 1
ETH, SOL, AVAX, SUI
0.72 – 0.83
Neutral
DeFi
UNI, AAVE, MKR
0.63 – 0.74
Overweight
AI/Compute
RENDER, FET, TAO
0.44 – 0.59
Strong overweight
Meme
DOGE, PEPE, WIF
0.35 – 0.61
Underweight
AI sector rotation works by measuring relative strength across sectors over rolling timeframes. When the AI detects capital flowing from L1s into AI tokens (rising AI-sector relative strength + falling L1 relative strength), it shifts allocation to capture that momentum before it becomes consensus.
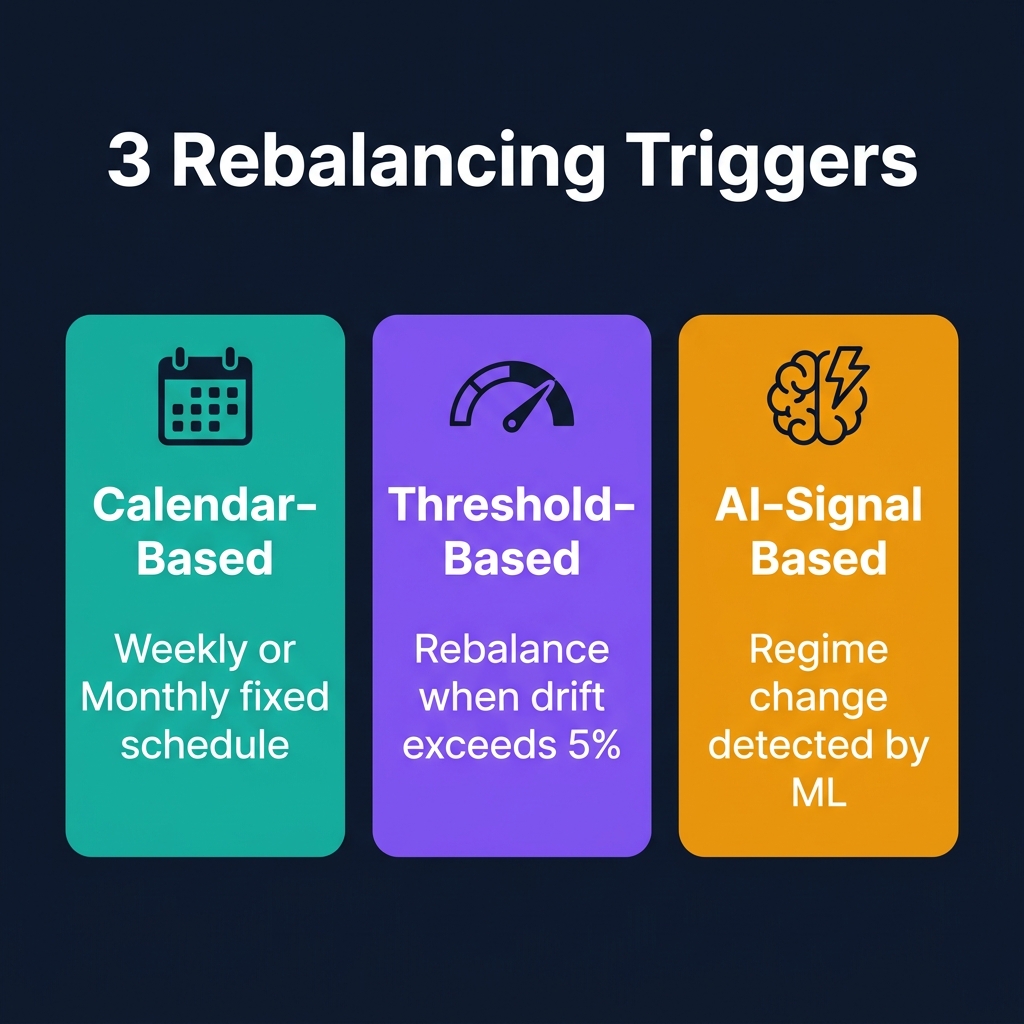
Portfolio drift is inevitable. As assets move in price, your carefully constructed allocation shifts away from targets. The question is not whether to rebalance, but which trigger mechanism to use.
1. Calendar-Based Rebalancing
Reset allocations to targets on a fixed schedule: weekly, bi-weekly, or monthly.
How it works:
Every [Sunday at 12:00 UTC / 1st of month]:
  1. Calculate current allocation percentages
  2. Compare to target allocation
  3. Sell overweight positions
  4. Buy underweight positions
  5. Log changes and updated allocations
Pros: Simple to implement, removes emotional decision-making, predictable transaction costs.
Cons: Ignores market conditions entirely. A monthly rebalance on March 1st doesn't know that the market crashed 30% on February 28th and may be in a dead-cat bounce. Misses optimal rebalancing windows during high-volatility periods. May rebalance unnecessarily when allocations are barely off target.
Best for: Passive long-term portfolios, portfolios with fewer than 5 positions.
2. Threshold-Based Rebalancing
Rebalance when any position drifts beyond a predefined percentage from its target.
How it works:
Threshold: 5% absolute drift

Monitor continuously:
  If |current_allocation - target_allocation| > 5%
  for ANY position:
    -> Trigger rebalance for ALL positions

Example:
  BTC target: 30%, current: 36.2%
  Drift: +6.2% -> Exceeds 5% threshold
  -> Rebalance entire portfolio
Pros: Responds to actual market movements, avoids unnecessary rebalancing when allocations are stable, catches runaway positions before they dominate.
Cons: During trending markets, threshold may trigger repeatedly (high frequency and fees). During quiet markets, may never trigger (allocation staleness). Doesn't differentiate between healthy drift (a winning position growing) and unhealthy drift (correlation breakdown).
Optimal threshold ranges:
Portfolio Type
Threshold
Rationale
Conservative (BTC-heavy)
7-10%
Lower volatility, less frequent triggers
Balanced (mixed)
5-7%
Standard for most portfolios
Aggressive (alt-heavy)
3-5%
Higher volatility, tighter control needed
3. AI-Signal Based Rebalancing
The most sophisticated approach. Rebalancing is triggered by AI-detected changes in market regime, correlation structure, or risk conditions, not by arbitrary time periods or mechanical thresholds.
AI-driven triggers include:
Regime change detection: Shift from trending to mean-reverting market (or vice versa)
Volatility regime shift: Market volatility transitions from low to high regime (GARCH model detection)
Sector rotation signal: Capital flows indicate money moving between sectors
Risk budget exhaustion: Portfolio's expected maximum drawdown exceeds tolerance
Example AI rebalancing decision (May 2026):
AI SIGNAL: Regime change detected
----------------------------------
Date: May 15, 2026
Previous regime: Low-volatility trending (since March 22)
New regime: Transitional / rising volatility

Evidence:
- BTC 30-day realized vol: 2.8% -> 4.6% (+64%)
- SOL-AVAX correlation: 0.72 -> 0.91
- AI sector relative strength: +18% vs L1 (30-day)
- BTC dominance: declining 3.2% over 14 days

Recommended actions:
1. Reduce SOL from 20% to 14% (correlation risk with AVAX)
2. Increase RENDER from 12% to 16% (sector momentum)
3. Increase stables from 8% to 14% (volatility hedge)
4. Hold BTC and ETH allocations (stable anchor)

Expected impact: Portfolio Sharpe improvement from 1.42 to 1.61
Pros: Most responsive to actual market conditions, avoids unnecessary trading, captures opportunities that mechanical rules miss.
Cons: Model complexity and potential failure, requires reliable data infrastructure, harder to audit and explain decisions.
Backtest Comparison: Equal-Weight vs. AI-Optimized
Theory is useful. Data is decisive. Here's a simulated backtest comparison of two portfolio strategies over the first half of 2026, using the same five-asset universe (BTC, ETH, SOL, AVAX, RENDER).
Backtest Parameters
Parameter
Equal-Weight
AI-Optimized
Assets
BTC, ETH, SOL, AVAX, RENDER
Same universe
Initial allocation
20% each
Dynamic (AI model)
Rebalancing
Monthly (1st of each month)
AI-signal triggered
Period
Jan 1, 2026 – May 29, 2026
Same
Starting capital
$100,000
$100,000
Transaction costs
0.1% per trade
0.1% per trade
Performance Results
Metric
Equal-Weight
AI-Optimized
Difference
Total return
+28.4%
+41.7%
+13.3%
Annualized return
+68.1%
+100.1%
+32.0%
Max drawdown
-18.6%
-11.3%
+7.3% better
Sharpe ratio
1.24
1.87
+0.63
Sortino ratio
1.58
2.41
+0.83
Calmar ratio
3.66
8.86
+5.20
Win rate (monthly)
60%
80%
+20%
Rebalance count
5
8
+3
Transaction costs
$312
$487
+$175
What Drove the Difference
The AI-optimized portfolio outperformed primarily through three mechanisms:
Drawdown avoidance. When the February correction hit (-22% on SOL, -18% on AVAX), the AI model had already detected rising volatility and correlation convergence. It had shifted 6% from alts to stables on February 8th, limiting portfolio drawdown to -11.3% versus -18.6% for equal-weight.
Sector rotation capture. The AI model detected capital rotating into AI/compute tokens in March (RENDER relative strength surging). It increased RENDER allocation from 12% to 18% on March 11th, capturing a +34% move that the equal-weight portfolio only participated in at 20% sizing.
Correlation-aware sizing. When SOL-AVAX correlation spiked above 0.90 in April, the AI reduced AVAX allocation to avoid doubling up on the same risk exposure. Equal-weight continued holding both at 20%, amplifying the April 19th sector drawdown.
Important caveat: Backtests are not guarantees. They reflect model behavior on historical data and are susceptible to overfitting, survivorship bias, and look-ahead bias. Always forward-test any strategy with small capital before deploying at scale. For more on backtesting methodology, see our AI Backtesting Crypto Strategies guide.
Risk-Adjusted Performance Metrics
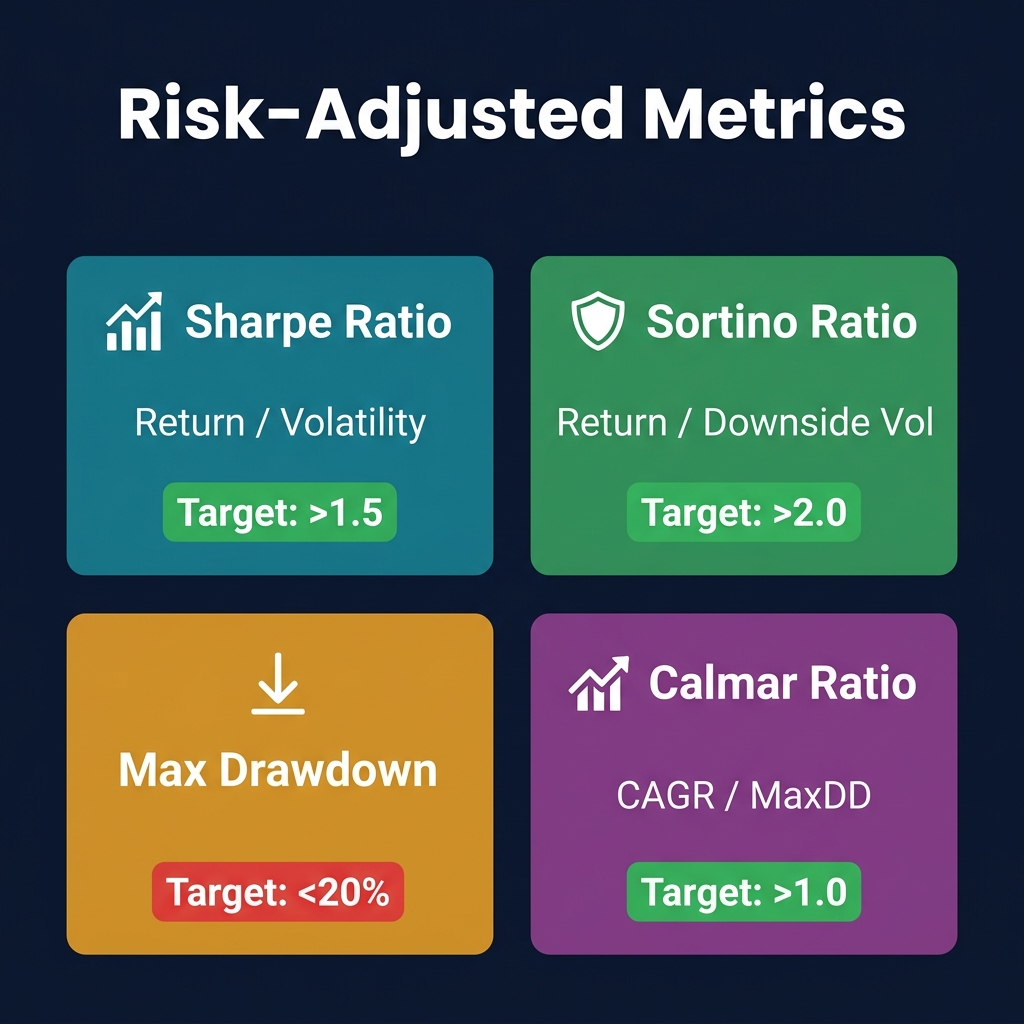
Raw returns are misleading. A portfolio that returned 50% but had a 40% drawdown is worse risk-adjusted than one returning 30% with a 10% drawdown. AI portfolio optimization targets risk-adjusted metrics, not just absolute returns.
Sharpe Ratio
Formula: (Portfolio Return – Risk-Free Rate) / Portfolio Standard Deviation
The Sharpe ratio measures return per unit of total volatility. Higher is better.
Sharpe Ratio
Interpretation
< 0.5
Poor risk-adjusted returns
0.5 – 1.0
Acceptable
1.0 – 2.0
Good
2.0 – 3.0
Excellent
> 3.0
Exceptional (verify for errors)
Limitation: Treats upside volatility and downside volatility equally. A portfolio that shoots up 20% in a day has higher volatility, but that's good volatility, and the Sharpe ratio penalizes it.
The Sortino ratio fixes the Sharpe ratio's main flaw by only penalizing downside volatility. It ignores upside variance entirely. For crypto portfolios where upside spikes are desirable, the Sortino ratio is a more accurate measure.
Rule of thumb: A crypto portfolio's Sortino ratio should be at least 1.2x its Sharpe ratio. If it's lower, your upside and downside volatility are roughly equal, meaning you're not capturing asymmetric gains.
Max Drawdown
Formula: (Peak Value – Trough Value) / Peak Value
The maximum drawdown measures the largest peak-to-trough decline in portfolio value. It tells you the worst-case experienced loss during the measurement period.
Max Drawdown
Risk Level
Typical Portfolio
< 10%
Conservative
BTC/stables heavy
10-20%
Moderate
Balanced crypto
20-35%
Aggressive
Alt-heavy
> 35%
High risk
Concentrated/leveraged
Why it matters: A 30% drawdown requires a 43% gain to recover. A 50% drawdown requires 100%. Max drawdown directly determines how long recovery takes and whether you psychologically survive the drawdown period.
Calmar Ratio
Formula: Annualized Return / Max Drawdown
The Calmar ratio captures the relationship between returns and worst-case drawdowns. It's arguably the most practical metric for crypto portfolios because it directly answers: "How much did I earn relative to the worst pain I had to endure?"
Calmar Ratio
Interpretation
< 1.0
Return doesn't justify the drawdown
1.0 – 3.0
Acceptable risk/reward
3.0 – 5.0
Strong portfolio construction
> 5.0
Excellent (common in bull markets only)
Putting It All Together
No single metric tells the full story. Use them in combination:
Portfolio Health Check:
  Sharpe   > 1.0   -> Adequate return per unit of risk
  Sortino  > 1.5   -> Good asymmetry (more upside than downside)
  MaxDD    < 20%   -> Survivable drawdowns
  Calmar   > 2.0   -> Returns justify the risk taken

If ALL four pass -> Portfolio is well-optimized
If 2-3 pass     -> Investigate failing metrics
If 0-1 pass     -> Restructure immediately
Even with AI tools, portfolio optimization can go wrong. These are the most frequent mistakes that intermediate traders make.
Mistake 1: Optimizing for Past Returns
Fitting a portfolio model to maximize historical returns is the fastest path to future losses. Markets are non-stationary. The asset allocation that produced the highest Sharpe ratio over the last six months is almost certainly not the allocation that will produce the highest Sharpe ratio over the next six months.
Fix: Use out-of-sample testing, walk-forward optimization, and regime-aware models that adapt to changing conditions rather than memorizing the past.
Mistake 2: Ignoring Transaction Costs
Every rebalance incurs trading fees, slippage, and potentially tax events. A strategy that rebalances daily might show a higher gross Sharpe ratio, but after accounting for 0.1% per trade across multiple positions multiple times per month, the net returns can be significantly lower.
Fix: Include realistic transaction costs (0.05-0.15% per trade for major exchanges) in all backtests. Set minimum trade thresholds so the optimizer doesn't suggest rebalancing $50 worth of AVAX.
Mistake 3: Over-Diversification
Holding 25+ tokens doesn't reduce risk; it creates a high-cost, unmanageable pseudo-index that underperforms a simple BTC/ETH portfolio. Each additional position adds monitoring overhead and dilutes high-conviction ideas.
Fix: Cap your portfolio at 8-12 positions for portfolios under $100,000. Every position should have a clear thesis and a meaningful allocation (minimum 3-5% for non-speculative positions).
Mistake 4: Ignoring Tail Risk
Standard optimization assumes normal market conditions. But the events that matter most for portfolio survival, exchange hacks, flash crashes, regulatory bans, and stablecoin depegs, are tail events that no optimizer predicts.
Fix: Always maintain a stablecoin reserve (10-20% of portfolio). Stress-test your portfolio against -30% and -50% scenarios. Use CVaR (Conditional Value-at-Risk) instead of standard deviation as your risk measure.
Mistake 5: Rebalancing at the Worst Time
Mechanical rebalancing during a market crash forces you to buy assets that may continue falling. Conversely, selling a parabolic winner during a blow-off top because it exceeded your allocation target surrenders the best gains.
Fix: Combine threshold-based triggers with AI regime detection. Pause mechanical rebalancing during detected crash regimes. Widen thresholds during trending markets to let winners run.
How CoinXSight Deep Alpha Supports Portfolio Optimization
CoinXSight's Deep Alpha module provides the data infrastructure and analytical tools that power AI portfolio optimization decisions.
Confluence Scoring for Asset Selection
Deep Alpha's Confluence Score evaluates each asset across 12+ indicators spanning technical, on-chain, and sentiment dimensions. When building an AI-optimized portfolio, use the Confluence Score as a primary filter:
Confluence Score
Portfolio Action
8-10/10
Full allocation, high conviction
6-7/10
Standard allocation
4-5/10
Reduced allocation or watchlist only
1-3/10
Exclude from portfolio
Sector-Level Analysis
Deep Alpha tracks sector performance in aggregate, showing which sectors are gaining momentum and which are fading. This maps directly to the AI sector rotation strategy discussed above: overweight sectors with rising Confluence Scores across multiple tokens, underweight sectors where scores are declining.
Correlation Insights
CoinXSight's analytics surface cross-asset relationships and flag when your portfolio's effective diversification is lower than your position count suggests. If three of your five positions are highly correlated L1 tokens, the platform highlights this concentration risk.
Integration Workflow
Screen assets using Deep Alpha Confluence Scores (filter for 6+/10)
Check sector signals for rotation opportunities
Review correlation data to ensure genuine diversification
Set allocation targets based on AI-optimized weights
Monitor drift and rebalance when AI signals trigger or thresholds breach
Measure performance using risk-adjusted metrics (Sharpe, Sortino, Calmar)
For a complete walkthrough of CoinXSight's analytical capabilities, see our AI Crypto Trading Guide.
FAQ
What is AI portfolio optimization in crypto?
AI portfolio optimization uses machine learning models to determine optimal asset allocations, rebalancing timing, and risk management parameters for crypto portfolios. Unlike manual allocation, AI continuously analyzes price data, correlations, volatility regimes, and on-chain metrics to adapt portfolio construction to changing market conditions. CoinXSight's Deep Alpha module provides the scoring and sector analysis that feeds into this optimization process.
How often should an AI-optimized portfolio rebalance?
It depends on the trigger mechanism. Calendar-based strategies typically rebalance monthly. Threshold-based strategies trigger when any position drifts more than 5% from target. AI-signal based strategies rebalance only when the model detects meaningful regime changes, correlation shifts, or sector rotation, typically 6-12 times per year. The goal is to rebalance when it improves risk-adjusted returns, not on an arbitrary schedule.
Is Modern Portfolio Theory valid for crypto?
The core principle, that diversification across uncorrelated assets reduces portfolio risk, remains valid. However, standard MPT assumptions (normal distributions, stable correlations, rational actors) break down in crypto. AI-enhanced MPT adapts by using dynamic correlations, fat-tailed distributions, and regime-aware optimization to account for crypto's unique characteristics.
What Sharpe ratio should I target for a crypto portfolio?
A Sharpe ratio above 1.0 indicates good risk-adjusted returns. Above 2.0 is excellent. During bull markets, Sharpe ratios of 2-4 are achievable. During bear markets, maintaining a positive Sharpe ratio is itself a success. Be cautious of backtested Sharpe ratios above 3.0 as they often indicate overfitting.
Can I do AI portfolio optimization with a small portfolio?
Yes. The principles apply regardless of portfolio size. For portfolios under $10,000, simplify by limiting to 4-6 positions, using threshold-based rebalancing (avoiding excessive transaction costs), and focusing on BTC/ETH as core positions with 1-2 carefully selected satellite positions scored by CoinXSight's Confluence system.
AI portfolio optimization transforms crypto portfolio management from guesswork into a systematic, data-driven discipline. By combining dynamic correlation analysis, regime-aware allocation, and intelligent rebalancing triggers, AI models consistently outperform static allocation strategies on risk-adjusted metrics. The key is not predicting which assets will pump, but constructing portfolios that capture upside while limiting the drawdowns that destroy compounding. Start with CoinXSight's Deep Alpha module to score assets, identify sector rotations, and build portfolios grounded in multi-factor analysis rather than intuition.
Which crypto trading platform is best for ai portfolio optimization analysis?
CoinXSight offers ai portfolio optimization alongside 12+ other trading indicators, AI-powered Confluence Scoring, and Smart Money Concepts u2014 making it a comprehensive crypto analytics platform for technical analysis.
KZ
Dr. Kevin Zhang
AI // QUANT LABS
Principal AI & Quantitative Researcher·Deep Alpha Engine Labs
Ph.D. in Computational Statistics. Leads machine learning architecture, regime-switching detection, and automated execution systems at CoinXSight Labs.
QUANTITATIVE SUITE // DEEP ALPHA ENGINEACTIVE
BTC/USDT // LIVE SCANNER
CONFLUENCE 100
LIVE SPOT PRICE$82,617.68STRONG_BUY
TP2
$90,817.78
+10.15%
TP1
$85,796.52
+4.06%
ENTRY
$82,449.02
ZONE
SL
$80,775.27
-2.03%
Auto-detect Order Blocks, Fair Value Gaps and risk-adjusted DCA ladders in < 5s.
Master AI-driven crypto risk management — position sizing formulas, stop loss strategies, and portfolio protection with CoinXSight. Essential crypto technical…