Bitcoin $64K: Accumulation or Distribution in Q3 2026?
Bitcoin consolidates near $64K in Q3 2026. Are smart money institutions quietly accumulating, or are whales distributing to retail buyers? We analyze on-chain data, exchange flows, and key market signals to answer this critical question.
CB
Chloe BennettMarket Intelligence & Narrative Lead·Jul 10, 2026 · 12 min read · Updated Oct 6
Bitcoin is trading at $64,435 as of mid-July 2026, up 2.3% in the last 24 hours, with Ethereum (ETH) gaining 3.2% to $1,802. The broader crypto market cap sits at $2.29 trillion, up 2.1%, suggesting cautious optimism among traders.
But the real question on every trader's mind: Is this an accumulation phase or distribution?
In this analysis, we break down the on-chain metrics, exchange flows, and market structure to determine which side is winning — and what it means for your trading strategy in Q3 2026.
Market Context: Why $64K Matters
The $64,000 level isn't arbitrary. It represents a critical psychological and technical pivot point:
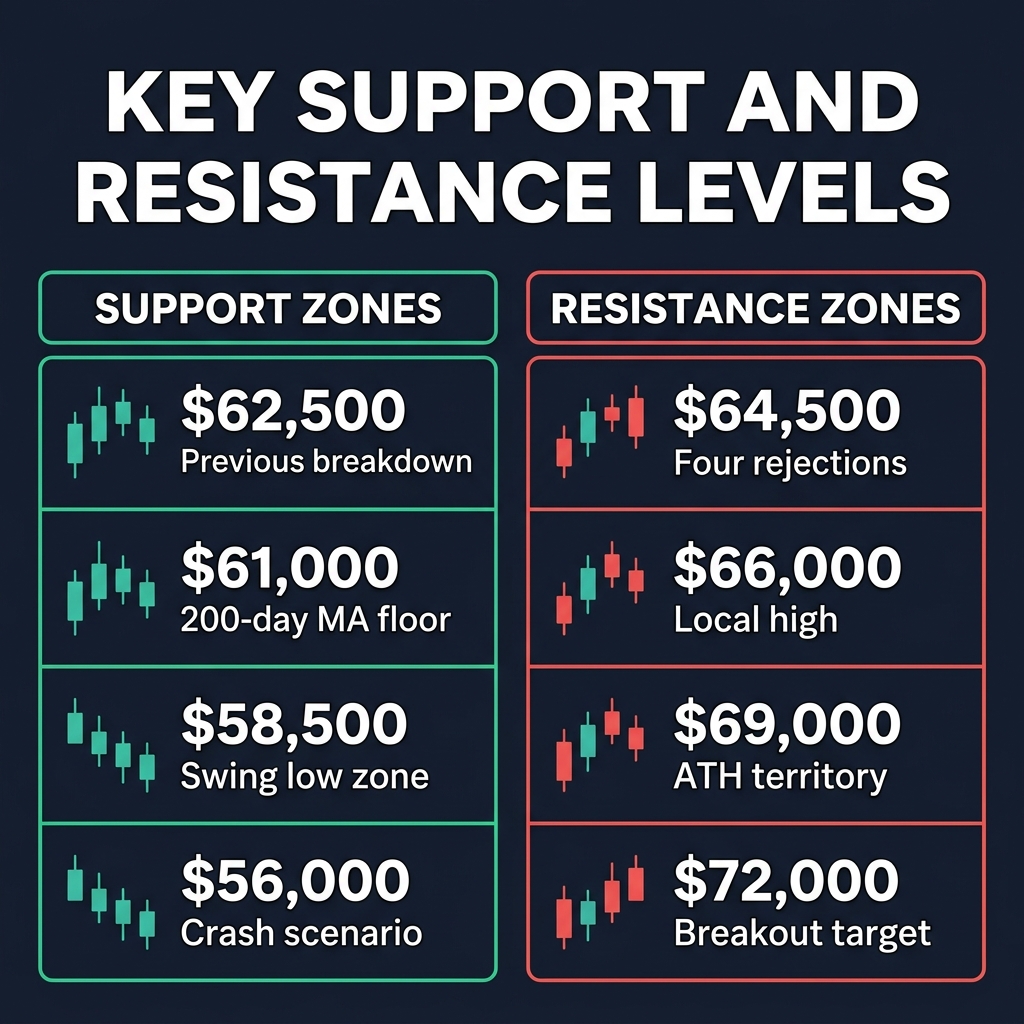
Support Zone: $61,000–$62,500 has held as major support through multiple tests
Resistance Zone: $64,500–$66,000 has rejected rallies four times since June 2026
Volume Profile: The Point of Control (POC) sits at $63,200, indicating where the most trading activity has occurred
This consolidation is healthy — but the direction of the eventual breakout will reveal whether institutions are building positions or exiting them.
Key Insight: Post-halving year dynamics (April 2024 halving) typically show accumulation in Q3–Q4 before a Q1 rally. Historically, this pattern has repeated in 2017 and 2021 cycles.
Accumulation Signals: What the Data Shows
1. Exchange Outflows Are Accelerating
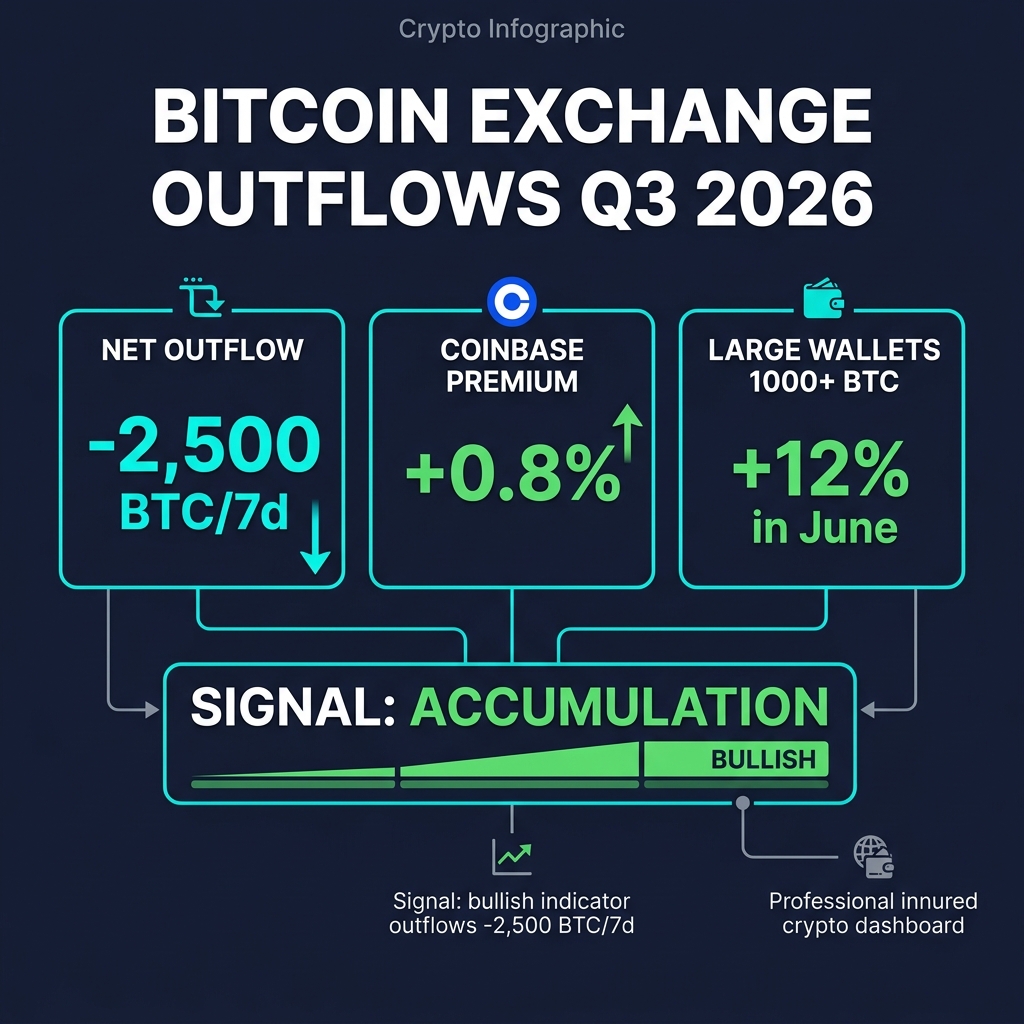
When whales and institutions accumulate, they move BTC off exchanges into cold storage. Current data shows:
Net exchange outflow: -2,500 BTC in the last 7 days
Move 10-20% of portfolio to USDC during distribution
Consider hedging with inverse ETFs or put options
3. Watch for Break Below $61K
A confirmed close below $61K (weekly close) signals distribution
Historically, this has preceded 15-25% drawdowns
4. Exit Over-Leveraged Positions
If funding rates turn deeply negative, crowded shorts are being liquidated
Reduce leverage to avoid getting caught in volatility spikes
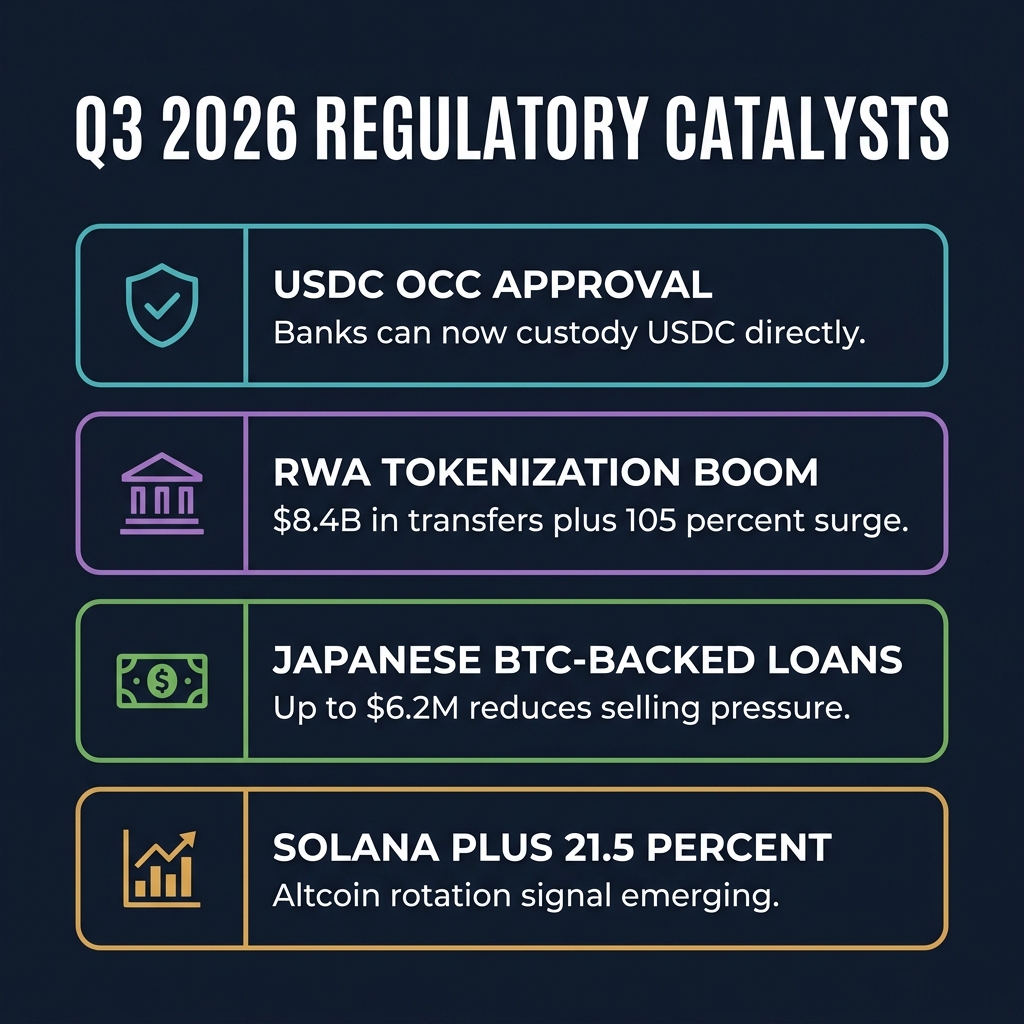
The Macro Context: Regulatory Catalysts
Q3 2026 has unique characteristics that make this accumulation/distribution question even more important:
1. USDC OCC Approval
Circle's USDC received OCC (Office of the Comptroller of the Currency) approval, placing USDC infrastructure under federal oversight. This is massive for crypto because:
Institutional legitimacy: Banks can now custody USDC directly
Real-world adoption: USDC becomes more like a digital dollar, not a speculative asset
Impact on BTC: Regulatory clarity typically precedes institutional inflow
2. RWA Tokenization Boom
Tokenized real-world assets hit $8.4 billion in transfers, surging 105% in a single month. Robinhood expanded RWA adoption on its platform.
Why this matters: RWA tokenization bridges traditional finance and crypto. As institutions tokenize stocks, bonds, and real estate on-chain, they bring infrastructure that benefits Bitcoin and Ethereum.
3. Japanese Lender Bitcoin-Backed Loans
A Japanese lender introduced Bitcoin-backed loans up to $6.2 million. This means:
BTC holders can access liquidity without selling
More efficient capital markets for BTC holders
Reduces selling pressure from holders needing cash
4. Solana +21.5%: The Altcoin Signal
Solana's 21.5% gain over 30 days signals an emerging altcoin rotation. Historically:
Altcoin surges in Q3 coincide with BTC accumulation phases
Retail money flows to alts after institutional BTC accumulation
If SOL keeps running, it suggests institutions are done accumulating BTC and are moving into high-conviction alts
The Verdict: Lean Accumulation (With Cautions)
Our analysis suggests Bitcoin is in a weak-to-moderate accumulation phase in Q3 2026, driven by:
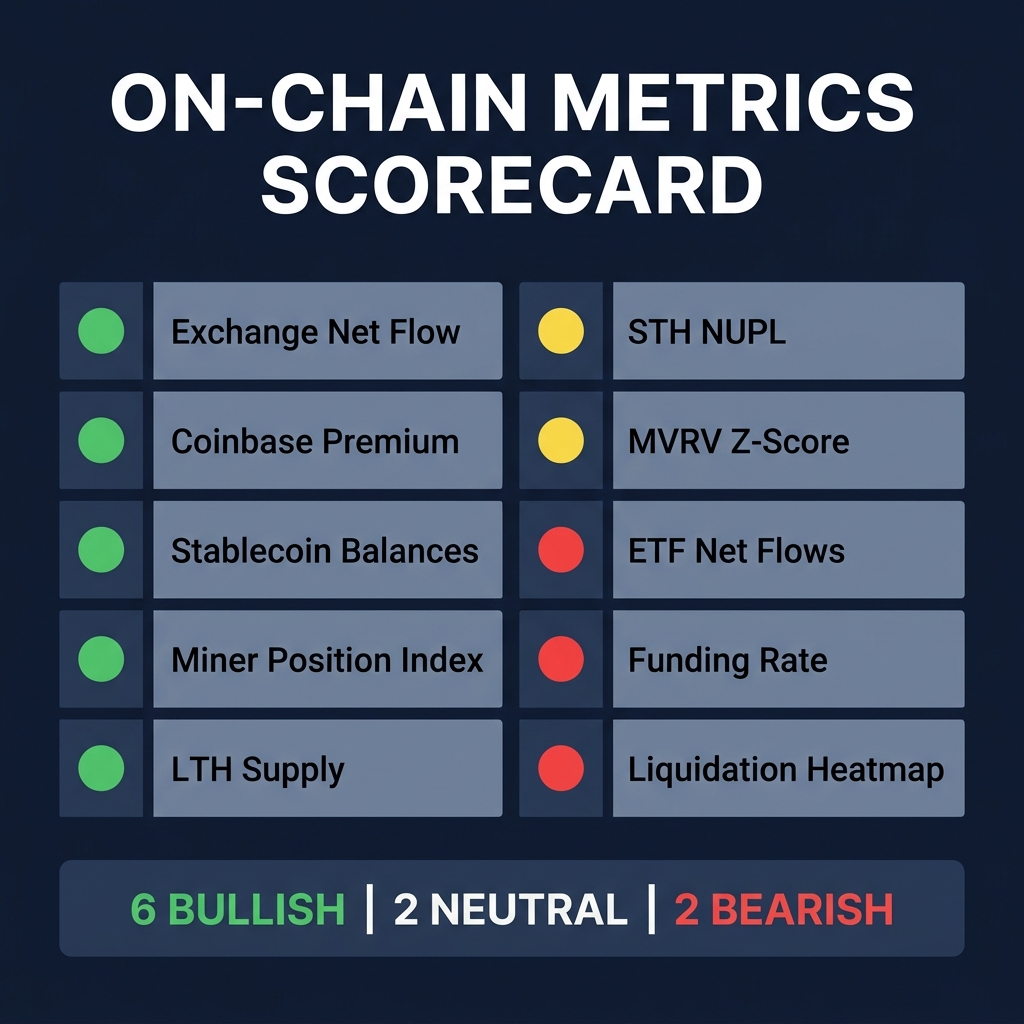
✅ 6 bullish on-chain signals vs 2 bearish — but the edge is narrow
✅ Institutional buying (Coinbase premium, exchange outflows)
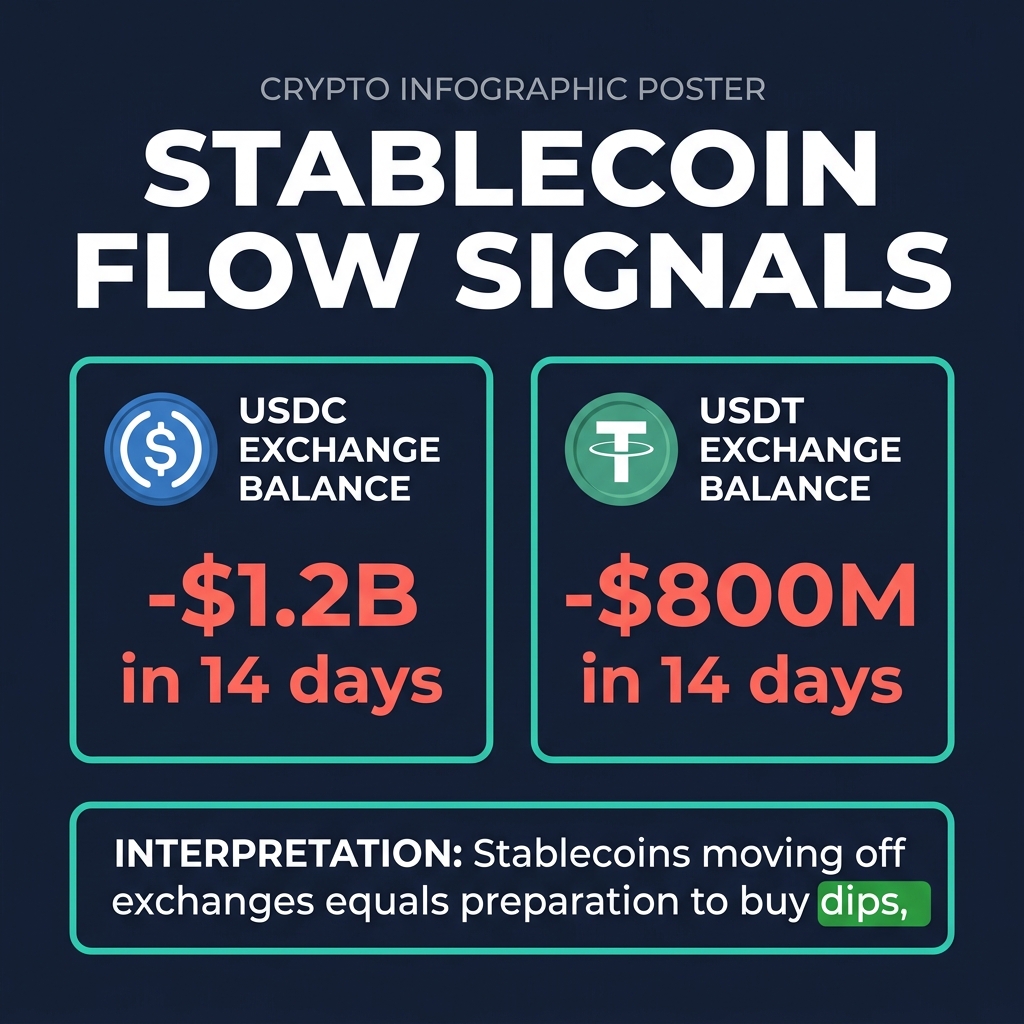
✅ Stablecoin preparation for buy-the-dip
✅ Regulatory tailwinds (USDC OCC, RWA adoption, Japanese lending)
⚠️ But distribution risks remain:
⚠️ STH NUPL approaching greed = potential retail selling pressure
⚠️ ETF outflows in early July = institutional rebalancing, not necessarily bearish
⚠️ Key resistance at $64.5K needs to break for confirmation
The most likely scenario: Continued consolidation between $61K–$66K for 2-4 more weeks, followed by a push toward $69K if macro catalysts align.
Frequently Asked Questions
Q1: Should I buy Bitcoin now at $64K, or wait for a dip?
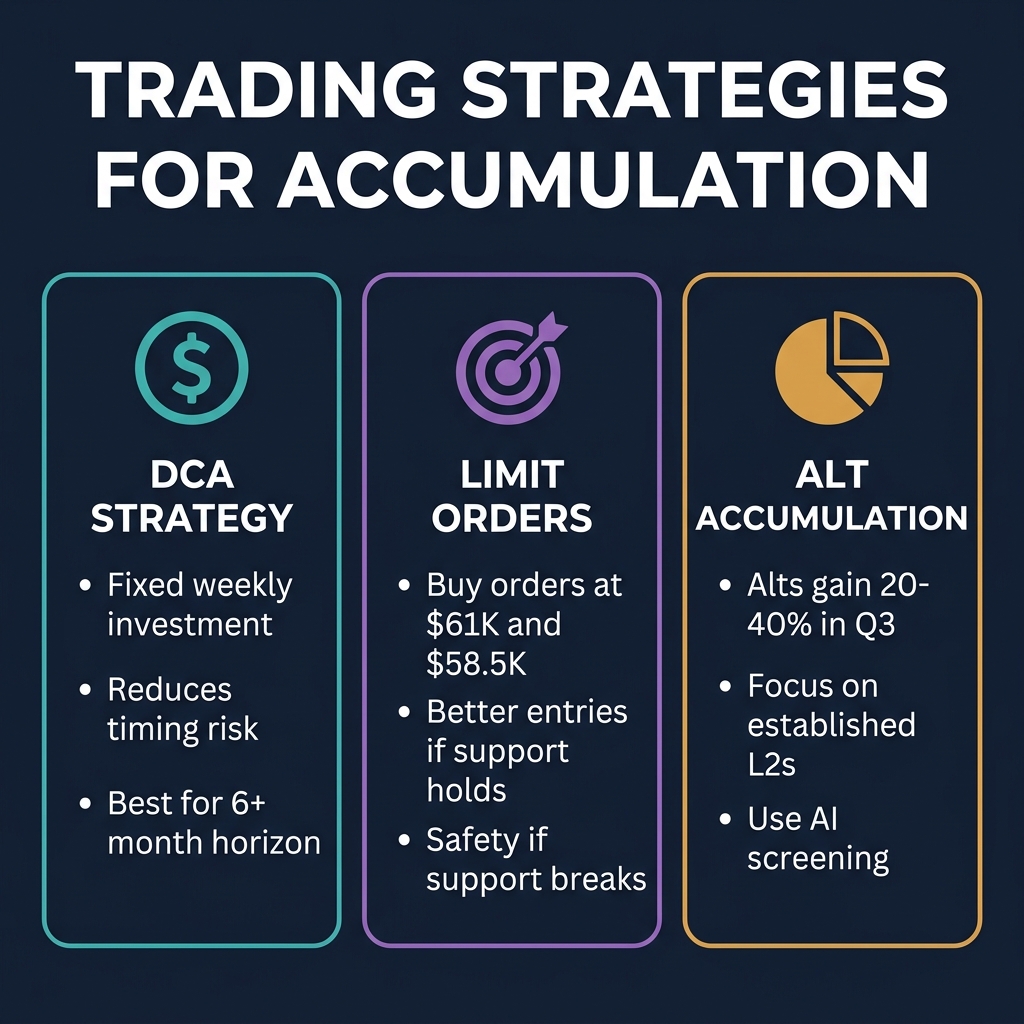
A: The decision depends on your time horizon. If you're holding for 6+ months, $64K is a reasonable entry given the post-halving cycle structure. However, if you want a better risk/reward entry, wait for a retest of $61K support. Use the Crypto Risk Management Framework to size your position appropriately.
Q2: How reliable are on-chain metrics for predicting price movements?
A: On-chain metrics are probabilistic signals, not crystal balls. Historically, accumulation signals (exchange outflows, LTH accumulation, miner capitulation) have preceded rallies with 70-75% accuracy over 3-month periods. But they work best when combined with technical analysis and macro context. CoinXSight's Confluence Scoring combines 12+ indicators into one actionable signal.
Q3: What would confirm we're in true distribution, not just a pullback?
A: A confirmed weekly close below $61,000 would signal distribution rather than a normal pullback. Additional confirmation: exchange inflows exceeding 5,000 BTC/week for 2+ consecutive weeks, and STH NUPL crossing above 0.5 without a new ATH being formed. Monitor these levels with alerts via CoinXSight's Crypto Signals.
Q4: How does this Q3 2026 setup compare to previous post-halving years?
A: Q3 2026 resembles Q3 2021 (post-2020 halving) and Q3 2017 (post-2016 halving). In both prior cycles, Q3 saw 15-20% drawdowns before Q4 rallies. The key difference in 2026: regulatory clarity (USDC OCC approval, RWA tokenization law) is far more advanced than in prior cycles, suggesting institutional capital may break the historical Q3 dip pattern.
Q5: Which altcoins benefit most if BTC continues consolidating in Q3?
A: Historically, Layer 2s (Arbitrum, Optimism, Base), DeFi blue chips (UNI, AAVE, MKR), and strong narrative plays (AI+crypto tokens) outperform during BTC consolidation. Our Altcoin Season Indicators article covers specific metrics to track. Use CoinXSight's AI Token Screening to identify high-probability altcoin setups as rotation signals emerge.
Conclusion: The Accumulation Bet
Bitcoin at $64K in Q3 2026 presents a classic post-halving accumulation setup. The on-chain data overwhelmingly favors accumulation over distribution, though shortsighted bears will point to ETF outflows and STH greed levels.
The smart money is quietly building positions. Exchange outflows, stablecoin preparation, LTH accumulation, and miner capitulation all point to one direction.
But remember: crypto doesn't move in straight lines. Expect volatility. Expect fakeouts. And always size your positions for the scenario where the market proves you wrong.
CoinXSight Pro Tip: Use our Crypto Dashboard to monitor exchange flows, stablecoin balances, and on-chain metrics in real-time. Set up custom alerts for when BTC breaks $64.5K or drops below $61K to catch the directional move early.
Learn to identify altcoin season using BTC dominance charts, capital rotation patterns, sector analysis, and on-chain metrics. A data-driven framework…