Altcoin Season Indicators: How to Identify Rotation from Bitcoin to Altcoins
Learn to identify altcoin season using BTC dominance charts, capital rotation patterns, sector analysis, and on-chain metrics. A data-driven framework for positioning ahead of altcoin rallies. Crypto market analysis every trader should follow.
CB
Chloe BennettMarket Intelligence & Narrative Lead·May 18, 2026 · 13 min read · Updated Oct 6
Altcoin season (or "alt season") is a period where altcoins — all cryptocurrencies other than Bitcoin — collectively outperform BTC. During these phases, capital rotates from Bitcoin into smaller-cap tokens, often producing 100-500%+ gains in select altcoins over weeks to months.
Understanding altcoin season isn't about chasing pumps — it's about recognizing the structural conditions that precede capital rotation and positioning accordingly. This guide provides a data-driven framework for identifying, confirming, and trading altcoin rotations.
The Capital Rotation Cycle
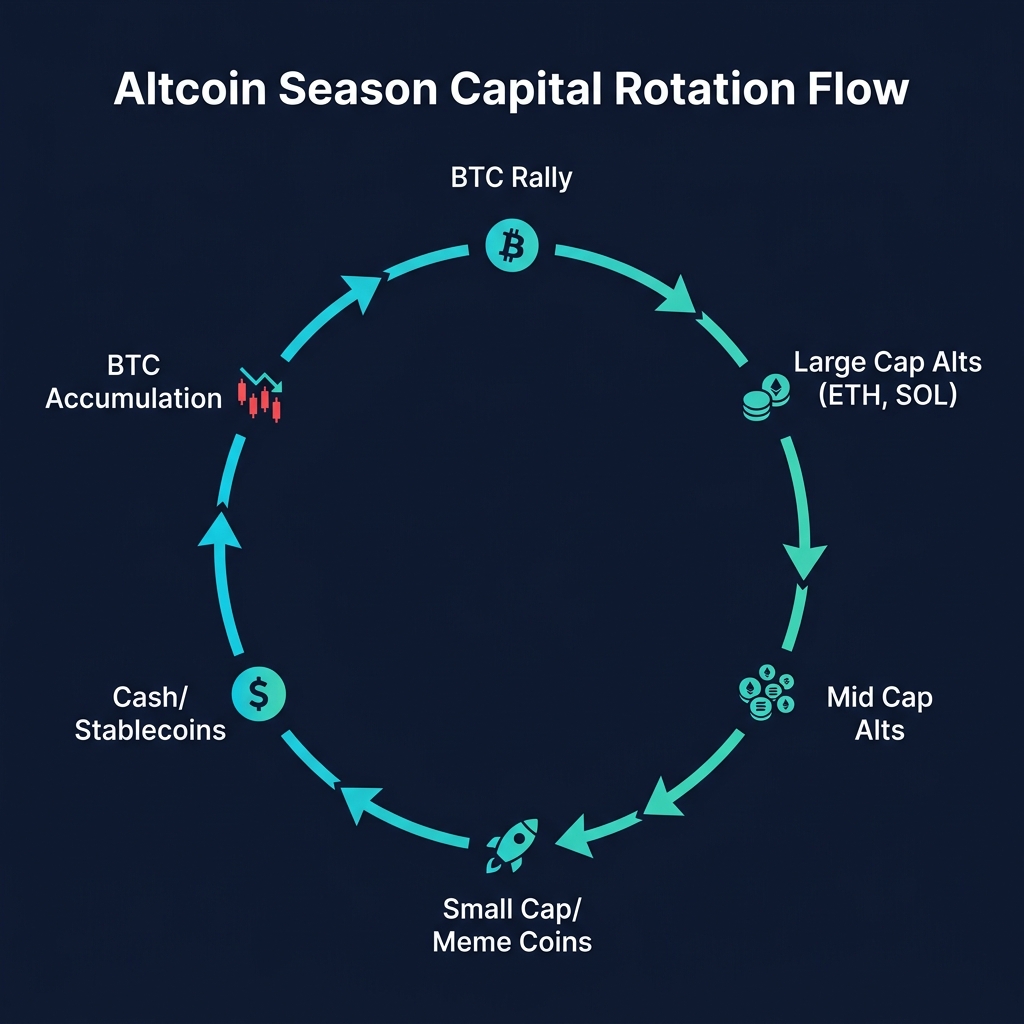
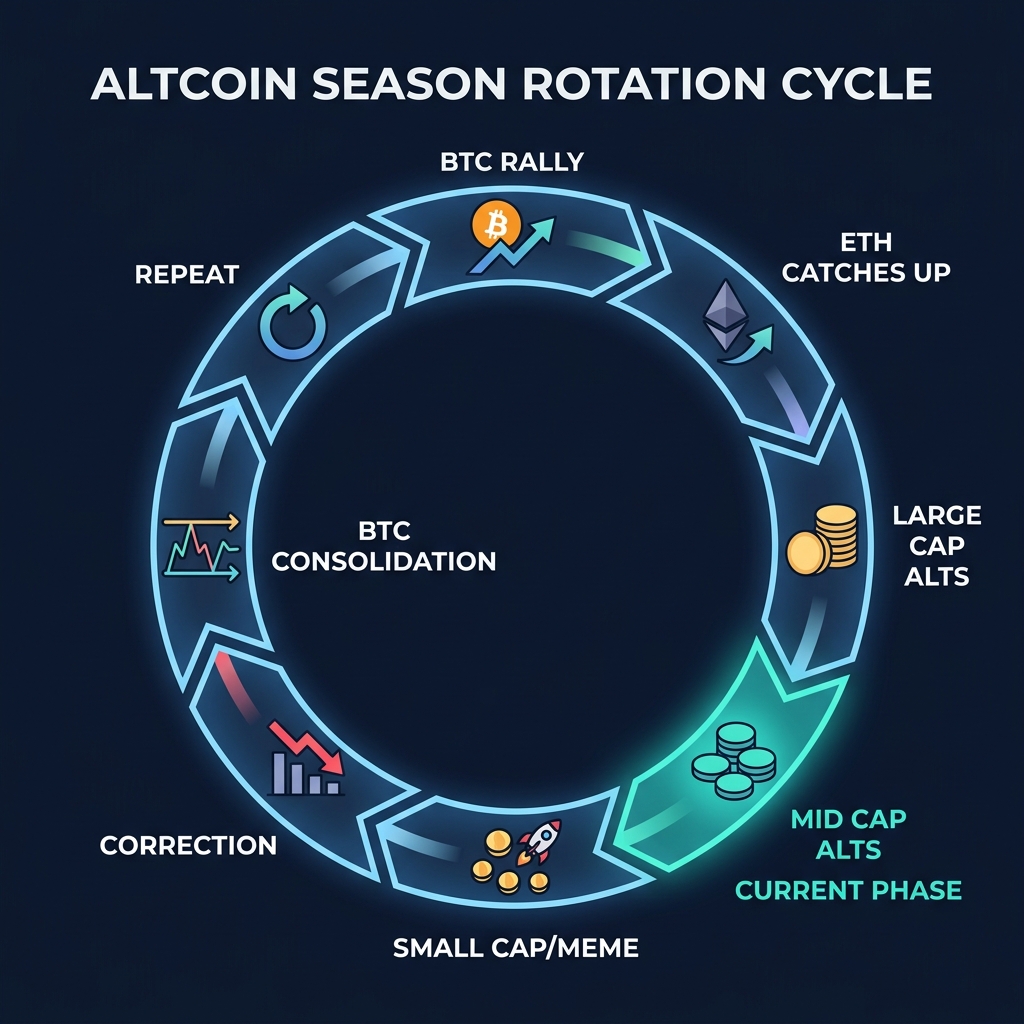
Crypto markets follow a predictable capital rotation pattern within each market cycle:
Phase 1: Bitcoin Leads
BTC dominance rising (typically 50% → 60%+)
New capital enters the crypto market through Bitcoin first — it's the most liquid, most recognized, and has the most regulated access points (ETFs, institutional products). During this phase:
BTC price rises while most altcoins lag or decline relative to BTC
BTC dominance increases
This phase typically begins after a bear market bottom or during the early expansion following a halving
Phase 2: Large-Cap Altcoins Rally
BTC dominance plateaus, ETH/BTC starts rising
Once BTC establishes a strong uptrend and traders gain confidence, capital begins flowing into established large-cap altcoins (ETH, SOL, BNB, ADA). This is the early altcoin phase:
ETH/BTC ratio turns bullish
Top 20 altcoins begin outperforming BTC
Total crypto market cap grows faster than BTC alone
The full altcoin season. Capital cascades from large caps into mid-caps, micro-caps, and narrative-driven tokens:
BTC dominance drops sharply
Sector rotation becomes visible (DeFi → AI → Memes → RWA → etc.)
Daily new token launches accelerate
Social media activity for altcoins peaks
This is the highest-risk, highest-reward phase
Phase 4: Distribution and Collapse
BTC dominance starts recovering
The altcoin season ends, often abruptly. Smart money exits altcoin positions and rotates back into BTC or stablecoins:
Most altcoins lose 50-90% of their peak value
Only the strongest projects maintain price levels
BTC dominance rises again as capital seeks safety
The 5 Key Altcoin Season Indicators
Modern crypto analytics platforms integrate these signals with additional data layers — combining trading indicators, on-chain metrics, and AI analysis for higher-probability entries.
Indicator 1: BTC Dominance Chart
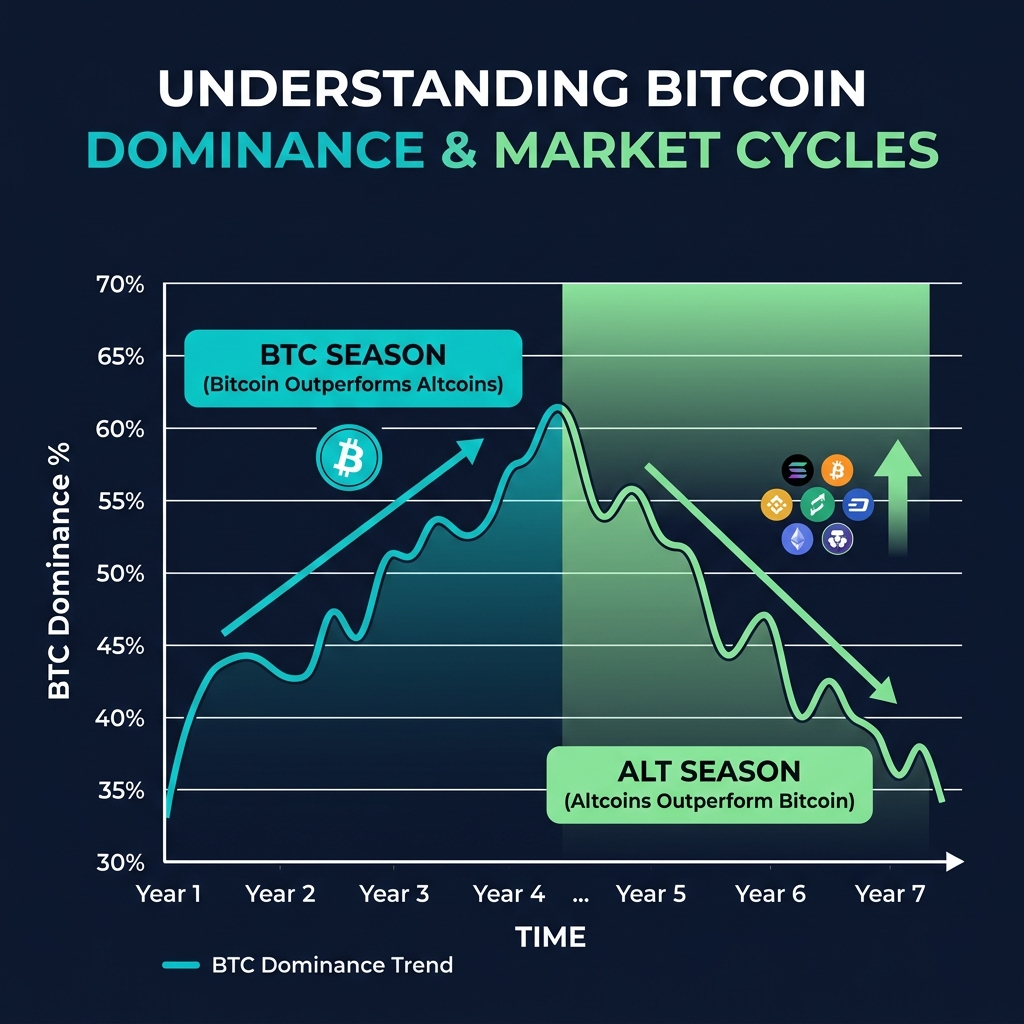
BTC dominance measures Bitcoin's market cap as a percentage of total crypto market cap. It's the single most important metric for identifying altcoin season.
How to read it:
Dominance rising → Bitcoin outperforming → Not altcoin season
Dominance falling → Altcoins outperforming → Altcoin season underway
Dominance at resistance and turning down → Altcoin season may be starting
Below 40%: Late-stage alt season, increasing risk of reversal
Track BTC dominance on CoinXSight's Discovery Market Scanner — it displays dominance metrics alongside sector performance data.
Indicator 2: ETH/BTC Ratio
The ETH/BTC trading pair is the leading indicator for altcoin rotation. Since ETH is the largest altcoin and the foundation of most DeFi/NFT/Layer 2 activity, capital flows to ETH before cascading to smaller altcoins.
Signals:
ETH/BTC making higher lows → Altcoin rotation beginning
ETH/BTC breaking above key resistance → Confirmed alt season catalyst
ETH/BTC sharply declining → Altcoin season is over or not starting
Indicator 3: Total3 Chart (Total Crypto Market Cap Excluding BTC and ETH)
The Total3 chart represents the total market cap of all cryptocurrencies except BTC and ETH. It's the purest measure of altcoin market health.
Signals:
Total3 breaking above its 200-day moving average → Structural altcoin strength
Total3 making new highs while BTC consolidates → Strong altcoin season
Total3 diverging negatively from BTC → Altcoin weakness, caution
Indicator 4: Altcoin Season Index
Several data providers calculate an "Altcoin Season Index" based on the percentage of top altcoins outperforming BTC over a rolling period (typically 90 days).
Interpretation:
Index above 75: Full altcoin season (75%+ of top altcoins outperforming BTC)
Index 50-75: Rotating, mixed conditions
Index 25-50: BTC-dominant market
Index below 25: Deep Bitcoin season (contrarian altcoin accumulation zone)
Indicator 5: Sector Rotation Heat Maps
Not all altcoins rally simultaneously. Capital rotates through sectors in a predictable sequence:
Layer 1s (ETH, SOL, AVAX) → Rally first as "infrastructure bets"
DeFi (UNI, AAVE, MKR) → Follow as on-chain activity increases
Layer 2s (ARB, OP, MATIC) → Benefit from L1 congestion
Narrative plays (AI tokens, RWA, meme coins) → Rally late, driven by speculation
Micro-caps and meme coins → Last to pump, first to crash
CoinXSight's Market Discovery module displays sector performance heat maps, helping you identify which rotation phase the market is in.
On-Chain Confirmation Signals
Beyond price-based indicators, on-chain data provides deeper confirmation of altcoin rotation:
Stablecoin Flows to Altcoin DEXs
When stablecoins flow from centralized exchanges to decentralized exchanges (Uniswap, Jupiter, Raydium), it indicates retail and whale capital is actively seeking altcoin exposure. Track this through CoinXSight's Exchange Flow Analysis.
New Wallet Address Growth
Altcoin seasons correlate with rapid growth in new wallet addresses across multiple chains. When Solana, Ethereum, and Base all show accelerating new address creation simultaneously, it suggests broad-based capital inflow — a hallmark of alt season.
DEX Volume vs. CEX Volume
The ratio of decentralized exchange (DEX) volume to centralized exchange (CEX) volume rises during altcoin seasons. DEXs are where most altcoin trading occurs, especially for smaller tokens not listed on major exchanges.
Smart Money Positioning
CoinXSight's Whale Tracking module shows where large addresses are accumulating. During the early stages of altcoin rotation, whale accumulation shifts from BTC-only to diversified altcoin positions. This shift typically precedes the broader altcoin rally by 2-4 weeks.
Practical Trading Strategies for Altcoin Season
Strategy 1: Sector Rotation Following
How it works: Identify the leading sector (using Discovery heat maps), allocate to the top 3-5 tokens in that sector, and rotate when the sector's momentum fades and a new sector begins leading.
Example sequence:
Week 1-3: Layer 1s leading → Allocate to SOL, AVAX, SUI
Week 7-9: AI narrative gains traction → Rotate to relevant AI tokens
Risk management:
Never allocate more than 15% of portfolio to a single altcoin
Use trailing stops of 15-20% to protect gains during rotation
Reduce total altcoin exposure if BTC dominance starts rising
Strategy 2: BTC Dominance Breakout/Breakdown
How it works: Trade the BTC dominance chart itself as a signal for portfolio allocation.
Rules:
BTC dominance breaks below support → Increase altcoin allocation to 40-60% of portfolio
BTC dominance bounces off support → Reduce altcoin exposure to 20-30%
BTC dominance breaks above resistance → Move to 70%+ BTC or stablecoins
This strategy doesn't require picking individual altcoins — you can use a diversified basket of top 10 altcoins and still capture the rotation premium.
Strategy 3: ETH/BTC Confirmation System
How it works: Use ETH/BTC as a leading signal for altcoin allocation decisions.
Rules:
ETH/BTC above 200-day MA and rising → Altcoin-favorable environment
ETH/BTC below 200-day MA and falling → BTC-dominant, reduce altcoin exposure
ETH/BTC at key support with bullish divergence on RSI → Contrarian altcoin accumulation
Altcoin season is a structural phase within the crypto market cycle where capital rotates from Bitcoin into altcoins. It's identifiable through five key indicators: BTC dominance, ETH/BTC ratio, Total3 chart, the Altcoin Season Index, and sector rotation patterns.
The key principles:
Altcoin season follows a predictable rotation sequence: Layer 1s → DeFi → L2s → Narratives → Micro-caps
On-chain metrics (stablecoin flows, wallet growth, smart money positioning) confirm the rotation before price action does
Strict risk management (portfolio pyramid, systematic profit-taking, exit signals) is essential because altcoin seasons end abruptly
Use CoinXSight's Discovery and Whale Tracking modules to identify rotation phases and smart money movements in real time