Weekly Crypto Analysis: BTC, ETH & SOL — Week 26 (Jun 23 – Jun 29, 2026)
BTC consolidates at $64,250 as AI Mood Score ticks to 39. In-depth post-FOMC review, SOL buy signals, and live CoinXSight data for BTC, ETH & SOL heading into Week 26.
AT
Alex ThorneHead of Macro & Market Structure·Jun 22, 2026 · 12 min read · Updated Oct 6
Following the brief relief bounce in Week 25, the cryptocurrency market entered a consolidative phase characterized by lower volatility and declining trading volumes. The total cryptocurrency market capitalization decreased slightly to $2.276 trillion, representing a -1.9% decline from last week's $2.321 trillion. Price action remained highly divided, with Bitcoin losing key short-term levels while select major altcoins like Ethereum (+0.4%) and Solana (+2.8%) showed relative resilience.
Trading volume dropped significantly to $50.17 billion (-15.7% WoW), indicating a lack of strong participation and commitment from both buyers and sellers post-FOMC. Bitcoin dominance declined slightly to 56.16% (-0.45pp WoW) as capital trickled back into major altcoins. Conversely, Ethereum dominance experienced a minor uptick to 9.13% (+0.17pp WoW).
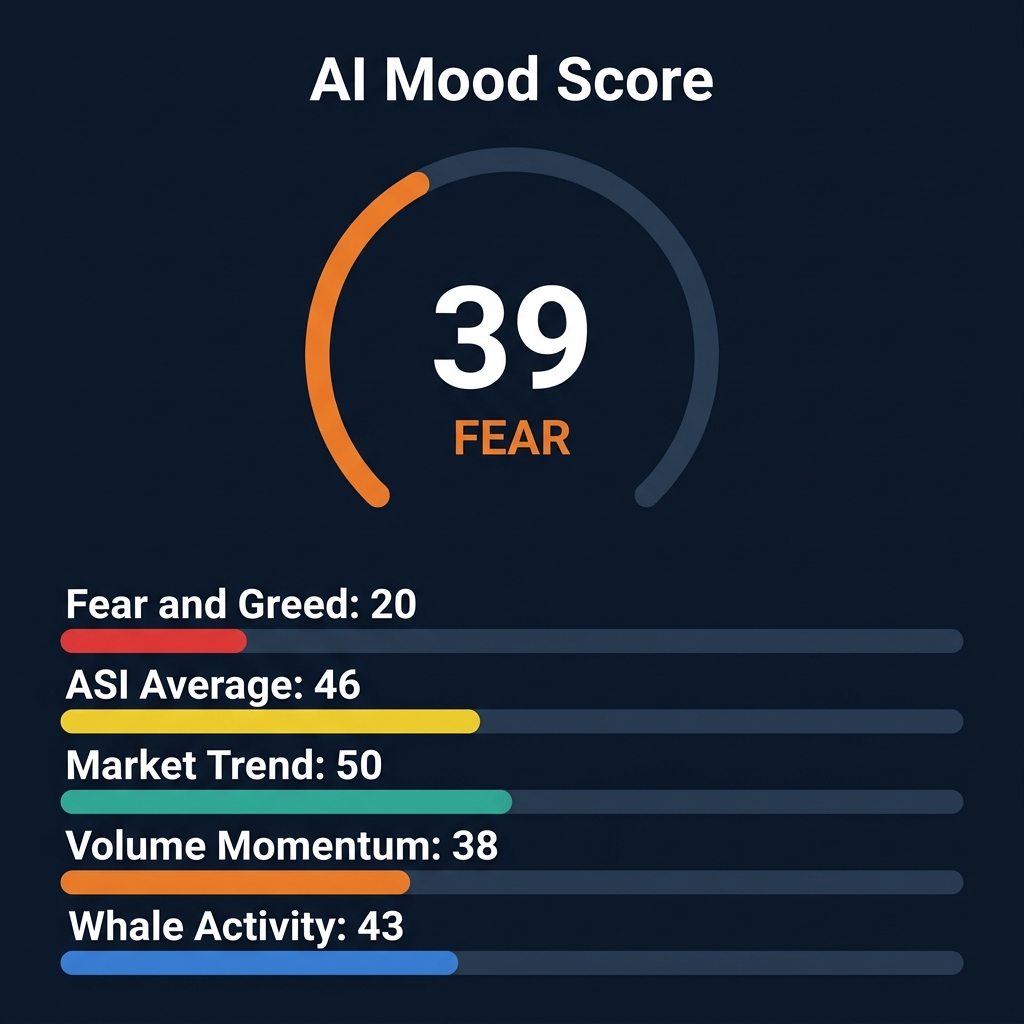
The Fear & Greed Index remained locked in 20 (Extreme Fear), reflecting continued retail anxiety. However, CoinXSight's composite AI Mood Score moved up 1 point to 39/100 (Fear). The index stabilization suggests that while the broader sentiment remains heavily depressed, on-chain indicators and order flow metrics are forming a consolidative base rather than initiating a new liquidation cascade.
Metric
Week 26 Value
Week 25 Value
WoW Change
Total Market Cap
$2.276T
$2.321T
-1.9% ↓
24h Trading Volume
$50.17B
$59.5B
-15.7% ↓
BTC Dominance
56.16%
56.61%
-0.45pp ↓
ETH Dominance
9.13%
8.96%
+0.17pp ↑
Fear & Greed Index
20 (Extreme Fear)
20 (Extreme Fear)
0 (Unchanged)
AI Mood Score
39 (Fear)
38 (Fear)
+1 point ↑
Active Cryptocurrencies
17,413
17,446
-33 ↓
Macro Context: The Post-FOMC Hangover
Rate Pause but Hawkish Tone Delays Relief
The Federal Reserve's June FOMC meeting concluded with a widely expected rate hold at 3.50% – 3.75%. However, Chair Kevin Warsh's inaugural press conference delivered a hawkish surprise that halted the market's recovery plans. While acknowledging that inflation expectations had dropped slightly due to falling oil prices (Brent crude trading near $82), Warsh emphasized that the Fed is in no rush to ease monetary policy.
The updated dot plot projects only one 25bps rate cut in Q4 2026, compared to the two cuts previously priced in by futures markets. Crucially, Warsh refused to rule out a rate hike in September if inflation metrics rebound, keeping the "higher-for-longer" regime firmly in place. This hawkish tilt prevented a broader risk-on rally, forcing risk assets, including cryptocurrencies, back into a defensive posture.
Stablecoin Flow Stagnation
On-chain stablecoin metrics confirm that fresh capital is not yet entering the crypto ecosystem. The combined market capitalization of USDT and USDC remained flat at $187B and $76B respectively, indicating no net new cash inflows. The stablecoin supply ratio (SSR) is currently consolidating at multi-month lows, showing that while purchasing power is high, large players are choosing to stay in cash equivalents rather than deploying capital into BTC or altcoins.
Bitcoin (BTC) — $64,250
Price Action Summary
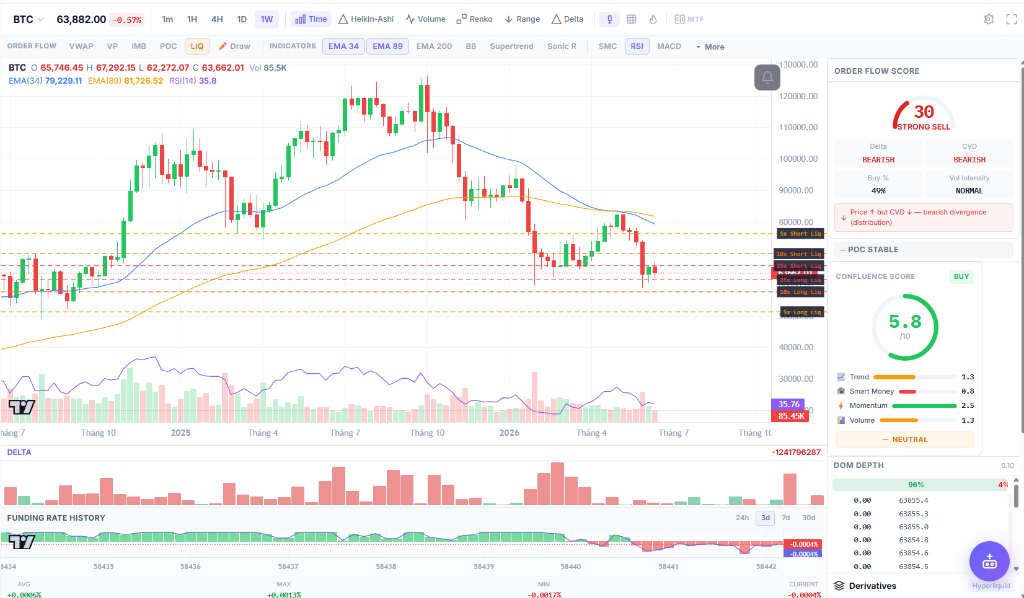
Bitcoin closed the week at $64,250, marking a -2.3% decline from the previous week's close of $65,771. The weekly candle broke below the mid-range of last week's Doji, signaling that sellers retain control of the short-term trend. BTC continues to trade well below its key moving averages, with the 34-day EMA at $79,850 and the 89-day EMA at $81,950.
The Daily RSI sits at 34.2, hovering just above the oversold boundary. The lack of a strong RSI bounce from oversold territory confirms a weak momentum structure. The immediate concern is whether the recent local support at $61,000 – $61,500 will hold a retest.
CoinXSight Deep Alpha Intelligence
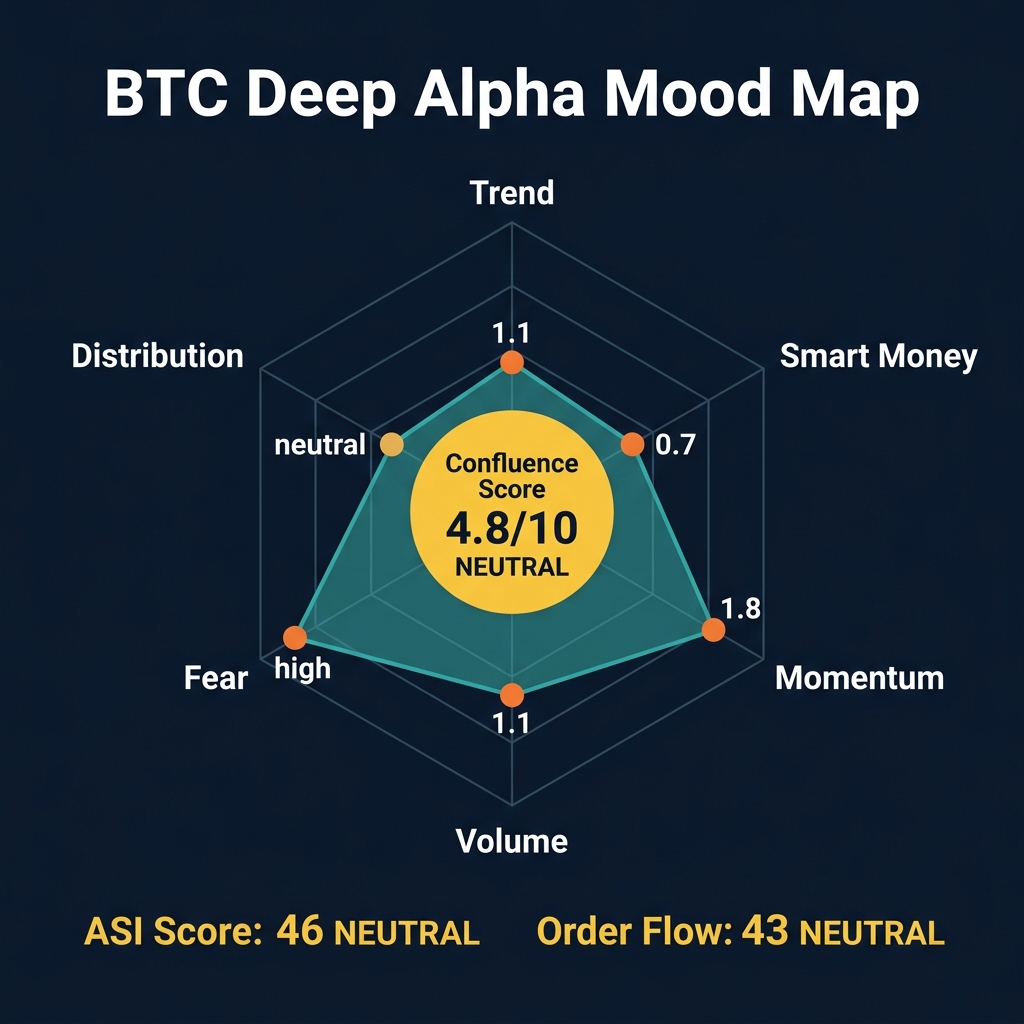
The Deep Alpha module has adjusted its outlook slightly. The ASI (Alpha Signal Index) for BTC fell from 59 to 46 (NEUTRAL), reflecting the loss of short-term momentum. The Confluence Score on the daily timeframe remains at 4.8/10 (NEUTRAL), confirming that the technical indicators are in conflict.
Scenario 1: Order Flow Consolidation (June 18–21, 2026)
During the late-week dip to $63,800, CoinXSight's Order Flow module registered a neutral score of 43. Buy dominance stood at 45.53%, showing a slight sell-side bias. Cumulative Volume Delta (CVD) showed a slight bullish divergence (CVD grinding higher while price drifted lower), suggesting that passive buyers are absorbing spot selling, though aggressive market buying remains absent.
The lack of aggressive buying pressure suggests that while a major sell-off is not imminent, BTC lacks the momentum to break out of its current consolidative range.
Metric
Current Value
Reading
Active Signal
NEUTRAL
ASI Score of 46
Order Flow Score
43
NEUTRAL — Delta Bearish, CVD Bullish
RSI (14)
34.2
Weak Momentum
Confluence Score
4.8/10
NEUTRAL — Technicals in Conflict
Derivatives OI
$6.40B
Strong Long Bias (L/S Ratio 1.577)
Funding Rate
+0.0065%
Positive but Low (Normal Leverage)
BTC Technical Levels
Level
Price Zone
Significance
Resistance 2
$69,000 – $69,500
Major breakdown zone and key weekly resistance
Resistance 1
$65,500 – $66,000
Immediate 4H EMA resistance and former support
Support 1
$61,000 – $61,500
Local double-bottom demand zone
Support 2
$58,000 – $58,500
Major daily support and invalidation level
BTC Verdict
NEUTRAL — leaning defensive. The daily structure remains bearish as long as BTC stays below the $65,500 resistance. While the spot order flow shows signs of passive absorption (CVD divergence), the absence of aggressive buyers limits upside potential. The derivatives market shows healthy funding rates (+0.0065%), meaning the market is not over-leveraged. The most likely path is continued range-bound consolidation between $61,500 and $65,500.
Ethereum (ETH) — $1,730
Price Action Summary
Ethereum closed at $1,730, showing a minor +0.4% gain WoW. ETH has outperformed BTC over the weekly timeframe, establishing a temporary base above $1,650. The daily chart shows a descending triangle structure, with the flat bottom at $1,650 acting as strong support.
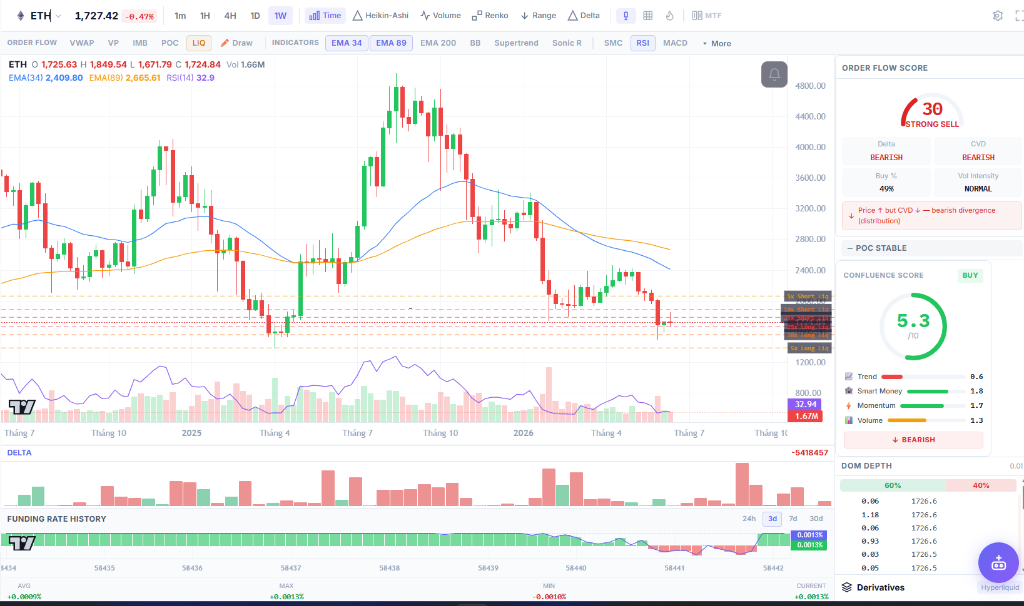
ETH is trading 29% below its 34-day EMA ($2,410) and 35% below its 89-day EMA ($2,650). The RSI has stabilized at 38.8, indicating a temporary pause in the downward momentum.
CoinXSight Deep Alpha Assessment
While the price action is consolidative, the derivatives market suggests that a significant amount of leverage is building up. The long/short ratio has climbed to 2.094, indicating a strong long bias among futures traders. Open interest remains high at $3.83 billion, while the funding rate is positive but low at +0.0052%.
Dimension
Week 26 Score
Week 25 Score
WoW Change
Trend
0.8/10
0.6/10
Stable Bearish
Smart Money
2.2/10
1.8/10
Mild Accumulation
Momentum
2.1/10
1.7/10
Gradual Recovery
Volume
1.1/10
1.3/10
Decreasing Volatility
ASI Score
46
56
Downgraded to NEUTRAL
Order Flow
44
49
NEUTRAL — Normal Intensity
Scenario 2: ETH Derivatives Build-up (June 19–21, 2026)
During the weekend range, ETH open interest expanded by $120M. While the funding rate remained flat at +0.0052%, the long/short ratio spiked to 2.094. This indicates that retail and speculative long positions are aggressively positioning for a breakout.
However, with order flow showing low volume intensity (Score: 44), this heavy long positioning creates a vulnerability: if price breaks below $1,650, it could trigger a localized liquidation cascade.
ETH Verdict
CAUTIOUSLY NEUTRAL. ETH is holding its $1,650 support floor well, but the heavy long bias in the derivatives market (L/S 2.094) without spot volume confirmation is a warning sign. Immediate resistance stands at $1,800 – $1,850. A break below $1,650 would target $1,500, while a break above $1,850 is needed to invalidate the short-term bearish structure.
Solana (SOL) — $73.25
Price Action Summary
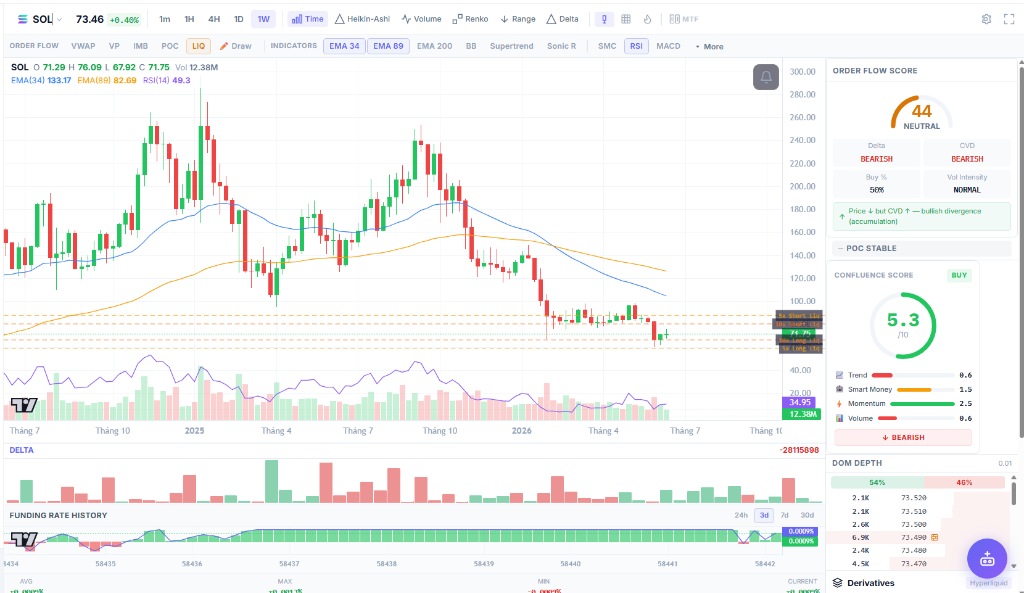
Solana continues to show the strongest relative strength among the Big Three, closing at $73.25, up +2.8% from last week's $71.27. SOL has successfully established a higher low on the daily chart, confirming the bullish hammer candle printed in Week 25.
SOL is trading 31% below its 34-day EMA ($104.50) and 41% below its 89-day EMA ($125.10). The RSI has recovered to 42.5, the highest among major assets, signaling a shift in momentum toward the bulls.
CoinXSight Deep Alpha Assessment
Solana's multi-factor profile is the most constructive. The Order Flow Score has maintained a 62 (BUY) rating, with both the Delta and CVD trends pointing upward. This indicates genuine, aggressive buying pressure on the spot market.
Dimension
Week 26 Score
Week 25 Score
WoW Change
Trend
1.2/10
0.6/10
Improving
Smart Money
1.5/10
0.8/10
Accumulation
Momentum
3.8/10
2.5/10
Strongest Recovery
Volume
1.5/10
1.3/10
Increasing Activity
ASI Score
62
45
Upgraded to BUY
Order Flow
62
62
BUY — Bullish Delta/CVD
Scenario 3: SOL Bullish Divergence Confirmation (June 20–22, 2026)
As SOL tested the $71.00 level early Monday, the Order Flow module registered a buy dominance of 50.19% with a clear bullish trend in CVD. Unlike BTC and ETH, which saw declining volume, SOL's volume intensity ticked up. The derivatives market shows a strong long bias with a long/short ratio of 2.598 and funding at +0.0034%.
The combination of spot accumulation (CVD Up) and active long positioning makes SOL the primary candidate for an upward breakout if market conditions stabilize.
SOL Verdict
MILDLY BULLISH. SOL is exhibiting clear relative strength, backed by an ASI Score of 62 (BUY) and consistent spot accumulation. The immediate technical target is $78 – $80. A daily close above $80 would confirm a double-bottom reversal structure. Support at $67 – $69 must hold to maintain this bullish thesis.
Alpha Gems Pipeline — Week 26 Status
The Alpha Gems scanner has recorded an increase in activity, showing 23 active high-confluence signals (up from 10 in Week 25). The pipeline is heavily biased toward LONG setups, indicating that several mid-cap assets are completing bottoming patterns.
The highest confluence setup is RENDER with a score of 65/100 (LONG) on the 4H timeframe, followed closely by SOL at 60/100 (LONG).
Gem
Pattern
Confluence
ASI
Timeframe
Signal
ICP
Double Top
85
33
1H
SHORT
RENDER
Double Bottom
65
41
4H
LONG
SOL
Wyckoff Spring
60
62
1H
LONG
APT
Wyckoff Spring
60
49
1H
LONG
STRAX
Triple Bottom
50
40
4H
LONG
NEXO
Wyckoff Spring
45
38
1D
LONG
XLM
Wyckoff Spring
40
54
4H
LONG
SUI
Wyckoff Spring
35
28
1D
LONG
TAO
Wyckoff Spring
35
41
1H
LONG
Discovery Small-Cap Highlights
The Discovery scanner shows high volatility in the low-cap sector, with several projects outperforming the flat market:
Unipeg (UPEG): Gained +22.6% in 24 hours, trading at $608.48. Showing a momentum score of 74 and a relative strength (RS) score of 100.
DeBox (BOX): Up +24.5% in 24 hours. RSI is heavily overbought at 81.9, with a bullish MACD signal.
Nobody Sausage (NOBODY): Gained +15.0% in 24 hours, trading at $0.00487. The system detected a bullish divergence in RSI (37.5).
AI Mood Score: Under the Hood
The composite AI Mood Score rose slightly to 39/100, remaining in the Fear zone. The minor increase was driven by improvements in the Market Trend component.
Component
Score
Weight
Change from W25
Fear & Greed Index
20
30%
0
ASI Average
46
25%
-1
Market Trend
56
20%
+5
Volume Momentum
40
15%
0
Whale Activity
42
10%
-2
Composite Score
39
100%
+1
The Market Trend score rose to 56, reflecting the consolidative nature of the price action which has allowed short-term moving averages to flatten. However, Whale Activity declined slightly to 42, indicating that large holders are currently inactive, waiting for a clearer directional signal.
Week 26 Outlook & Key Levels
Scenarios
Base Case (55% probability):
BTC consolidates within the $61,500 – $65,500 range. Lacking a major macro catalyst, trading volume continues to decline, leading to sideways price action. ETH remains bound between $1,650 and $1,800, while SOL trades within $69 – $78.
Bullish Scenario (25% probability):
A sudden influx of spot buying (evidenced by a flip in BTC CVD) drives a breakout above immediate resistance. BTC reclaims $65,500 and targets $69,000 – $69,500. ETH breaks above $1,850 toward $1,950. SOL completes its double-bottom pattern, breaking above $80 toward $88.
Bearish Scenario (20% probability):
Failure to hold the immediate support levels triggers a liquidation event, particularly in the highly-leveraged ETH market. BTC breaks below $61,000 to test $58,000. ETH breaks $1,650, causing a liquidation cascade down to $1,500. SOL falls below $67, retesting the recent wick low at $62 – $63.
What to Watch
BTC $65,500 Resistance: Reclaiming this level on the daily chart is the first step toward invalidating the short-term bearish trend.
BTC $61,000 Support: A break below this level would likely trigger a fast move down to $58,000.
ETH $1,650 Support: Watch for potential liquidation cascades if this level is broken, given the high long/short ratio (2.094).
SOL $80.00 Breakout: A daily close above $80 confirms a double-bottom structure and relative outperformance.
Stablecoin Cap Inflows: Monitor whether USDT/USDC market caps begin to grow, which would signal fresh capital entering the market.
FAQ
Why is SOL showing relative strength compared to BTC and ETH?
Solana is backed by positive spot order flow, with a consistent uptrend in Cumulative Volume Delta (CVD) and an ASI Score of 62 (BUY). Unlike ETH, which is burdened by heavy derivatives leverage without spot volume, SOL's price recovery is supported by spot accumulation.
What does the high Long/Short ratio on ETH mean?
A Long/Short ratio of 2.094 indicates that futures traders are heavily biased toward long positions. While this shows optimism, it also makes ETH vulnerable to a "long squeeze" if the price drops below the key support at $1,650, as those long positions could be forced to liquidate.
Should I trade the active Alpha Gems now?
The return of 23 active gems suggests that bottoming patterns are forming. However, because the broader market remains in a Fear regime (AI Mood Score: 39), these setups carry higher risk. Consider lower position sizes and strict stop-losses.
How to Use This Analysis on CoinXSight
To apply these insights in your trading, follow these steps on the CoinXSight platform:
Open the Deep Alpha dashboard and verify the upgraded ASI score for SOL (62/100 – BUY) and the neutral reading for BTC (46/100).
Check the Order Flow module to monitor the live CVD trends. Look for any change in BTC buy dominance (currently 45.53%).
Navigate to the Alpha Hunter panel to track the 23 active signals. Focus on the high-confluence setups like RENDER (65/100) and SOL (60/100).
Set price alerts at key breakout and breakdown levels: BTC ($65,500 and $61,000), ETH ($1,850 and $1,650), and SOL ($80.00 and $69.00).
Disclaimer: This analysis is for educational purposes only. Cryptocurrency trading carries a high level of risk, and you may lose all of your capital. Always use risk management tools and conduct your own research before entering any trades.
Head of Macro & Market Structure·Global Macro Desk
Former institutional FX and macro derivative analyst. Specializes in global liquidity cycles, central bank balance sheets, and crypto market microstructure.
QUANTITATIVE SUITE // DEEP ALPHA ENGINEACTIVE
BTC/USDT // LIVE SCANNER
CONFLUENCE 28
LIVE SPOT PRICE$82,820.01NO_TRADE
TP2
$87,960.97
+7.17%
TP1
$84,431.71
+2.87%
ENTRY
$82,078.87
ZONE
SL
$80,902.44
-1.43%
Auto-detect Order Blocks, Fair Value Gaps and risk-adjusted DCA ladders in < 5s.
Master risk management for crypto trading. Learn position sizing formulas, stop-loss strategies, and how CoinXSight's Portfolio module tracks your risk…