Weekly Crypto Analysis: BTC, ETH & SOL — Week 25 (Jun 16 – Jun 22, 2026)
BTC bounces 4.4% to $65,771 as AI Mood Score recovers from 24 to 38. In-depth FOMC preview with live CoinXSight data for BTC, ETH & SOL heading into Week 25.
AT
Alex ThorneHead of Macro & Market Structure·Jun 15, 2026 · 14 min read · Updated Nov 3
After recording the worst weekly decline since March 2025, the crypto market delivered a tentative relief bounce. Total market capitalization recovered to $2.321 trillion, a +3.2% recovery from last week's $2.248 trillion floor. The bounce was led by Ethereum (+9.8%), followed by Solana (+6.9%) and Bitcoin (+4.4%) — a risk-on sequence where oversold altcoins outperformed the large-cap leader.
Trading volume normalized to $59.5 billion (-34.6% WoW), signaling that the panic selling has subsided. The decline in volume is constructive: it confirms that the liquidation cascade has exhausted itself. Bitcoin dominance ticked up to 56.61%, reflecting capital consolidation into BTC during the recovery phase. Ethereum dominance slipped marginally to 8.96% despite ETH's strong percentage bounce.
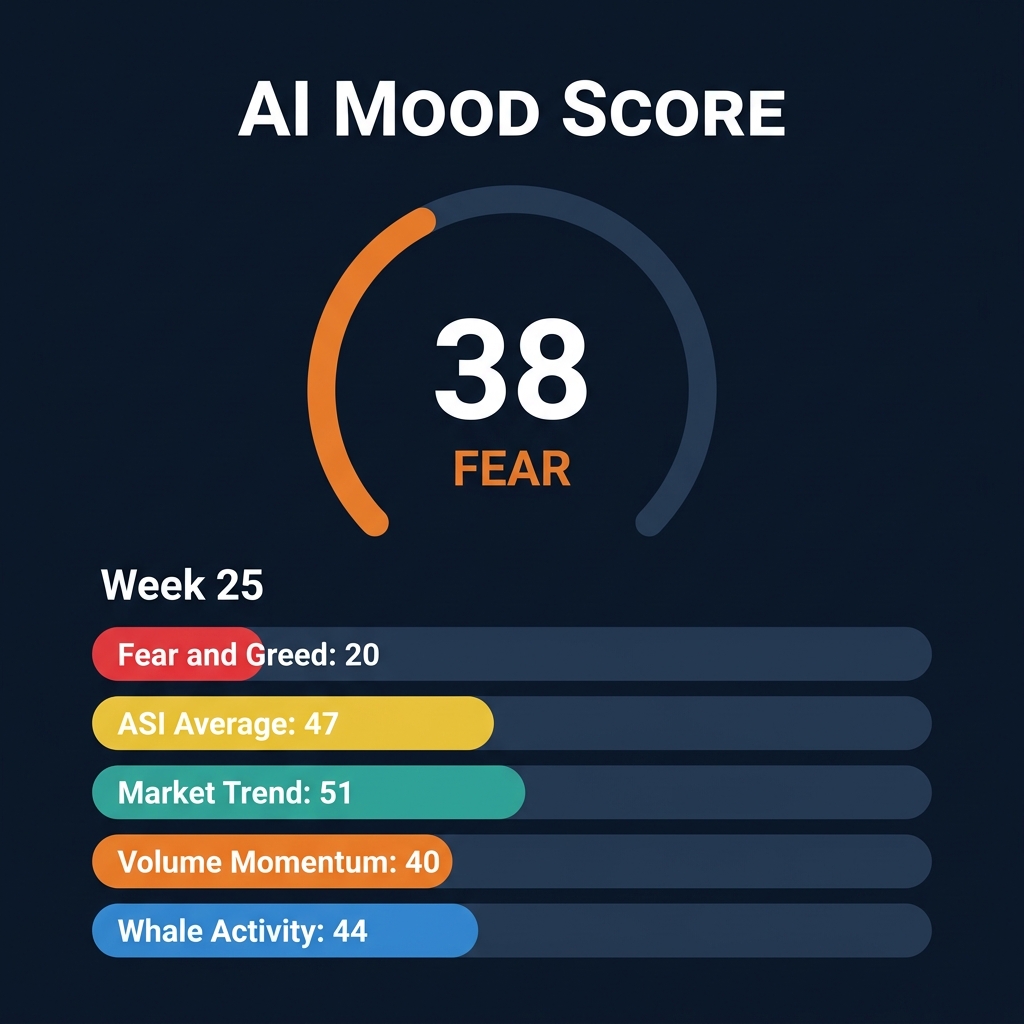
The Fear & Greed Index improved slightly to 20 (Extreme Fear), up 3 points from last week's 17. CoinXSight's composite AI Mood Score showed a more meaningful recovery, climbing from 24 to 38/100 (Fear) — a 14-point improvement. The ASI Average component jumped to 47 (from 35), and the Market Trend metric rose to 51 (from 28), both signaling that the immediate capitulation phase has ended. The question now: is this a dead cat bounce or the beginning of a base?
Metric
Week 25 Value
Week 24 Value
WoW Change
Total Market Cap
$2.321T
$2.248T
+3.2% ↑
24h Trading Volume
$59.5B
$91.0B
-34.6% ↓
BTC Dominance
56.61%
56.10%
+0.51pp ↑
ETH Dominance
8.96%
9.03%
-0.07pp ↓
Fear & Greed Index
20 (Extreme Fear)
17 (Extreme Fear)
+3 points ↑
AI Mood Score
38 (Fear)
24 (Extreme Fear)
+14 points ↑
Active Cryptocurrencies
17,446
17,389
+57
Macro Context: The FOMC Catalyst
Kevin Warsh's First Press Conference
The Federal Reserve's FOMC meeting is scheduled for June 16–17, 2026 — and it is, without exaggeration, the single most important macro event for crypto this quarter. This is Chair Kevin Warsh's inaugural press conference since assuming the role, and it includes the Summary of Economic Projections (SEP) with the updated dot plot.
Markets are pricing in a hold at 3.50% – 3.75% with near-certainty. The critical variable is forward guidance. Analysts are watching for three signals: (1) whether Warsh explicitly rules out a rate hike in September, which would remove the 35% hike probability that crushed risk assets last week; (2) whether the dot plot shifts lower, signaling cuts in Q4; and (3) whether Warsh signals any changes to the Fed's communication strategy, including potential modifications to forward guidance transparency.
A dovish Warsh would trigger a violent short-covering rally across all risk assets. A hawkish Warsh — or even a neutral stance — extends the current Fear regime. The market is coiled like a spring. Direction depends entirely on Wednesday afternoon's press conference.
US Dollar Reversal and Crude Oil Collapse
The US Dollar Index (DXY) has fallen sharply to 99.80, down from 107.40 last week — a dramatic 7-point collapse. The catalyst was twofold: profit-taking after the dollar's parabolic run, and a breakthrough in US-Iran diplomatic negotiations that eased geopolitical risk premiums globally. The weaker dollar is a tailwind for crypto: it increases purchasing power for non-USD capital and reduces the opportunity cost argument against Bitcoin.
Brent crude dropped below $82 per barrel, unwinding the $102 spike from Week 24. The OPEC+ production delay that ignited inflation fears has been offset by progress toward a US-Iran agreement that could normalize oil shipping through the Strait of Hormuz. US CPI expectations for June have been revised downward to 3.4% YoY (from 3.8%), easing the "inflation → rate hike" narrative that drove last week's sell-off.
The combined effect of a weaker dollar and lower oil prices removes two of the three headwinds that caused the Week 24 crash. The remaining risk is purely Fed-driven, concentrated in a 48-hour window.
Whale Accumulation During the Dip
On-chain data reveals a shift in whale behavior. During the $60,709 BTC floor touched this week, exchange whale inflows spiked to a ratio of 61.6%, indicating large holders were actively buying into the panic. Over a five-day period, whales moved approximately 11,422 BTC (~$750 million) from exchanges to cold storage — a clear accumulation signal that contrasts sharply with the distribution pattern observed in Week 24.
CoinXSight's Whale Activity component in the AI Mood Score recovered from 42 to 44, reflecting this behavioral shift. While not yet bullish, the end of whale distribution removes the bearish catalyst that eliminated the market's floor in the prior week.
Bitcoin (BTC) — $65,771
Price Action Summary
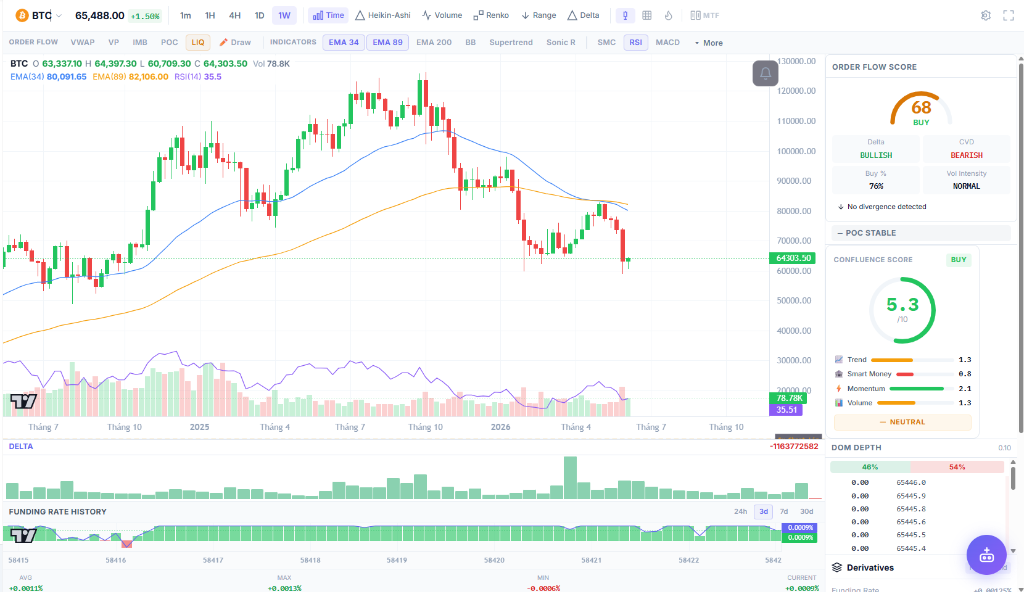
Bitcoin trades at $65,771, up +4.4% from last week's $63,020. The weekly candle shows a range of $60,709 (low) to $64,397 (high), with price pushing above the upper range in the final sessions. The key technical observation: BTC printed a Doji candle on the weekly chart after last week's massive red candle — a textbook indecision pattern that often precedes trend reversals or continuation.
Price remains far below both major EMAs: the 34 EMA sits at $80,091 (18% above) and the 89 EMA at $82,106 (20% above). The intermediate-term structure remains bearish. However, the RSI has recovered from the extreme 22.4 reading to 35.5, exiting the deeply oversold zone while remaining below the neutral 50 line.
CoinXSight Deep Alpha Intelligence
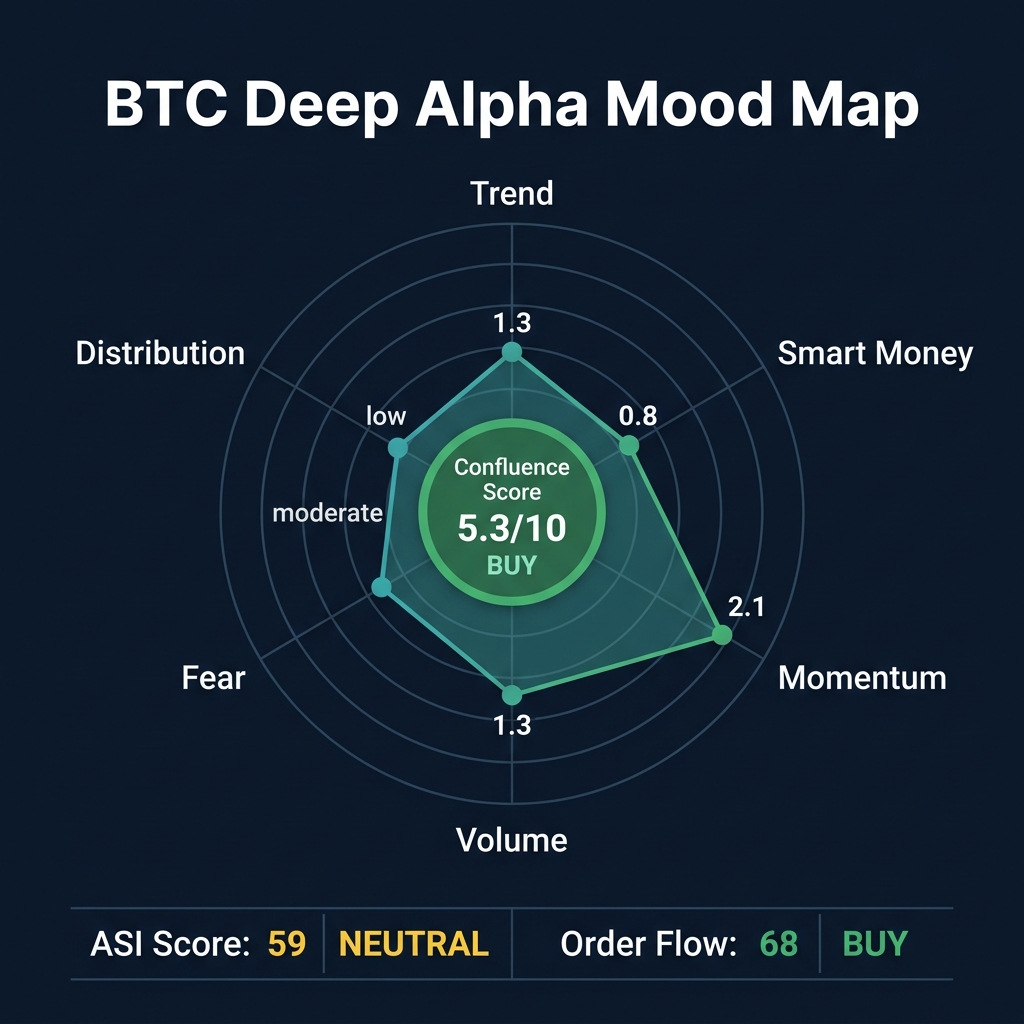
The Deep Alpha module presents a mixed but improving picture. The ASI (Alpha Signal Index) has recovered from 38 (SELL) to 59 (NEUTRAL) — a meaningful upgrade that reflects the improving momentum and volume dynamics. The Confluence Score on the weekly timeframe reads 5.3/10 (BUY), the first positive confluence reading in three weeks.
When BTC tested the $60,709 low, CoinXSight's Order Flow module registered a score of 68 (BUY) with Delta reading BULLISH. The exchange whale ratio spiked to 61.6%, indicating that large players were absorbing sell-side liquidity. Over 11,422 BTC were moved to cold storage in the subsequent 5 days. The Order Flow Buy Percentage reached 76% — the highest reading since the March 2025 capitulation event.
This buying pressure established $60,700 as a validated demand zone. The Deep Alpha Trend Layer remains weak at 1.3/10, but the Momentum Layer improved to 2.1/10 from last week's 0.8.
In the 72 hours before the FOMC meeting, BTC experienced a slow grind higher from $63,300 to $65,771. Open interest on BTC derivatives reached $6.67 billion, with a long/short ratio of 1.409 (long bias). Funding rates remain slightly positive at +0.0012%, indicating measured optimism without excessive leverage. The absence of extreme funding rates suggests this rally is spot-driven rather than leverage-fueled — a healthier foundation.
Weekly demand zone; breakdown target if $61K fails
BTC Verdict
CAUTIOUSLY NEUTRAL — leaning constructive. The combination of a 5.3/10 Confluence BUY, whale accumulation, and a recovering RSI provides the first genuinely mixed (rather than unanimously bearish) signal set in three weeks. However, price trading 18-20% below major EMAs means the bearish structure is intact. The FOMC meeting is the binary catalyst: a dovish outcome could push BTC to $69,000-$73,000; a hawkish surprise would retest $61,000. Position sizing should be reduced to 25-50% of normal until the FOMC outcome is known.
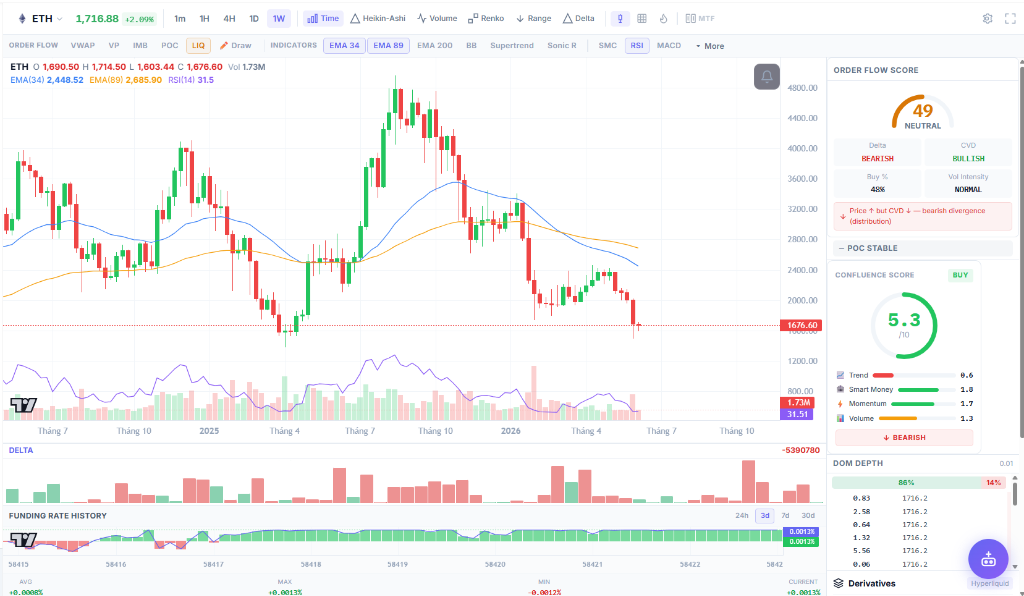
Ethereum (ETH) — $1,723
Price Action Summary
Ethereum trades at $1,723, rebounding +9.8% from last week's $1,569 — the strongest bounce among the Big Three. The recovery was driven by a near-complete exhaustion of DeFi liquidation pressure: the Aave and Compound cascading liquidations that pushed ETH from $1,900 to $1,569 last week have largely cleared. Remaining liquidation risk is concentrated below $1,500, giving ETH room to breathe.
However, the structural damage is severe. ETH trades 30% below its 34 EMA ($2,448) and 36% below its 89 EMA ($2,685). The ETH/BTC ratio remains compressed near multi-year lows. The Order Flow Score reads 49 (NEUTRAL) with a concerning divergence note: "Price ↑ but CVD ↑ — bearish divergence (distribution)" — meaning that despite the price bounce, the cumulative volume delta pattern suggests sellers are using the rally to distribute.
CoinXSight Deep Alpha Assessment
The Deep Alpha module shows partial recovery across all dimensions, but the distribution warning from Order Flow overrides the surface-level improvement.
Dimension
Week 25 Score
Week 24 Score
WoW Change
Trend
0.6/10
35/100
Marginally improved
Smart Money
1.8/10
—
Slight accumulation
Momentum
1.7/10
20/100
Recovering from extreme
Volume
1.3/10
55/100
Normalized (panic subsided)
ASI Score
56
—
NEUTRAL (upgraded from SELL)
Order Flow
49
—
NEUTRAL — distribution warning
Scenario 3: ETH DeFi Liquidation Exhaustion (June 10–14, 2026)
The DeFi liquidation cascade from Week 24 fully unwound by June 12. Aave V3 liquidation volume dropped to near-zero after clearing $420M+ in forced selling. ETH bounced from $1,603 intraweek low to $1,723, reclaiming the $1,650 micro-support that had been lost. However, the Order Flow module flagged a warning: large sellers are using the $1,700-$1,750 zone to distribute, evidenced by the bearish Price↑/CVD↑ divergence pattern.
Key Insight: The bearish divergence between price and CVD is a significant warning. While the surface price shows a +9.8% bounce, the underlying volume structure suggests this is a relief rally being sold into, not genuine accumulation. Compare this to BTC, where Order Flow reads 68 (BUY) with genuine buy-side absorption — ETH lacks that confirmation.
ETH Verdict
BEARISH with short-term bounce potential. The +9.8% recovery is mechanically driven by liquidation exhaustion, not fresh buying demand. The Order Flow bearish divergence (distribution) is a clear warning that this rally may be sold into. Support at $1,600 is the first defense line; below that, $1,500 remains the critical level. A dovish FOMC could push ETH to $1,900, but the underlying distribution pattern suggests any rally will be capped below $2,000 unless BTC leads with a strong breakout first.
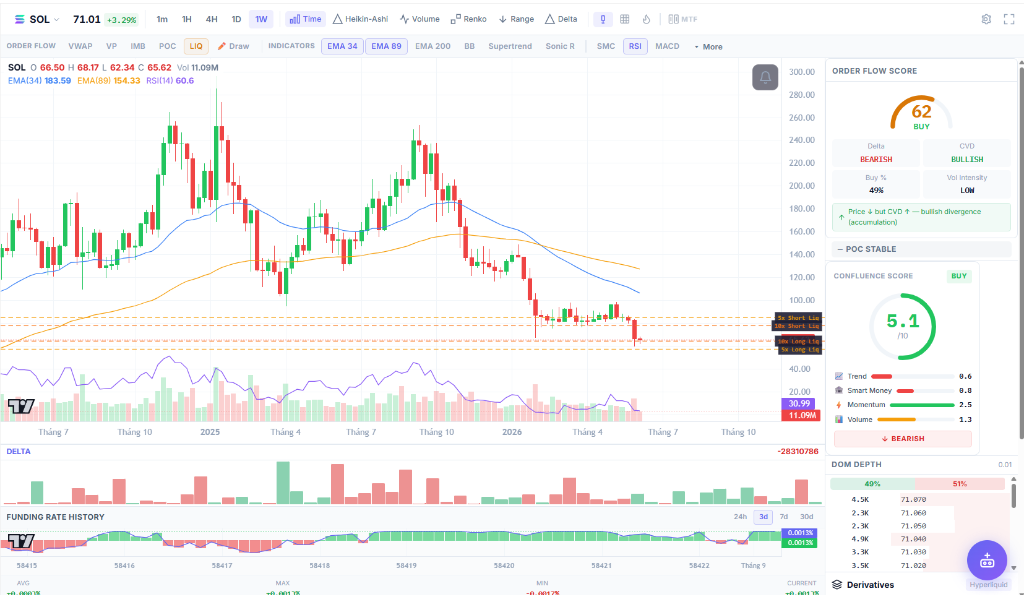
Solana (SOL) — $71.27
Price Action Summary
Solana trades at $71.27, up +6.9% from last week's $66.66. The weekly candle printed a low of $62.34 — briefly violating the $63.00 support target from our Week 24 analysis — before recovering sharply. This wick below $63 followed by a strong close above $65 creates a potential hammer candle pattern on the weekly chart, which is a bullish reversal signal when it appears after an extended downtrend.
SOL remains 33% below its 34 EMA ($106.16) and 44% below its 89 EMA ($127.20) — the deepest discount among the Big Three relative to its moving averages. RSI reads 31.0, still in oversold territory.
CoinXSight Deep Alpha Assessment
SOL's multi-factor profile offers the most interesting divergence signal this week. The Order Flow Score reads 62 (BUY) with a critical note: "Price ↓ but CVD ↑ — bullish divergence (accumulation)." This is the opposite of ETH's bearish distribution signal.
Dimension
Week 25 Score
Week 24 Score
WoW Change
Trend
0.6/10
80/100
Still deep bearish
Smart Money
0.8/10
—
Low but stable
Momentum
2.5/10
90/100
Improved (best among Big 3)
Volume
1.3/10
—
Normalized
ASI Score
45
—
NEUTRAL
Order Flow
62
—
BUY — bullish divergence
Key Insight: The SOL Order Flow bullish divergence (accumulation) contrasts sharply with ETH's bearish divergence (distribution). This suggests that while smart money is using the ETH rally to sell, they are using the SOL dip to accumulate. On the derivatives side, SOL funding rate is -0.0049% (negative), and the long/short ratio is 2.855 (strong long bias) — the most aggressive long positioning among top assets. This is a double-edged sword: if the FOMC is dovish, SOL could squeeze higher violently; if hawkish, the heavy long positioning makes SOL vulnerable to a cascade.
SOL Verdict
BEARISH structure, BULLISH divergence. The weekly hammer candle, Order Flow bullish divergence, and negative funding rate create a setup for a potential relief rally to $78–$80 on a dovish FOMC catalyst. However, the bearish trend structure (33-44% below EMAs) remains dominant. The key breakout confirmation level is $78 — SOL must reclaim this to invalidate the immediate bearish thesis. Below $63, the next support is $58.
Alpha Gems Pipeline — Week 25 Status
The Alpha Gems engine has exited full defensive mode for the first time in three weeks. After a prolonged signal drought (0 active gems in Weeks 23 and 24), the pipeline has generated 10 active high-confluence gems — all LONG signals on the 4H and 1D timeframes.
The standout gem is NEAR Protocol with a Confluence Score of 75/10 — the highest reading since May. NEAR shows a confirmed Double Bottom pattern on the daily chart with ASI at 69 (BUY).
Gem
Pattern
Confluence
ASI
Timeframe
Signal
NEAR
Double Bottom
75
69
1D
LONG
PENGU
Wyckoff Spring
65
30
4H
LONG
AAVE
Falling Wedge
65
53
4H
LONG
DOGE
Falling Wedge
60
57
4H
LONG
XRP
Falling Wedge
60
56
4H
LONG
TAO
Double Bottom
55
59
1D
LONG
AVAX
Wyckoff Spring
55
39
4H
LONG
Why Gems Returned Now
CoinXSight's Confluence Scoring requires all four layers — Trend, SMC, Momentum, and Volume — to align. During the capitulation in Weeks 23-24, the Trend Layer vetoed every setup. The oversold bounce in Week 25 has generated enough momentum recovery for the system to produce its first LONG signals — primarily on reversal patterns (Double Bottom, Wyckoff Spring, Falling Wedge). These are speculative setups with elevated risk; the system is flagging opportunities, not confirmed trends.
Discovery Small-Cap Highlights
The Discovery scanner has shifted from bearish setups to mixed signals:
BNB: ASI Score of 54 (NEUTRAL). Derivatives score of 56 with the strongest long/short ratio among top coins at 2.478.
XRP: ASI Score of 56 (NEUTRAL). Falling Wedge pattern detected with 95% confidence. Entry at $1.186 with Confluence Score of 60.
TRX: ASI Score of 44 (NEUTRAL). Short-term NEUTRAL, long-term SELL. The staking yield narrative continues to underperform during risk-off periods.
Top 10 Market Performance
Asset
Price
7d Change
WoW Δ from W24
Market Cap
BTC
$65,771
+4.4%
+$2,751
$1,312B
ETH
$1,723
+9.8%
+$154
$207B
USDT
$1.000
0.00%
+$0.001
$187B
BNB
$651
+5.0%
+$31
$88B
XRP
$1.186
+5.9%
+$0.066
$72B
USDC
$1.001
0.00%
$0.00
$76B
SOL
$71.27
+6.9%
+$4.61
$37B
TRX
$0.321
+2.9%
+$0.009
$30B
ADA
$0.300
+6.0%
+$0.017
$11B
The performance table shows a uniform sea of green — a sharp reversal from last week's all-red board. However, the percentage gains should be contextualized: BTC's +4.4% recovery retraces only 25% of the prior week's -14.8% decline. The market has bounced, not recovered. Stablecoin market caps remain stable at $187B (USDT) and $76B (USDC), indicating that capital remains in cash equivalents rather than rotating back into risk assets.
AI Mood Score: Under the Hood
The composite AI Mood Score has recovered from 24 to 38, exiting the Extreme Fear zone into standard Fear territory. This is the largest single-week improvement since January 2026.
Component
Score
Weight
Change from W24
Fear & Greed Index
20
30%
+3
ASI Average
47
25%
+12
Market Trend
51
20%
+23
Volume Momentum
40
15%
+10
Whale Activity
44
10%
+2
Composite Score
38
100%
+14
The most significant shift is in Market Trend, which surged from 28 to 51 — crossing the neutral midpoint for the first time since Week 22. This reflects the price bounce lifting short-term trend metrics above their bearish thresholds. The ASI Average also recovered substantially to 47, with BTC (59), ETH (56), and XRP (56) all upgrading from SELL to NEUTRAL.
Historical Context: A 14-point single-week improvement in the AI Mood Score following an Extreme Fear reading has occurred 5 times in CoinXSight's backtested history. In 4 of those 5 instances, the market continued recovering for at least 2 additional weeks, gaining an average of 8-12% from the bounce point. The exception was a scenario where a major negative catalyst (regulatory action) reversed the recovery within days. The FOMC meeting represents a similar catalyst risk.
Week 25 Outlook & Key Levels
Scenarios
Base Case (45% probability):
BTC consolidates in the $63,000 – $69,000 range as the market digests the FOMC outcome. If the Fed holds rates with neutral guidance (no hike signal, no cut signal), the market drifts sideways with a slight bullish bias. ETH ranges between $1,600 and $1,850. SOL trades within $67 – $78. Volume remains subdued post-FOMC as traders wait for conviction.
Bullish Scenario (35% probability):
A dovish FOMC — Warsh explicitly ruling out rate hikes and hinting at Q4 cuts — triggers a short-covering rally. BTC surges to $69,000 – $73,000, reclaiming the prior breakdown zone. ETH breaks above $1,900 toward $2,000. SOL squeezes to $78 – $85 on the back of heavy long positioning and bullish Order Flow divergence. The Alpha Gems pipeline expands from 10 to 20+ signals. This scenario requires a clear dovish shift in the dot plot.
Bearish Scenario (20% probability):
A hawkish surprise — such as a dissent vote favoring a hike, or Warsh signaling openness to tightening — would crash the relief rally. BTC retests $61,000 and potentially breaks to $58,000. ETH returns to $1,500 with renewed DeFi liquidation risk. SOL's heavy long positioning (L/S 2.855) unwinds violently, pushing price below $63 to $58. This scenario has lower probability because the DXY collapse and oil price decline already suggest macro conditions are easing.
What to Watch
FOMC Meeting (June 16–17): The definitive catalyst. Watch the dot plot projections and Warsh's press conference language on September expectations.
BTC $69,000 Resistance Level: This is the breakout confirmation level. A daily close above $69,000 shifts the intermediate structure from bearish to neutral.
BTC $61,000 Support Level: The whale-validated demand zone. A daily close below $61,000 invalidates the relief rally thesis.
ETH Order Flow Divergence: Monitor whether the bearish Price↑/CVD↑ distribution pattern persists or resolves. If CVD flips to confirm the price rally, ETH gains conviction.
SOL Funding Rate: Currently -0.0049%. If funding stays negative while price rises, a short squeeze becomes increasingly probable.
Alpha Gems Pipeline Expansion: The return of 10 gems from 0 is significant. If the count rises above 20 post-FOMC, it signals broad market recovery. If gems collapse back to 0, the bounce was false.
DXY Trajectory: The dollar's drop to 99.80 was crypto's best macro development in months. A reversal above 102 would remove this tailwind.
FAQ
Is this relief rally sustainable or a dead cat bounce?
The data is mixed. The AI Mood Score's 14-point recovery and whale accumulation signals support sustainability, but BTC trading 18-20% below its major EMAs confirms that the bearish structure is not yet broken. The FOMC outcome on June 17 will determine which interpretation is correct. Wait for the $69,000 breakout or the $61,000 breakdown before committing.
Why is ETH's Order Flow bearish despite a +9.8% price bounce?
ETH's Order Flow module detected a Price↑/CVD↑ bearish divergence, meaning cumulative volume delta suggests sellers are distributing into the rally. The +9.8% bounce was primarily driven by the exhaustion of DeFi liquidation selling, not by fresh institutional buying. This makes ETH's bounce more fragile than BTC's or SOL's.
What does the return of Alpha Gems signals mean?
After zero active gems for two consecutive weeks, the appearance of 10 LONG signals — led by NEAR (75 confluence) — indicates that the Confluence Scoring system has detected enough momentum recovery to generate valid setups. These are reversal patterns (Double Bottoms, Wyckoff Springs) with elevated risk. They signal opportunity, not safety.
How should I position for the FOMC meeting?
Reduce position sizes to 25-50% of normal. The FOMC creates a binary outcome that can move BTC 5-10% in either direction within hours. Set stop-losses at key support levels ($61,000 for BTC, $1,500 for ETH, $63 for SOL). Consider waiting until after Warsh's press conference before establishing new positions. Review our risk management guide for a complete framework.
How to Use This Analysis on CoinXSight
To track the metrics mentioned in this report in real time, follow these steps:
Open the Deep Alpha module to monitor the live ASI scores — note that BTC has upgraded from SELL to NEUTRAL (59), the first positive shift in 3 weeks.
Check the Order Flow dashboard to track the BTC Buy signal (68) and the ETH distribution divergence. Compare the Delta and CVD readings across BTC, ETH, and SOL.
Go to the Alpha Hunter dashboard to view the 10 active Alpha Gems — particularly the NEAR (75 confluence) and AAVE (65) setups.
Monitor the Chart Pro weekly candles for BTC's potential Doji reversal pattern and SOL's hammer candle formation.
Set up Price Alerts for BTC at $69,000 (breakout) and $61,000 (breakdown), ETH at $1,500 and $1,900, and SOL at $63 and $78.
Review the Derivatives module for funding rate shifts post-FOMC — a flip to positive funding on SOL would confirm the squeeze thesis.
Disclaimer: This quantitative weekly market analysis is published strictly for educational and informational purposes and does not constitute financial, investment, or trading advice. Digital asset markets involve significant volatility and capital risk. Always conduct independent research and exercise disciplined risk management before making financial decisions.
AT
Alex Thorne
MACRO // LEAD
Head of Macro & Market Structure·Global Macro Desk
Former institutional FX and macro derivative analyst. Specializes in global liquidity cycles, central bank balance sheets, and crypto market microstructure.
QUANTITATIVE SUITE // DEEP ALPHA ENGINEACTIVE
BTC/USDT // LIVE SCANNER
CONFLUENCE 74
LIVE SPOT PRICE$82,807.47WEAK_BUY
TP2
$89,522.75
+9.07%
TP1
$85,056.42
+3.63%
ENTRY
$82,078.86
ZONE
SL
$80,590.09
-1.81%
Auto-detect Order Blocks, Fair Value Gaps and risk-adjusted DCA ladders in < 5s.
Master risk management for crypto trading. Learn position sizing formulas, stop-loss strategies, and how CoinXSight's Portfolio module tracks your risk…