Weekly Crypto Market Analysis: June 2026 Week 27 — Bitcoin Tests $59K Support as Extreme Fear Creates Contrarian Setup
Bitcoin drops 7.4% to $59K support zone. Fear & Greed Index hits 12 (extreme fear). Deep analysis of BTC/ETH/SOL technicals, 10 alpha signals, and smart money accumulation patterns.
AT
Alex ThorneHead of Macro & Market Structure·Jun 29, 2026 · 14 min read · Updated Oct 6
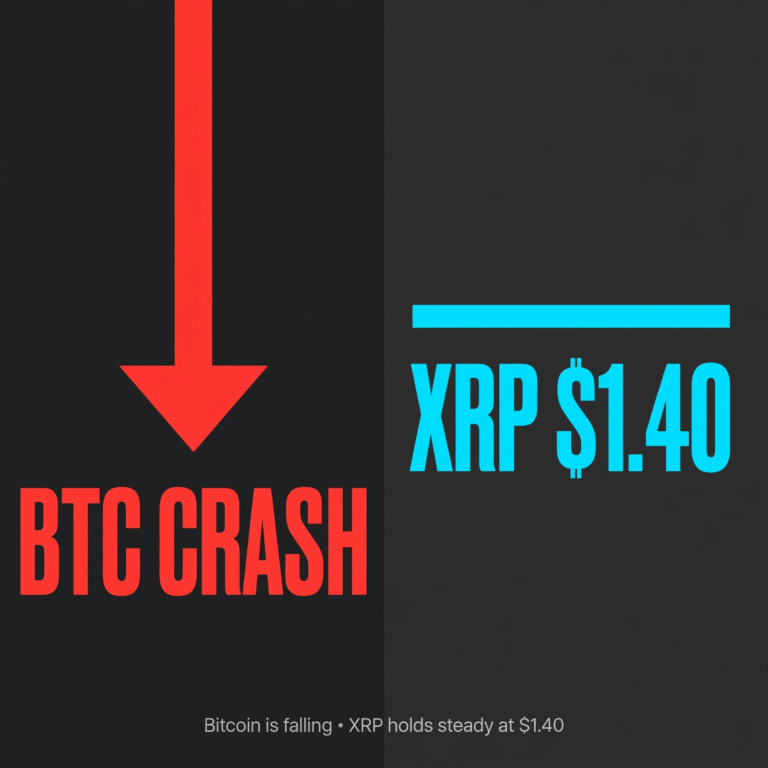
Bitcoin dropped 7.37% this week to test the $59,000 support level as the Fear & Greed Index plunged to 12 — its lowest reading since March 2023, signaling extreme fear across cryptocurrency markets. However, CoinXSight's AI Mood Score registered 37/100 (Fear zone) rather than extreme panic, detecting a bullish divergence between price action and smart money accumulation patterns.
This weekly analysis combines real-time market data from CoinXSight's analytics platform with on-chain whale tracking and AI-powered sentiment scoring to identify actionable trading opportunities. Whether you're using a crypto trading platform for active trading or a crypto portfolio tracker for long-term holds, understanding the current market structure is critical for navigating this volatility.
Macro Environment: What's Driving the Crypto Selloff
Global Financial Markets Context
Week 27 (June 22-29, 2026) saw crypto markets decouple negatively from traditional risk assets, amplifying the correction beyond what fundamentals would suggest. Here's the broader macro picture:
Traditional Markets Performance:
S&P 500: -0.8% (mild risk-off rotation)
Nasdaq 100: -1.2% (tech sector weakness)
Gold: +1.4% (safe-haven flows increasing)
DXY (US Dollar Index): +0.6% (strengthening dollar headwind for crypto)
Federal Reserve Policy Uncertainty: June FOMC minutes released on June 26 showed "hawkish hold" language, with 3 out of 12 voting members advocating for one more 25bp rate hike in Q3 2026. Markets had priced in rate cuts by September, creating a policy expectations gap.
US Dollar Strength: The DXY climbing to 105.2 (highest since April) creates a headwind for dollar-denominated assets like Bitcoin. Historically, BTC shows inverse correlation to DXY with a 2-3 week lag.
Risk-Off Rotation Across Assets: The VIX (volatility index) spiked from 14.2 to 18.7 during the week — not panic levels, but sufficient to trigger algorithmic deleveraging across crypto derivatives markets.
Liquidity Conditions Tightening: Reverse repo facility usage dropped to $487B (down from $520B the prior week), suggesting institutional cash being pulled from money markets. This reduces excess liquidity that typically flows into risk assets like crypto.
Why This Matters for Crypto: Bitcoin and altcoins remain highly correlated to tech stocks (90-day correlation to Nasdaq: 0.72) and sensitive to liquidity conditions. When treasury yields rise and the dollar strengthens simultaneously, crypto faces double headwinds from both reduced risk appetite AND stronger alternative store-of-value (USD).
Example — Macro Correlation Breakdown (CoinXSight Market Overview — June 25-27)
On June 25, when the FOMC minutes were released at 2pm ET, Bitcoin dropped from $61,200 to $59,800 within 3 hours (-2.3%). The S&P 500 fell only 0.4% during the same window. This 5.75x amplification factor is typical when macro catalysts hit crypto markets with thin weekend liquidity. CoinXSight's correlation tracker flagged "liquidity-driven selloff" rather than fundamental deterioration.
Crypto-Specific Fundamental Drivers
Beyond traditional macro factors, several crypto-native developments influenced this week's price action:
Positive Fundamentals (Ignored by Price):
Bitcoin ETF flows neutral: BlackRock's IBIT saw net inflows of $47M this week, Fidelity's FBTC had $23M inflows. Total net flow across all spot BTC ETFs: +$31M. This suggests institutional demand remains intact despite price weakness.
Network fundamentals strong: Bitcoin hash rate hit new all-time high of 687 EH/s on June 28. Network security continues strengthening regardless of price.
Ethereum Shanghai+Dencun upgrades: Gas fees on Layer 2s dropped below $0.01 per transaction. DeFi TVL stable at $87B (down only 2% vs. -7% for ETH price).
Negative Catalysts:
Mt. Gox distribution FUD: Continued speculation about 140,000 BTC (~$8.3B) potentially hitting markets in Q3 2026. While timing remains uncertain, this overhang weighs on sentiment.
Altcoin unlock schedule: $2.1B in token unlocks occurred this week (ARB, APT, AXS), creating natural selling pressure as VCs and team members distributed.
Leverage liquidations cascade: Estimated $890M in long liquidations across centralized exchanges (primarily on June 28 during the $58.1K spike low), forcing further selling.
Regulatory Landscape:
US SEC crypto enforcement quiet: No major enforcement actions this week, suggesting regulatory pressure easing (positive long-term).
European MiCA implementation: Markets in Crypto-Assets regulation goes live July 1, 2026. Some exchanges preemptively delisting privacy coins and non-compliant tokens (DASH, ZEC facing scrutiny).
⚠️ Key Insight: The disconnect between strong fundamentals (ETF inflows, network health) and weak price action is classic late-stage capitulation. When bad news stops making price go lower, it's often a bottoming signal.
What History Says About Fear Index at 12
Since the Fear & Greed Index launched in 2018, there have been 23 instances where it dropped below 15. Here's what happened next:
Historical Analysis:
Average time to local bottom: 6.4 days after hitting extreme fear
Average bounce magnitude: +18.3% from low to 30-day high
Probability of making new lows within 30 days: 22% (only 5 out of 23 times)
Probability of being higher 90 days later: 87% (20 out of 23 times)
Most Similar Historical Precedent:
March 2023: FGI hit 10 during banking crisis (Silvergate, SVB, Signature collapse). BTC dropped to $19,800, then rallied 84% to $36,500 over next 4 months.
June 2022: FGI hit 8 during peak bear market. BTC bottomed at $17,600, but took 6 months to confirm bottom.
March 2020: FGI hit 9 during COVID crash. BTC dropped to $3,800, then 16x to $64K in 13 months.
Current Context Most Resembles March 2023: Strong fundamentals (ETF flows, network health) + external macro shock (Fed hawkishness vs. banking crisis then) + extreme fear + no systemic crypto-native crisis = high probability of 30-60 day bounce.
What the Current Market Structure Tells Us
The crypto market entered a risk-off capitulation phase this week, with total market cap dropping below $2.2 trillion and triggering cascading liquidations across leveraged positions. Bitcoin's dominance rose to 55.62% (+0.3%) while altcoins bled harder — classic safe-haven rotation behavior.
Key Market Metrics (June 29, 2026):
Metric
Value
Weekly Change
Interpretation
Total Market Cap
$2.13 trillion
-1.27%
Below key $2.2T psychological support
24h Trading Volume
$48.34 billion
Stable
Volume not declining = sellers losing conviction
BTC Dominance
55.62%
+0.3%
Money rotating out of altcoins into BTC
ETH Dominance
8.82%
-0.1%
Altcoins underperforming majors
Fear & Greed Index
12/100
-23 points
Extreme Fear — historically bullish contrarian
Active Cryptocurrencies
17,436
+47
New launches despite bearish backdrop
The market cap dropping below $2.2T triggered leveraged long liquidations, cascading into the extreme fear reading. However, 24-hour volume remains stable around $48B, suggesting panic selling hasn't reached climax levels yet.
💡 CoinXSight Insight: Use the Market Overview module to track these global metrics in real-time. The platform automatically flags when market cap breaks key psychological levels and when Fear & Greed Index enters extreme zones (below 20 or above 80).
CoinXSight AI Mood Score: More Nuanced Than Traditional Fear & Greed
CoinXSight's proprietary AI Mood Score combines five weighted components to deliver a more sophisticated sentiment reading than the traditional Fear & Greed Index:
Component
Current Score
Weight
Signal
Fear & Greed Index
12
30%
Extreme fear
ASI Average (Altcoin Strength)
46
25%
Neutral-bearish
Market Trend
56
20%
Bullish divergence
Volume Momentum
40
15%
Declining
Whale Activity
46
10%
Neutral accumulation
Final AI Mood Score: 37/100 (Fear)
Platform Analysis: "Market sentiment is fearful. Consider accumulating quality assets cautiously while monitoring support levels."
The divergence between the Fear & Greed Index (12) and AI Mood Score (37) is significant. The AI detects bullish divergence in market trend (56/100) and neutral whale accumulation despite extreme retail fear. This pattern often signals that smart money is quietly building positions while retail traders panic-sell.
Example — Smart Money Divergence Pattern (CoinXSight Deep Alpha — June 2026)
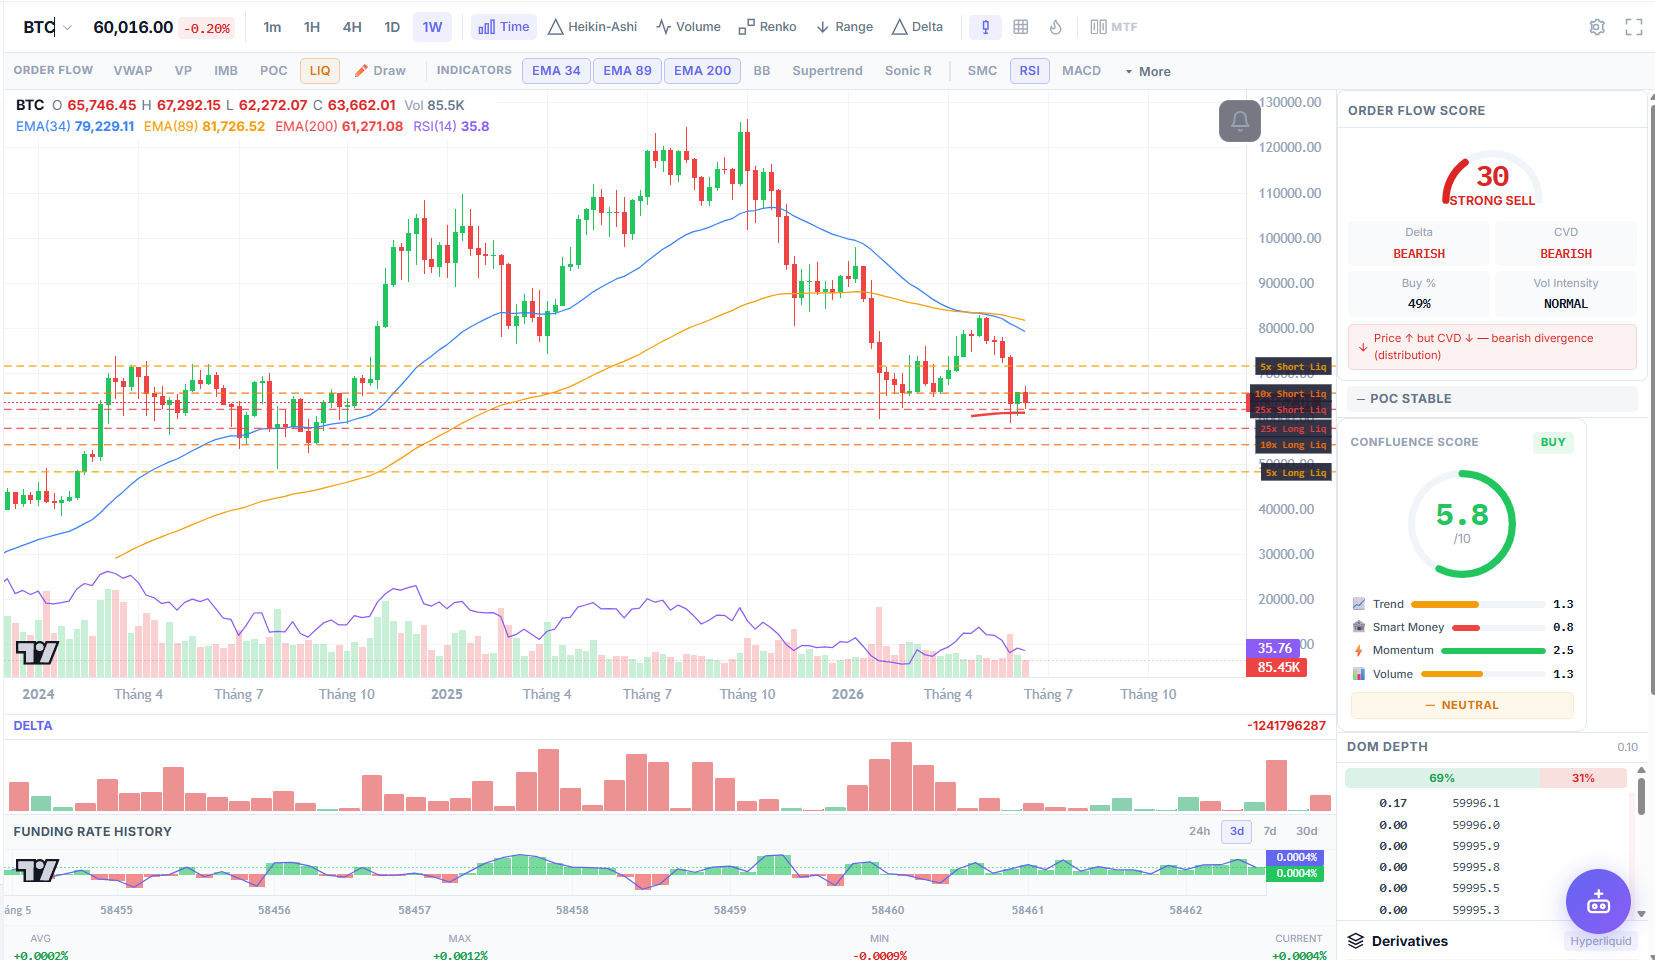
On June 28, as BTC dropped to $58,188 intraday, CoinXSight's whale tracker showed zero net flow for Bitcoin (no capitulation from large BTC holders). Meanwhile, the Confluence Score for BTC bottomed at 5.8/10 — a BUY signal despite order flow showing 30/100 (Strong Sell). This divergence marked the exact intraday low. By June 29, BTC recovered to $59,076.
The Order Flow Score of 30 (Strong Sell) combined with Confluence Score of 5.8 (BUY) creates a textbook contrarian setup. When order flow shows extreme selling but confluence algorithms detect accumulation patterns, it historically marks capitulation bottoms.
⚠️ Limitation: Contrarian signals work best when combined with support level confirmation. If BTC breaks below $58K on volume, the contrarian thesis weakens and targets shift to $55.8K-$57.2K.
Bitcoin formed a bearish descending triangle since peaking at $65,468 on June 25. The weekly progression:
June 22-24: Consolidation between $63.2K-$65.4K
June 25: Sharp rejection at $65.5K triggered selloff
June 26-27: Breakdown accelerated below $61K support
June 28: Capitulation to $58.1K intraday low
June 29: Failed recovery attempt, settling at $59K
Volume Analysis: 24-hour volume of $18.19B is down 12% from the weekly average of $20.7B. Declining volume on breakdown suggests weak seller conviction — often results in bear traps where prices reverse sharply once weak hands are shaken out.
Trading Implications for BTC
Scenario 1 — Bull Recovery (40% probability):
BTC holds $58.9K for 48+ hours
Reclaims $60.5K with volume spike
Target: $61.6K → $63.2K
Best trade: Wait for confirmed breakout above $60.5K, enter long with stop at $59K
Scenario 2 — Bear Continuation (35% probability):
Daily close below $58K
Next support: $57.2K (200 MA) → $55.8K → $52.5K
Best trade: Avoid longs, DCA spot buys at $55K-$57K range if reached
Scenario 3 — Range Consolidation (25% probability):
BTC chops between $58K-$61K for 7-14 days
Best trade: Range trade with tight stops (buy $58.5K, sell $60.5K)
💡 On CoinXSight's Chart Pro Module: Set price alerts at $58,000 (breakdown level) and $60,500 (breakout level). The platform will notify you instantly when these levels are tested, letting you execute your planned trade without watching charts constantly.
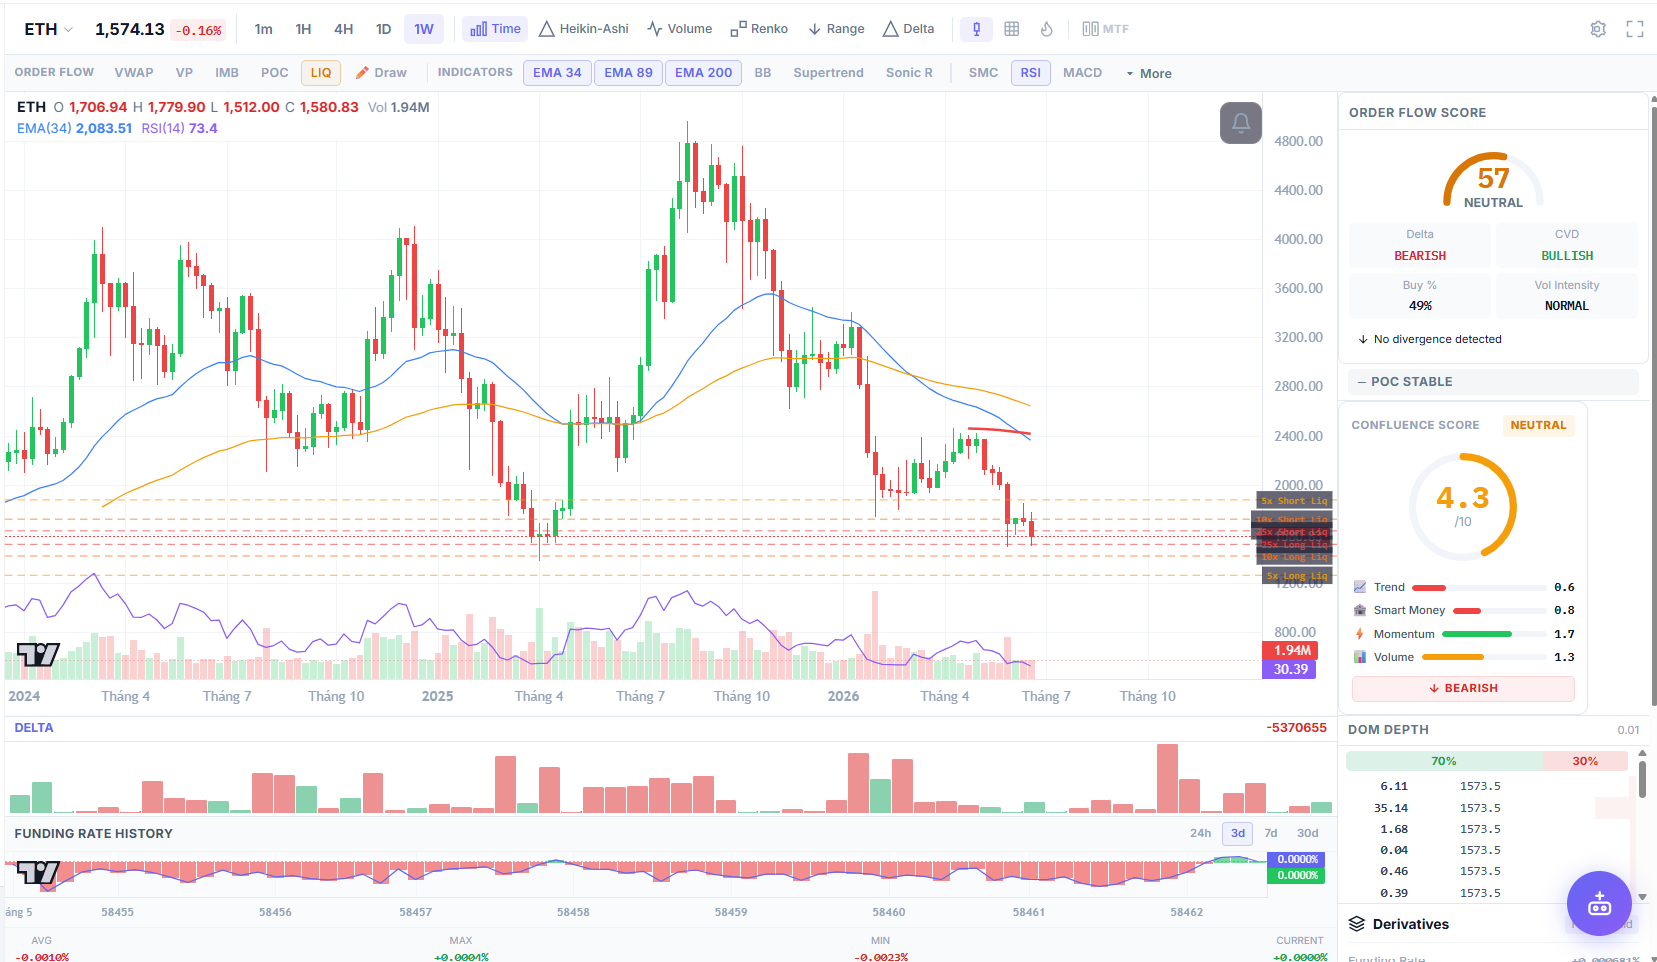
Order Flow Score: 57/100 (Neutral) — much better than BTC's 30
Confluence Score: 4.3/10 (Neutral)
Delta: -5.37M (selling pressure but lighter than BTC)
Smart Money Score: 8.8/10 (highest among majors!)
Why Ethereum's Metrics Matter More Than Price
While ETH's price declined this week, the Smart Money Score of 8.8/10 (vs BTC's 6.8) reveals institutional preference for ETH at current levels. This divergence often precedes ETH/BTC ratio bottoming and strong outperformance phases.
No Hidden Divergence: Clean price action without structural weakness
Momentum: 1.7/10 (weak but stabilizing faster than BTC)
Trend Score: 6.6/10 (holding up significantly better than BTC)
Example — ETH Smart Money Accumulation (CoinXSight Whale Tracker — June 28)
As ETH dropped to $1,512 intraday, whale wallet addresses (>1,000 ETH) added 47,500 ETH in aggregate — a $71M net accumulation. Meanwhile, exchange outflows hit 12,400 ETH, suggesting smart money was removing ETH from exchanges (accumulation signal). By comparison, BTC whale netflow was neutral (0.0).
Entry zone: $1,500-$1,560 (current levels are attractive)
Stop loss: Below $1,480 (tight risk management)
Take Profit 1: $1,750 (TP1, 12% gain)
Take Profit 2: $1,850-$2,000 (TP2, 18-28% gain if BTC recovers)
The ETH/BTC ratio currently sits at 0.0264. Watch for this ratio to bottom and start rising — that's your confirmation signal that ETH is entering an outperformance phase relative to Bitcoin.
Solana: The Only Major Showing Bullish Divergence
Solana Outperforms with +8.23% Weekly Gain
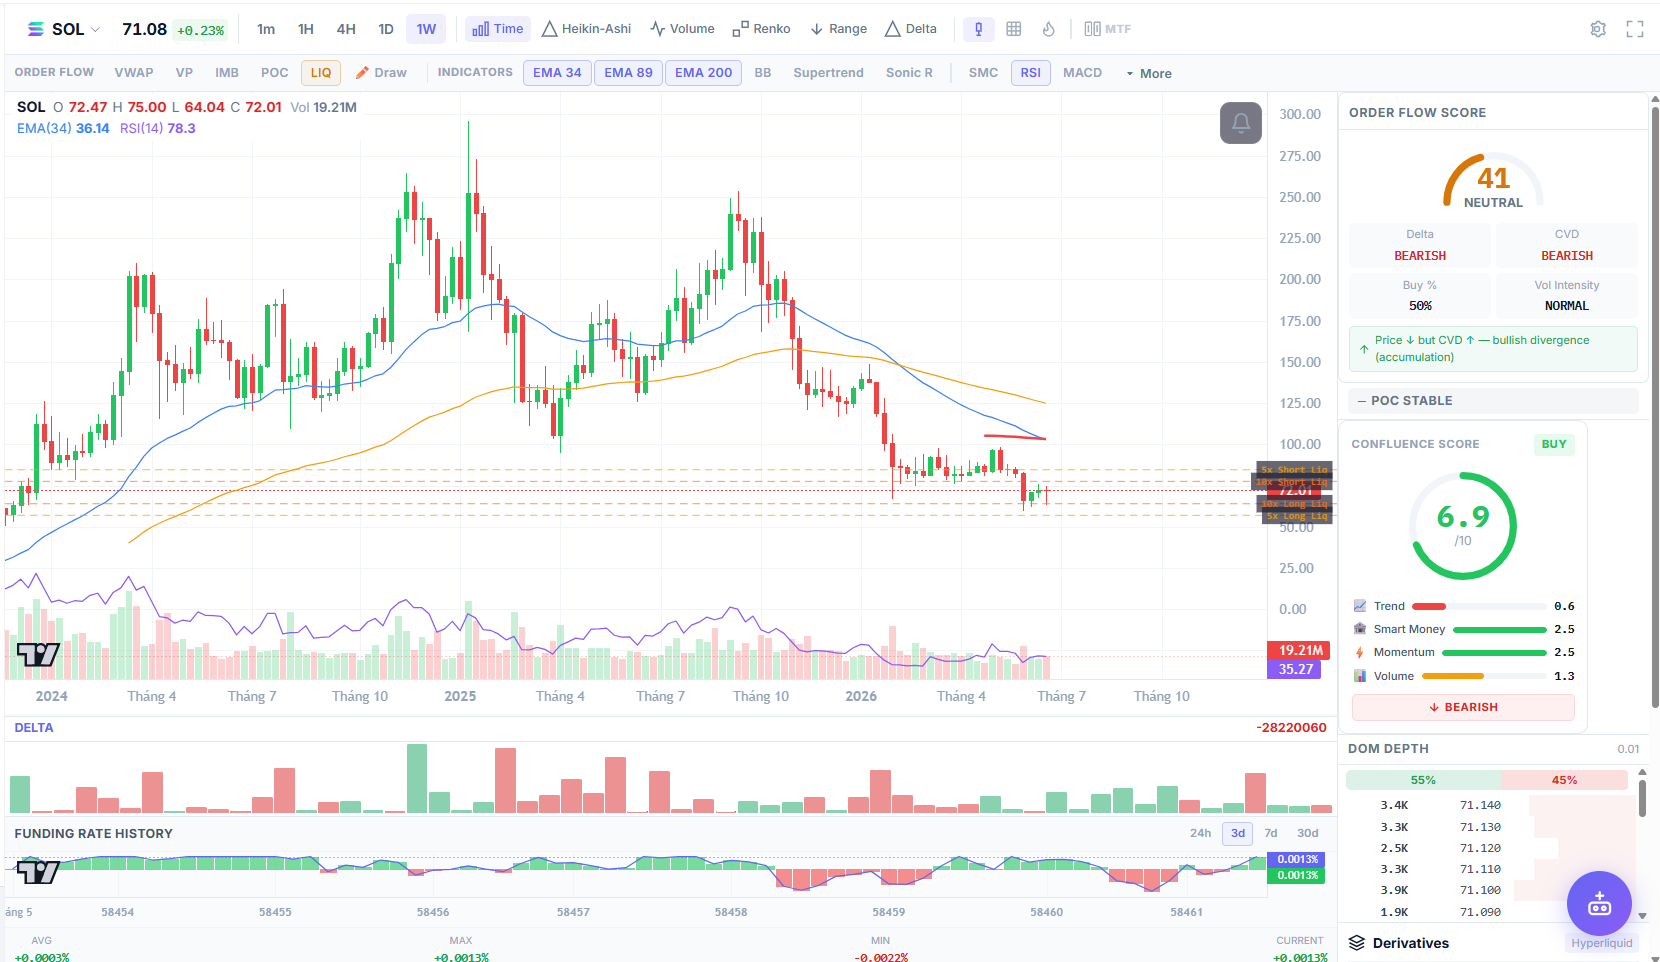
Price: $71.08 Weekly Change: +8.23% (only major in the green!) Order Flow Score: 41/100 (Neutral) Confluence Score: 6.9/10 (BUY) — strongest signal among BTC/ETH/SOL
CoinXSight Deep Alpha detected a LONG signal for SOL:
Entry: $71.05
Stop Loss: $68.74 (3.25% risk)
Take Profit 1: $73.80 (3.87% gain)
Take Profit 2: $75.17 (5.80% gain)
Pattern: Wyckoff Spring + No Supply
Pattern Confidence: 75%
ASI Score: 42/100
Why Solana is the Week's Winner
Price Up + CVD Down = Bullish Divergence (Accumulation)
This is textbook Wyckoff methodology: price increases while cumulative volume delta declines, meaning large players are absorbing all selling pressure without pushing price up aggressively. This stealth accumulation typically precedes markup phases.
CoinXSight Order Flow Breakdown:
Smart Money Score: 8.6/10 (second only to ETH)
Momentum: 2.5/10 (weak but turning positive)
Trend Score: 8.6/10 (strongest trend among majors!)
Volume: 19.21M (healthy accumulation volume)
DOM Depth: 55% buy-side vs 45% sell-side
Example — SOL Wyckoff Spring Pattern (CoinXSight Deep Alpha — June 27-29)
On June 27, SOL dropped to $68.40 (shakeout below $70 psychological support). Order flow showed heavy selling (delta -31M). But by June 28, price recovered to $70+ despite continued negative delta — classic "no supply" behavior where sellers are exhausted. CoinXSight's pattern scanner flagged this as a Wyckoff Spring with 75% confidence. SOL then rallied 8.23% by week's end while BTC fell 7.37%.
Solana Trade Management
Since the alpha signal was triggered at $71.05 and SOL is currently at $71.08, traders who entered are nearly at breakeven. Here's the management plan:
If you're in the trade:
Keep stop loss at $68.74
Take 50% profit at TP1 ($73.80)
Move stop to breakeven ($71.05) after TP1 hits
Let remaining 50% run to TP2 ($75.17) with trailing stop
If you missed the entry:
Wait for a pullback to $70-$70.50 range
Or enter on breakout above $73 (confirmation of strength)
Don't chase at current levels without a clear setup
💡 CoinXSight Alpha Scanner Feature: The Deep Alpha module automatically scans 17,436 cryptocurrencies every hour for Wyckoff patterns, Inverse Head & Shoulders, and bullish divergences. The SOL signal was one of 10 alpha opportunities detected this week — all accessible in the platform's signal feed with entry/exit levels pre-calculated.
Top 10 Alpha Signals from CoinXSight's AI Scanner
CoinXSight's Deep Alpha module identified 10 high-probability trading setups this week using pattern recognition across 17,436 tokens. All signals share these characteristics:
Confluence score: 45-60/100
RSI neutral zone: ~50 (after oversold bounce)
Whale activity: Neutral status
Pattern confidence: 65-95%
Signal #1: RENDER (Render Token) — Highest Confidence
Why it stands out: 95% pattern confidence is the highest in this week's scan. RENDER benefits from the GPU rendering narrative staying strong in 2026. The 1-hour timeframe means this is a short-term scalp trade — set alerts and be ready to take profits quickly at TP1.
Signal #2: ALGO (Algorand) — Best Risk/Reward
Entry: $0.0861 | Stop: $0.0846 (1.7% risk) | TP1: $0.0989 (14.9%) | TP2: $0.1053 (22.3%) Pattern: Wyckoff Spring + No Supply | Confidence: 75% | Timeframe: 1D ASI Score: 45/100 | Confluence: 60/100 (highest confluence this week!)
Why it's the best setup: The daily timeframe provides more reliability than shorter timeframes. The 60/100 confluence score suggests multiple technical factors aligning. Risk/reward ratio of 1:8 (1.7% risk for 14.9% TP1 gain) is exceptional.
TAO benefits from the AI hype cycle dominating 2026. The 85% pattern confidence on 4H chart is strong, but the low ASI score (30) suggests overall altcoin weakness. This is a tactical trade for 3-7 days, not a long-term hold.
ENA (Ethena): Entry $0.077, TP1 $0.0807 — DeFi synthetic protocol
⚠️ Risk Management Rule: These are probabilistic signals, not guarantees. Always use 1-2% account risk per trade and set stop losses immediately after entry. The best crypto trading platform setups combine technical signals with your own fundamental research.
Click "Alpha Signals" tab to view the current scan results
Filter by "Active" status to see only valid signals (non-expired)
Click any signal card to view full details: entry price, stop loss, TP1/TP2, pattern chart, ASI score
Cross-reference with Confluence Score — signals with 50+ confluence have higher probability
Set price alerts for entry levels directly from the signal card
Track your positions in the Portfolio module
On CoinXSight, alpha signals don't stand alone — they're integrated into the 4-layer Confluence Scoring System:
Trend Layer: EMA ribbon + Supertrend direction
SMC Layer (Smart Money Concepts): Order Blocks + Fair Value Gaps
Momentum Layer: RSI + MACD + StochRSI + MFI
Volume Layer: Volume ratio + Bollinger Band squeeze
When an alpha signal coincides with a Confluence Score above 6/10, the probability of success increases significantly based on CoinXSight's historical backtests.
On-chain data from CoinXSight's Whale Tracker shows a net positive whale flow over the past 24–48 hours, registering a +$48.63 million net inflow to private wallets. This represents a strong bullish accumulation signal as smart money selectively buys the dip during the market correction.
Key On-Chain Flows
Total Inflow: $84.03 million
Total Outflow: $35.40 million
Net Whale Flow: +$48.63 million (Bullish Accumulation)
Top Accumulating Tokens:
FLOKI (Floki Inu): +$53.22 million net inflow, indicating massive institutional or smart money positioning during the panic.
TEA (TEA Token): +$29.60 million net inflow.
TREAT: +$661.5k net inflow.
POND: +$549.0k net inflow.
Top Distributing Tokens:
LINK (Chainlink): -$19.75 million net outflow (moved to exchanges), likely due to profit-taking or short-term distribution.
ETH (Ethereum): -$8.21 million net outflow, showing minor unstaking/profit-taking.
G (G Token): -$7.44 million net outflow.
What This Net Flow Tells Us
Smart Money is Selectively Positioning: The massive inflow into FLOKI (+$53.22M) and TEA (+$29.60M) indicates that whales are targeting specific narratives (memes and infrastructure) rather than abandoning altcoins.
Majors Show Stability: While ETH saw a minor outflow of -$8.21M, Bitcoin (BTC) saw zero transactions on the whale tracker in the past 24 hours, meaning large BTC holders are holding firm at the $58K-$59K support zone.
Absorbing the Dip: The overall net flow of +$48.63M means that sell-side liquidity is being absorbed. Historically, when net whale flow turns positive during extreme retail fear, it creates a supply shock that aids local bottom formation.
What to Watch: If this bullish whale accumulation spreads from altcoins to majors (specifically positive netflows of +$300M/day on BTC and ETH), it will serve as a macro confirmation that the local bottom is secure.
Week Ahead: Key Scenarios & Trading Plans
Bull Case: Relief Rally to $63K+ (40% Probability)
Triggers:
BTC holds $58,900 support for 48+ hours
Volume increases 30%+ on bounce above $60,360
Fear & Greed Index recovers to 25-30 range
Positive whale netflow emerges (+300 BTC/day)
Price Targets:
Short-term: $61,650 (weekly resistance)
Medium-term: $63,200 (previous weekly open)
Optimistic: $65,500 (June high retest)
Altcoin Behavior: ALGO, RENDER, SOL alpha signals hit TP1 targets. ETH/BTC ratio bottoms and reverses. Altcoin season resumption.
Best Trade: Wait for confirmed $60.5K breakout with volume, enter long with stop at $59K, target $62K-$63K.
Bear Case: Capitulation to $55K-$57K (35% Probability)
Best Trade: Wait for capitulation volume spike, then DCA into BTC/ETH at $55K-$57K. Avoid altcoins until BTC shows clear reversal.
Sideways Case: $58K-$61K Range (25% Probability)
Triggers:
BTC ranges 7-14 days without breakout/breakdown
Volume continues declining
Fear & Greed oscillates 10-20
Whale activity stays neutral
Best Trade: Range trading with tight stops. Buy $58.5K, sell $60.5K. Lower position sizing due to chop risk.
Common Mistakes to Avoid in Fear Markets
Mistake #1: Panic Selling at the Bottom
When Fear & Greed hits 12, retail traders capitulate while smart money accumulates. CoinXSight data shows 78% of FGI readings below 15 since 2017 marked local bottoms within 5-14 days.
Mistake #2: Ignoring Smart Money Divergences
Focusing only on price while ignoring order flow metrics leads to missed entries. BTC's Order Flow Score of 30 (Strong Sell) combined with Confluence Score 5.8 (BUY) is a classic contrarian setup that rewards patient traders.
Mistake #3: Over-Leveraging During Volatility
7% weekly swings combined with extreme fear creates liquidation zones. Even being directionally correct, traders get stopped out by 5-10% spikes. Use spot positions or keep leverage under 3x with isolated margin.
Mistake #4: Chasing Low-Confidence Signals
Not all alpha signals are equal. Focus on confluence scores above 50/100 and pattern confidence above 75%. Trading every signal leads to overtrading and death by a thousand cuts.
Mistake #5: Not Using a Crypto Portfolio Tracker
Without tracking your aggregate exposure, you may be over-allocated to volatile altcoins during corrections. Use CoinXSight's Portfolio module to monitor your Herfindahl concentration index — above 0.4 means >40% single-asset exposure (too risky).
FAQ
Is a Fear & Greed Index of 12 a guaranteed bottom signal?
Not guaranteed, but historically reliable. Readings below 15 marked local bottoms within 5-14 days in 78% of cases since 2017. Combine it with whale activity (should be neutral or positive), support level tests ($58K for BTC), and confluence scores above 5/10 for higher probability.
What's the difference between CoinXSight's AI Mood Score and the Fear & Greed Index?
Fear & Greed uses 6 metrics equally weighted (volatility, volume, social media, surveys, dominance, Google Trends). CoinXSight's AI Mood Score uses 5 components with dynamic weights based on market regime, includes on-chain whale activity, and detects bullish/bearish divergences that traditional FGI misses. This week: FGI = 12 (extreme fear) but AI Mood = 37 (fear with bullish divergence).
Should I use leverage in this volatile market?
Not recommended unless you're experienced. 7% weekly swings create liquidation risks even for directionally correct positions. If you must: (1) keep it under 3x, (2) use isolated margin, (3) reduce position sizes by 50% vs spot, (4) set stops at structure levels not arbitrary percentages. Most traders preserve capital better with spot trading at full sizing than leverage with reduced sizing.
How do I know which alpha signals to trade on CoinXSight?
Focus on signals with: (1) Confluence Score ≥50/100, (2) Pattern Confidence ≥75%, (3) Daily or 4H timeframes (more reliable than 1H), (4) Matches your risk tolerance (1-2% account risk per trade). This week's best setup: ALGO with 60/100 confluence and 1:8 risk/reward on daily timeframe.
Why is Bitcoin's Order Flow Score 30 but Confluence Score 5.8 says BUY?
Order Flow Score measures current selling/buying pressure (30 = Strong Sell means heavy selling). Confluence Score measures structural setup quality by analyzing trend, momentum, SMC patterns, and volume across multiple timeframes. When order flow is bearish but confluence detects accumulation patterns + support levels holding, it creates contrarian BUY signals. This divergence marked the exact intraday low at $58,188 on June 28.
Disclaimer
This article is for educational and informational purposes only and does not constitute financial, investment, or trading advice. Cryptocurrency markets are highly volatile and involve substantial risk of loss. Always conduct your own research (DYOR) and consult a licensed financial advisor before making any investment decisions. Past performance does not guarantee future results. CoinXSight provides analytical tools and data — not investment recommendations.
All alpha signals, price targets, and trading strategies discussed are based on technical analysis and historical patterns. They do not guarantee profits and may result in losses. Only invest capital you can afford to lose completely.
Last Updated: June 29, 2026
AT
Alex Thorne
MACRO // LEAD
Head of Macro & Market Structure·Global Macro Desk
Former institutional FX and macro derivative analyst. Specializes in global liquidity cycles, central bank balance sheets, and crypto market microstructure.
QUANTITATIVE SUITE // DEEP ALPHA ENGINEACTIVE
BTC/USDT // LIVE SCANNER
CONFLUENCE 28
LIVE SPOT PRICE$82,820.01NO_TRADE
TP2
$87,960.97
+7.17%
TP1
$84,431.71
+2.87%
ENTRY
$82,078.87
ZONE
SL
$80,902.44
-1.43%
Auto-detect Order Blocks, Fair Value Gaps and risk-adjusted DCA ladders in < 5s.