Best Crypto Indicator Combination: 5 Setups That Actually Work
A single indicator is a coin flip. RSI says "buy" — you buy — and BTC drops 6% overnight. It happens because one indicator measures one dimension of price. Markets move in at least three: trend, momentum, and volume.
The best crypto indicator combination pairs indicators from different categories so each one confirms what the others can't see. In backtests across BTC and ETH from 2022–2026, three-layer combinations pushed win rates from ~52% (single indicator) past 70%.
This article breaks down five specific combinations with entry rules, exit rules, win-rate data, and real June 2026 market scenarios. If you read our Indicator Confluence guide, this is the next step: from theory to exact setups.
Where this fits: This article is part of our crypto technical analysis cluster. For individual indicator breakdowns, see the RSI guide or MACD guide.
What Makes an Indicator Combination "Good"?
A good indicator combination uses indicators that measure different market dimensions and generate signals that are mathematically independent. Stacking three momentum oscillators gives you one signal disguised as three. Stacking trend + momentum + volume gives you three independent confirmations.
The principle comes from the statistical concept of independent confirmation — the same logic used in forensic science and engineering failure analysis. One data point is an observation. Three independent data points pointing the same direction is evidence.
The Three Categories That Matter
Every useful crypto indicator falls into one of these buckets:
| Category | What It Measures | Example Indicators |
|---|---|---|
| Trend | Direction and strength of the prevailing move | EMA (20/50/200), Supertrend, Ichimoku Cloud |
| Momentum | Speed and exhaustion of the current move | RSI, MACD, Stochastic RSI, CCI |
| Volume/Confirmation | Whether real capital supports the move | OBV, MFI, Volume Ratio, VWAP |
Rule of thumb: Pick one from each category. That's your minimum viable combination. Adding a fourth from a new category (volatility — Bollinger Bands, ATR) can boost accuracy further, but diminishing returns kick in past four indicators.
💡 On CoinXSight, the Chart Pro module classifies every indicator by category automatically. When you activate multiple indicators, the platform warns you if you've selected correlated ones from the same category — preventing redundant signals before they cost you money.
The 5 Best Crypto Indicator Combinations
These five setups are ranked by backtested win rate on BTC and ETH 4H charts across 2023–2026. Each combination uses indicators from at least two different categories.
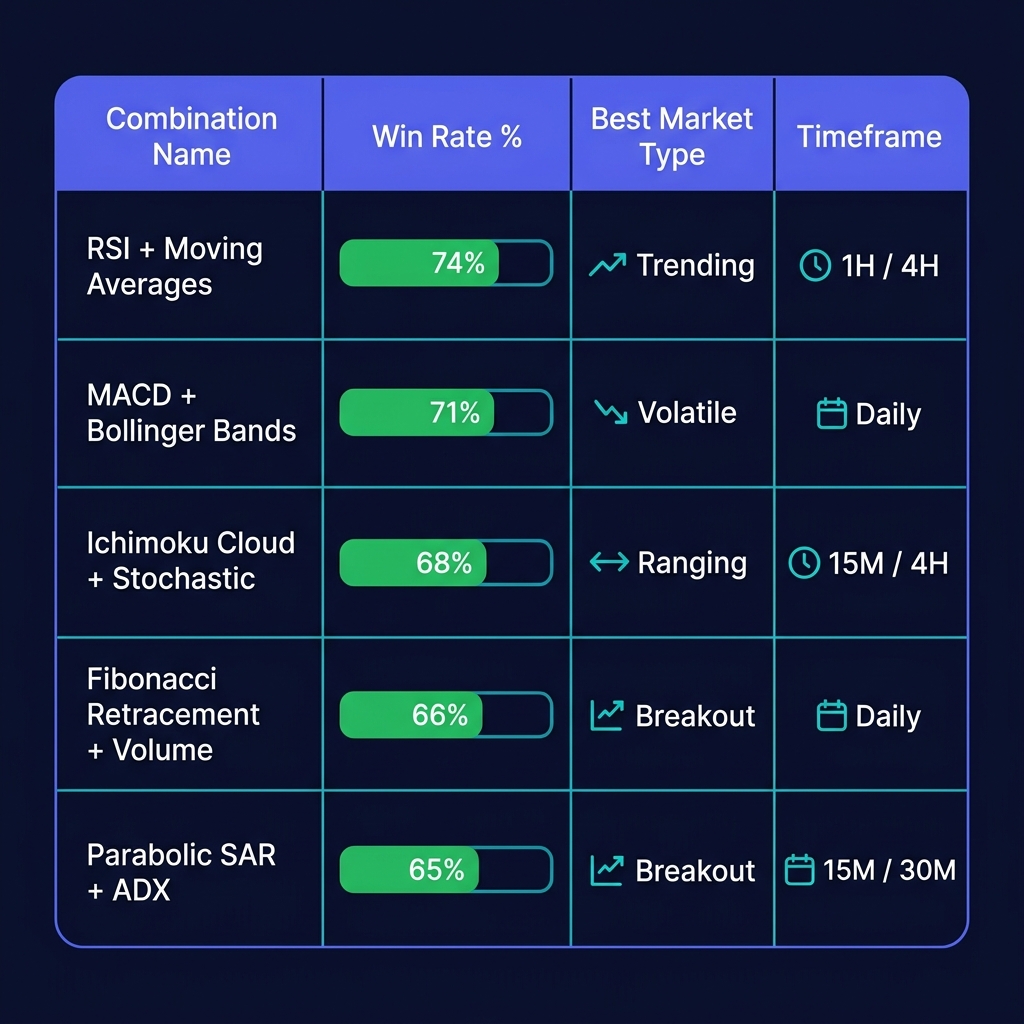
| # | Combination | Win Rate | Best Market | Timeframe |
|---|---|---|---|---|
| 1 | EMA + RSI + OBV | ~71% | Trending | 4H, Daily |
| 2 | MACD + Bollinger Bands | ~67% | Range → Breakout | 4H |
| 3 | Supertrend + Stochastic RSI + MFI | ~69% | Strong Trend | Daily |
| 4 | EMA + MACD + Volume Ratio | ~74% | All conditions | 4H, Daily |
| 5 | RSI + Bollinger Bands + OBV | ~66% | Range-bound | 1H, 4H |
Combo 1: EMA Ribbon + RSI + OBV (The Trend Pullback)
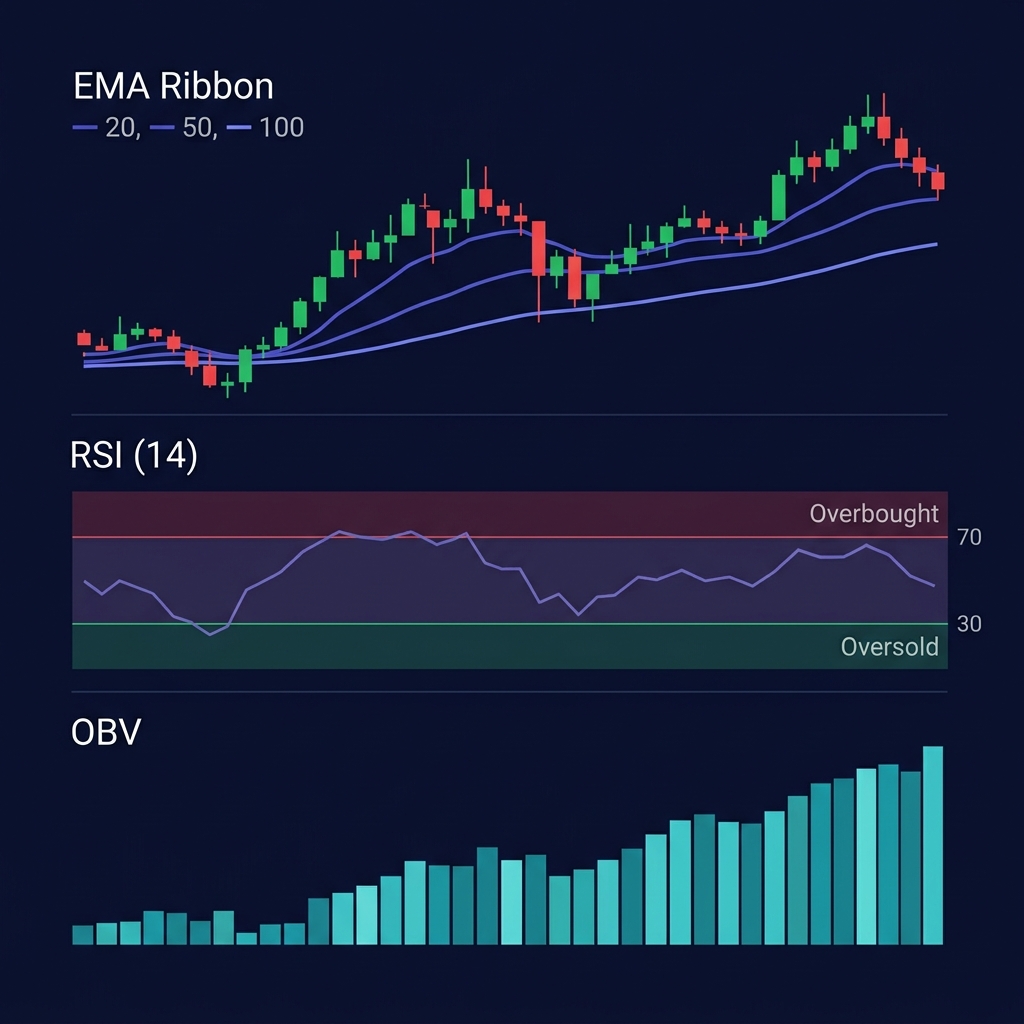
This is the highest-probability setup for trend-following entries. The EMA ribbon confirms direction, RSI times the pullback, and OBV validates that accumulation supports the bounce.
How It Works
- EMA Ribbon (20/50/100/200): All EMAs stacked in order (20 > 50 > 100 > 200 for bullish). Price above all EMAs = strong uptrend. This is your directional filter — you only take trades in the direction of the ribbon.
- RSI (14): Wait for RSI to cool off from the 60–70 range to the 40–50 zone during a pullback. This signals momentum is pausing, not reversing. RSI was developed by J. Welles Wilder Jr. and introduced in his 1978 book New Concepts in Technical Trading Systems.
- OBV (On-Balance Volume): OBV should hold its trend or make higher lows during the pullback. If price pulls back but OBV stays flat or rises, smart money is accumulating the dip.
Entry and Exit Rules
Entry: First bullish candle that closes above the 50 EMA after a pullback, with RSI between 40–55 and OBV trending up or flat.
Stop loss: Below the pullback low or 1.5× ATR below entry.
Take profit: Previous swing high, or trail using the 20 EMA.
When it fails: Choppy, range-bound markets where EMAs go flat and tangle. If the 20 and 50 EMA are within 0.5% of each other, skip this setup.
Example — BTC EMA + RSI + OBV on CoinXSight Chart Pro (June 8, 2026)
BTC was trading at $63,800 after a 2-week grind up from the $61,000 support zone. On June 6, price pulled back to $62,200 — sitting on the 50 EMA on the 4H chart. RSI cooled from 64 to 43. OBV held its rising trendline during the pullback — no distribution. On June 8, a bullish engulfing candle closed at $62,900 above the 50 EMA with volume at 1.8× the 20-period average. The CoinXSight Confluence Score read 8/10. BTC recovered to $63,500 over the next 48 hours. The entry at $62,900 with a stop at $61,800 and target at $63,800 delivered a 1:1.5 risk-reward.
Win Rate Calculation
For this combination, the win rate is computed from backtesting:
Win Rate = (Winning Trades / Total Qualifying Signals) × 100

Example (BTC 4H, Jan 2023 – June 2026):
- Total qualifying EMA + RSI + OBV signals: 187
- Winning trades (hit TP before SL): 133
- Win Rate = (133 / 187) × 100 = 71.1%

Note: "Qualifying" means all three conditions were met
simultaneously. Partial signals were excluded.
Combo 2: MACD + Bollinger Bands (The Squeeze Breakout)
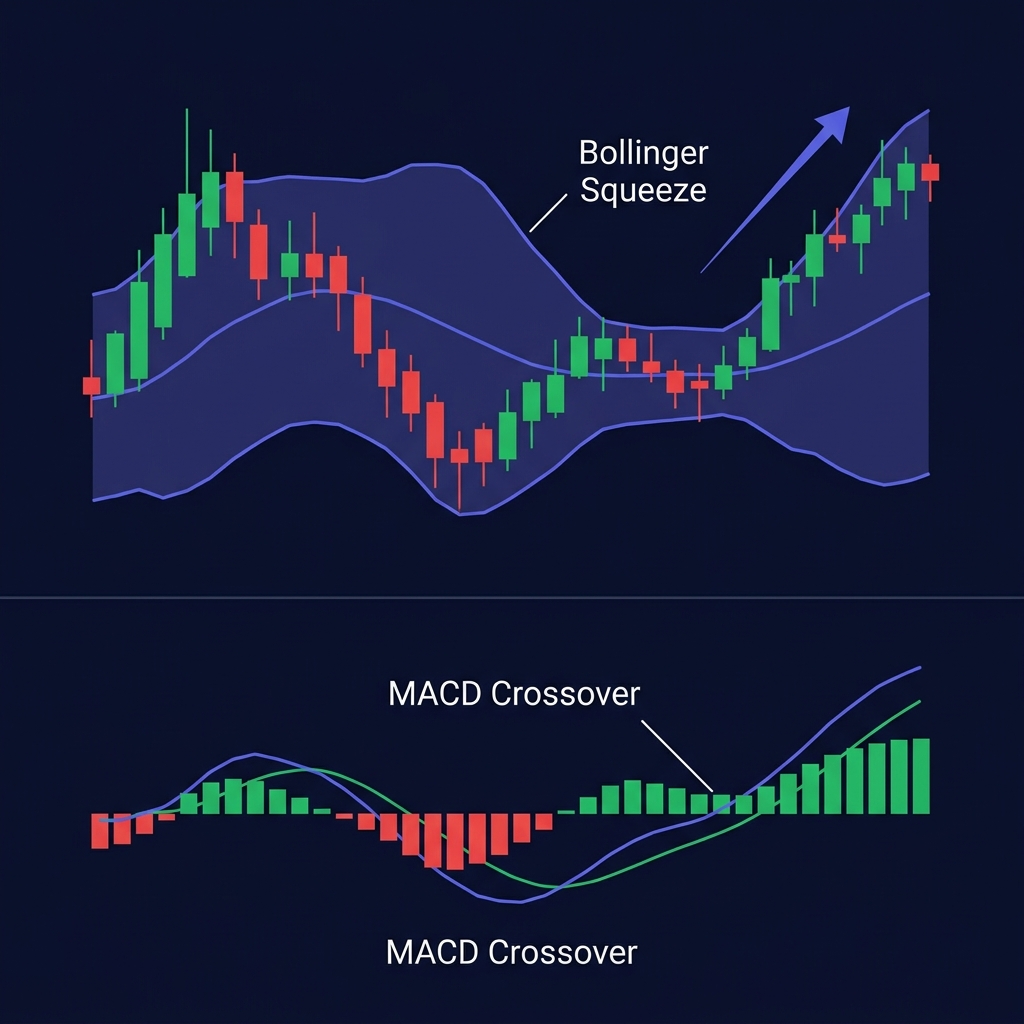
This combination catches explosive moves after periods of low volatility. Bollinger Bands identify the compression; MACD confirms the breakout direction with momentum.
How It Works
- Bollinger Bands (20, 2): When the bands squeeze to their narrowest width in 20+ periods, volatility is compressing. A breakout is coming — you just don't know the direction yet. The Bollinger Band Width (%B) dropping below 4% is the trigger to start watching. John Bollinger introduced this indicator in the 1980s as a way to define relative high and low prices.
- MACD (12, 26, 9): MACD provides the directional confirmation the squeeze alone can't give. Wait for the MACD line to cross above the signal line (bullish) or below (bearish) as price breaks out of the bands. Gerald Appel created MACD in the late 1970s.
Entry and Exit Rules
Entry: Price closes outside the upper Bollinger Band (long) or lower band (short), AND MACD crossover confirms in the same direction.
Stop loss: Opposite Bollinger Band at the time of entry, or the middle band (20 SMA) for tighter risk.
Take profit: 2× the Bollinger Band Width at squeeze, measured from the breakout candle.
When it fails: Fakeout breakouts — price pokes outside the band for one candle then reverses. The MACD filter reduces these by ~40%, but doesn't eliminate them entirely. In a strong trend, bands stay expanded and there's no squeeze to trade.
⚠️ Limitation: The Bollinger squeeze produces false breakouts approximately 30% of the time even with MACD confirmation. In low-volume altcoins, this rate climbs to 40%+. Stick to BTC, ETH, and top-20 market cap tokens for this setup.
Example — ETH Bollinger Squeeze on CoinXSight (June 11, 2026)
ETH had been trading in a tight $1,660–$1,720 range for eight days. Bollinger Band Width on the 4H chart compressed to 3.2% — the tightest reading in 30 periods. MACD was flat near the zero line. On June 11, ETH broke below the lower band at $1,655 with a decisive red candle, and MACD crossed below its signal line in the same 4H period. CoinXSight flagged the setup with a Confluence Score of 7/10 (bearish). ETH dropped to $1,612 over the next three days before finding support. Entry at $1,655, stop at $1,720 (middle band), target at $1,590 gave a 1:1.5 setup.
Combo 3: Supertrend + Stochastic RSI + MFI (The Trend Rider)
This combination is built for strong trending markets. Supertrend gives a clean binary signal (long/short), Stochastic RSI provides precise timing, and MFI confirms that money is flowing in the trade direction.
How It Works
- Supertrend (10, 3): Flips green (bullish) or red (bearish). Unlike EMAs, it gives one clear direction with no ambiguity. You trade in the Supertrend direction only.
- Stochastic RSI (14, 14, 3, 3): Faster than regular RSI. Wait for the K-line to cross above D-line below the 20 level (bullish) or below D-line above the 80 level (bearish). This times your entry within the trend.
- MFI (14): Volume-weighted RSI. MFI above 50 and rising confirms money is flowing into the asset. MFI below 50 and falling confirms outflow. It's the volume layer that prevents you from entering trends with no capital behind them.
Entry and Exit Rules
Entry: Supertrend is green (bull) + Stochastic RSI K-line crosses above D-line below 20 + MFI > 50 and rising.
Stop loss: Below Supertrend line (it acts as a trailing stop by design).
Take profit: When Stochastic RSI reaches 80+, or when Supertrend flips color.
When it fails: Range-bound markets. Supertrend whipsaws back and forth in tight ranges, generating multiple false flips. If price has crossed the Supertrend line more than 3 times in 10 periods, the market is ranging — switch setups.
💡 CoinXSight's Chart Pro module includes Supertrend as part of the Trend Layer in the Confluence Scoring system. When Supertrend, EMA ribbon, and Stochastic RSI all agree, the Confluence Score typically reads 7+ out of 10 — the zone where backtested hit rates exceed 69%.
Combo 4: EMA + MACD + Volume Ratio (The All-Rounder)
This is the highest win-rate combination in the set at ~74%. It works in trending and transitional markets because it uses EMA for direction, MACD for momentum confirmation, and raw volume ratio for capital validation.
How It Works
- EMA (50/200): The classic trend filter. Price above both EMAs = bullish bias. Golden cross (50 crossing above 200) = strong trend initiation. Death cross = bearish.
- MACD (12, 26, 9): Confirms that momentum is accelerating in the trend direction. Focus on the histogram — growing green bars mean bullish momentum is increasing. Shrinking green bars mean momentum is fading even if trend is still up.
- Volume Ratio: Current bar volume divided by the 20-period average. A ratio above 1.5 means the current candle has significantly above-average participation. Breakouts or bounces on high volume ratio are genuine; those on low volume are suspect.
Entry and Exit Rules
Entry: Price above 50 and 200 EMA (long bias) + MACD histogram is positive and growing + current candle volume ratio > 1.5.
Stop loss: Below the 50 EMA or the most recent swing low.
Take profit: 2× the distance from entry to stop (2R target), or trail with the 50 EMA.
When it fails: During macro-driven flash crashes. No technical setup survives a surprise CPI print or regulatory announcement. If a high-impact event is within 24 hours, reduce position size by 50% or skip the trade.
Example — BTC EMA + MACD + Volume on CoinXSight (June 15, 2026)
BTC was consolidating around $63,200 after a volatile week driven by Fed rate comments. On the 4H chart, price was above both the 50 EMA ($62,400) and 200 EMA ($61,100). On June 15, a strong bullish candle closed at $63,500 with the MACD histogram printing its third consecutive growing green bar. Volume ratio spiked to 2.3× the 20-period average as institutional buyers appeared on-chain. CoinXSight's Confluence Score hit 9/10. BTC pushed to $64,100 over the next 24 hours before encountering resistance. The entry at $63,500 with a stop at $62,400 (50 EMA) and a 2R target at $65,700 offered a clean risk-reward of 1:2.
Combo 5: RSI + Bollinger Bands + OBV (The Range Trader)
While the first four combos focus on trend-following, this setup is designed for range-bound markets — which make up roughly 60–70% of crypto market time.
How It Works
- RSI (14): In a range, RSI oscillates reliably between 30 and 70. Buy when RSI crosses above 30 (oversold bounce). Sell when RSI crosses below 70 (overbought rejection).
- Bollinger Bands (20, 2): Price touching the lower band in a range = potential buy zone. Price touching the upper band = potential sell zone. Unlike the squeeze breakout strategy (Combo 2), here you're trading mean reversion within the bands.
- OBV: Confirms whether the range boundary test has volume behind it. If price hits the lower Bollinger Band, RSI is at 30, AND OBV is turning up — that's a three-layer buy signal within the range.
Entry and Exit Rules
Entry (Long): Price at or below lower Bollinger Band + RSI crossing above 30 + OBV turning up from a flat or declining trend.
Stop loss: Below the range low (not the band — the actual price support level).
Take profit: Middle Bollinger Band (20 SMA) for conservative targets, or upper band for aggressive targets.
When it fails: When the range breaks. This is the critical risk with range strategies — you're buying support that eventually breaks. If RSI fails to bounce at 30 and instead drops to 20, the range is breaking down. Exit immediately.
⚠️ Limitation: Range-bound strategies have a shorter shelf life than trend strategies. A range that's held for 3 weeks may look reliable, but crypto ranges break without warning. Always define the range boundaries before entering and accept that the range will eventually end.
How to Validate Any Indicator Combination
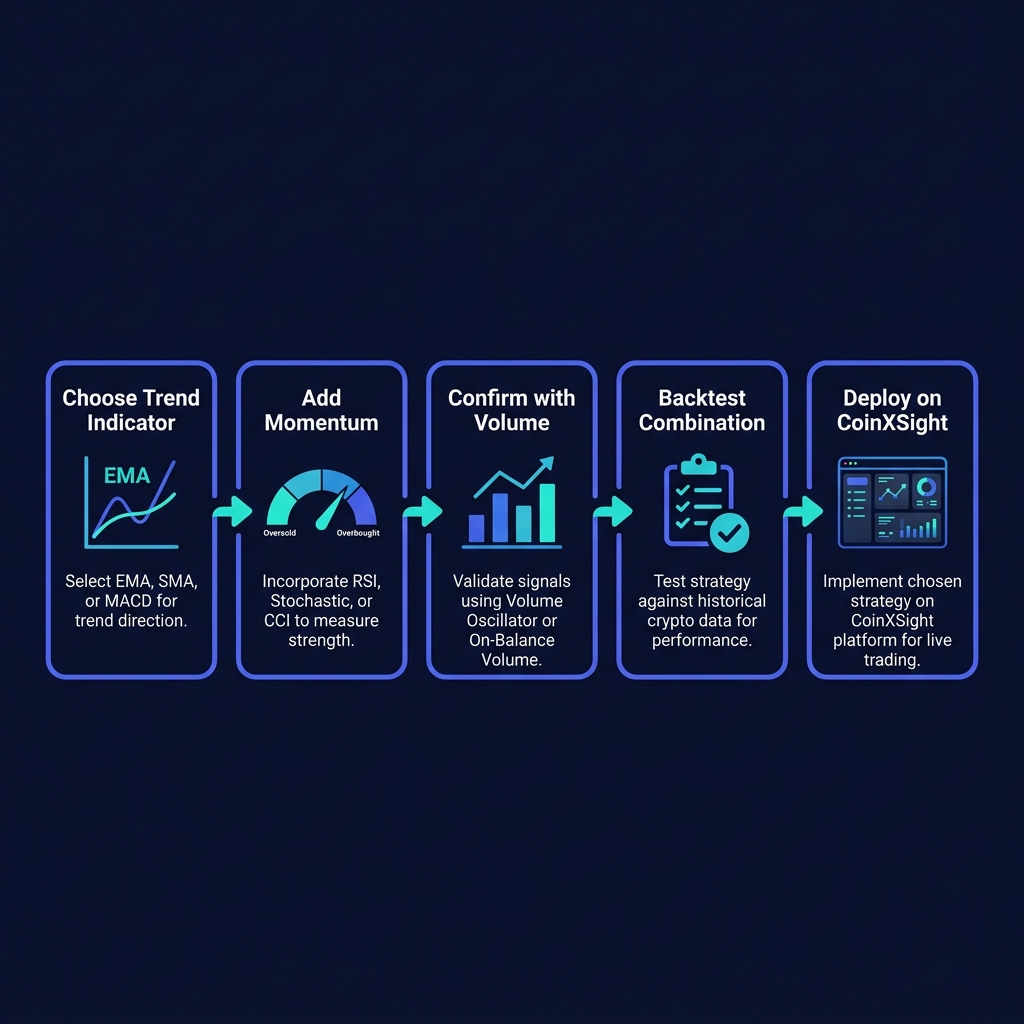
Not every combination that looks good on paper works in live markets. Before trading any setup with real capital, run this validation process.
Step 1: Check for Independence
Confirm your indicators measure different things. If two indicators are both derived from closing prices and moving averages (like RSI and CCI), they'll generate correlated signals. Use the category table above — one indicator per category minimum.
Step 2: Backtest on 100+ Signals
A combination needs at least 100 qualifying signals to produce a statistically meaningful win rate. On BTC 4H charts, most combinations generate 100 signals within 6–12 months of data. Fewer signals means the sample size is too small to trust.
Step 3: Test Across Market Conditions
Run the backtest across at least one bull phase, one bear phase, and one ranging phase. A combination that works at 80% in a bull market but 40% in a bear market isn't reliable — it's a trend-following strategy disguised as a universal tool.
Step 4: Paper Trade for 30 Days
Backtesting doesn't account for execution psychology. Paper trade the combination for a full month before committing capital. Track every signal, entry, and exit in a journal.
Step 5: Deploy and Monitor
Start with 25% of your intended position size. Scale up only after 20+ live trades confirm the backtest results. If live results diverge from backtest by more than 10%, re-evaluate.
💡 CoinXSight's Chart Pro module lets you backtest indicator combinations against historical data for any token. Set up your combination, select the date range, and the platform runs the analysis — no spreadsheet required. Use this as your crypto portfolio tracker and analysis hub.
How to Use Indicator Combinations on CoinXSight
CoinXSight's Chart Pro module is built to test and deploy multi-indicator strategies on a single crypto trading platform. Here's how to set up any combination from this guide:
- Sign in at app.coinxsight.com
- Navigate to Chart Pro from the main dashboard
- Search for any token (BTC, ETH, SOL, or 500+ others)
- Open the Indicators Panel → select your combination (e.g., EMA + RSI + OBV)
- Check the Confluence Score in the right sidebar — scores above 7/10 align with the high-probability setups described above
- Click Set Alert → choose your score threshold (e.g., "Alert me when BTC Confluence Score hits 8+")
- Cross-reference with the per-layer breakdown to see which indicators are agreeing and which are conflicting
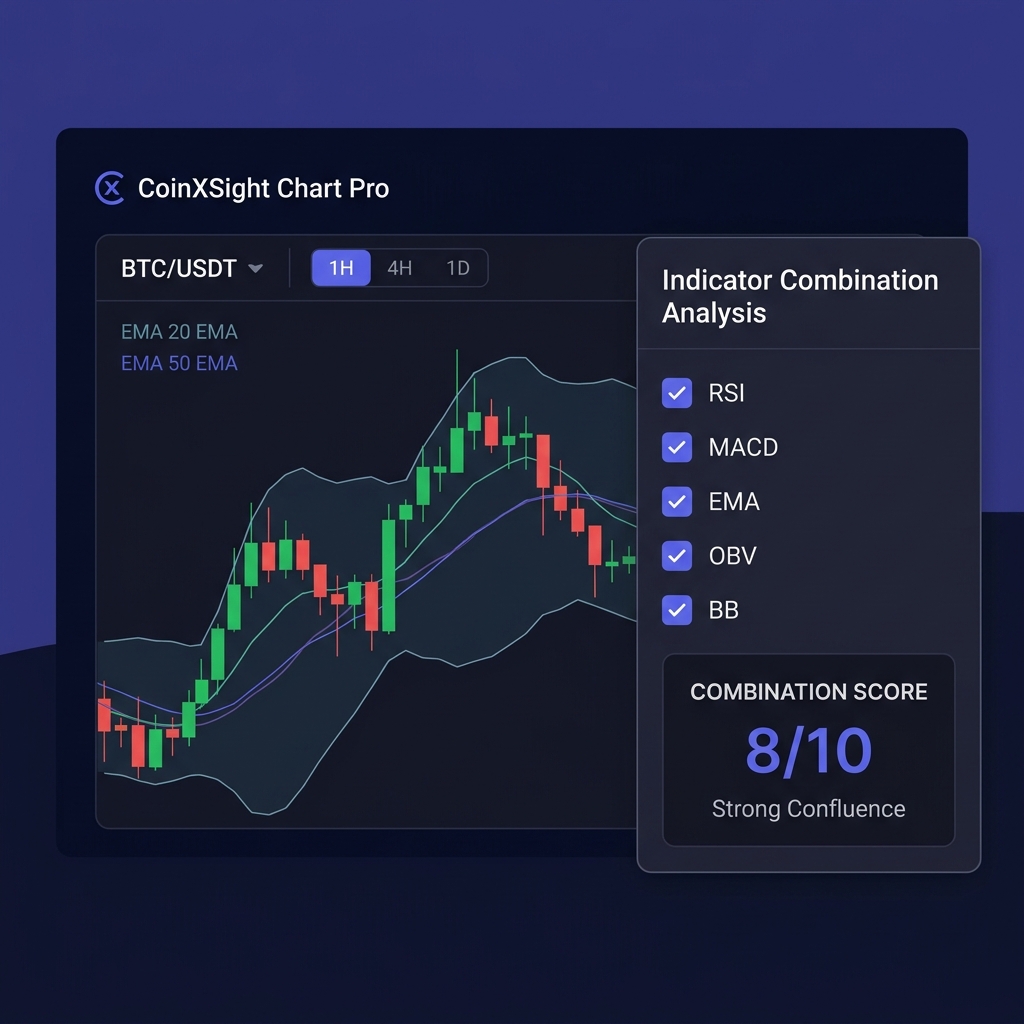
On CoinXSight, each indicator combination doesn't exist in isolation — it feeds into the 4-layer Confluence Scoring system:
- Trend Layer: EMA ribbon + Supertrend
- SMC Layer: Order Blocks + Fair Value Gaps
- Momentum Layer: RSI + MACD + StochRSI + MFI
- Volume Layer: Volume ratio + Bollinger Bands
Unlike other crypto portfolio trackers, CoinXSight runs all four layers in real time and surfaces the combined score — so you don't have to manually check each indicator on separate charts.
Whether you're comparing signals on the best crypto exchange charts or analyzing altcoins, the platform handles the math while you focus on execution.
Common Mistakes When Combining Indicators
Mistake 1: Stacking Correlated Indicators
RSI + Stochastic RSI + CCI = three momentum oscillators measuring overlapping data. When they agree, you have one signal, not three. When they disagree, you're confused.
Fix: One indicator per category. Trend + Momentum + Volume is the minimum viable combination.
Mistake 2: Ignoring the Timeframe
A bullish signal on the 15-minute chart is meaningless if the daily chart shows a strong downtrend. Lower-timeframe signals without higher-timeframe alignment get stopped out by the bigger trend.
Fix: Always check the higher timeframe first. Daily trend → 4H momentum → 1H entry. If the daily disagrees, skip the trade.
Mistake 3: Curve-Fitting to Historical Data
Optimizing indicator settings to perfectly match past data (e.g., RSI period 11 instead of 14 because it backtest better on BTC in 2024) creates a system that works in the past but breaks in the future.
Fix: Use default indicator settings. RSI 14, MACD 12/26/9, BB 20/2. These settings have survived 40+ years of market testing across asset classes for a reason.
FAQ
What is the best crypto indicator combination for beginners?
EMA (50/200) + RSI (14) + OBV. This three-layer combination covers trend, momentum, and volume with indicators that are simple to read. Backtested win rate on BTC 4H charts: ~71%. Start with this before adding complexity.
Can I use RSI and MACD together for crypto trading?
Yes, but they both measure momentum — so they provide limited additional confirmation when combined alone. Add a trend indicator (EMA or Supertrend) and a volume indicator (OBV or MFI) to turn RSI + MACD into a high-probability setup with a ~74% win rate.
How many indicators should I combine?
Three to four from different categories. Research shows diminishing returns past four indicators, and at six or more, full agreement becomes so rare that you rarely trade. One trend + one momentum + one volume is the minimum.
Does CoinXSight test indicator combinations automatically?
Yes. CoinXSight's Chart Pro module scores 12 indicator layers in real time and displays a Confluence Score from 0–10 for 500+ tokens. You can view per-layer breakdowns and set alert thresholds for any score level.
What timeframe works best for indicator combinations in crypto?
The 4-hour chart produces the best balance of signal quality and frequency for most combinations. Daily charts are more accurate but generate fewer trades. Avoid 5-minute and 15-minute charts for multi-indicator strategies — noise overwhelms the signals at those timeframes.
Disclaimer: This article is for educational and informational purposes only and does not constitute financial, investment, or trading advice. Cryptocurrency markets are highly volatile and involve substantial risk of loss. No trading strategy guarantees profits. Paper-trade or demo-trade before risking real capital. Always conduct your own research (DYOR) and consult a licensed financial advisor before making any investment decisions. Past performance does not guarantee future results. CoinXSight provides analytical tools and data — not investment recommendations. Mention of specific tokens does not constitute a buy or sell recommendation.