Monthly Crypto Analysis: May 2026 Market Review & June Outlook
Comprehensive monthly cryptocurrency market review for May 2026. Total market cap trends, BTC/ETH/SOL performance breakdown, Alpha Hunter pipeline metrics, macro environment analysis, and strategic outlook for June 2026. Weekly crypto market analysis and bitcoin price prediction insights.
AT
Alex ThorneHead of Macro & Market Structure·May 20, 2026 · 15 min read · Updated Oct 6
May 2026 has been a defining month for the crypto market — one that will be remembered for geopolitical shock, monetary policy uncertainty, and a broad-based risk-off rotation that tested the conviction of even the most seasoned market participants. As we approach month-end, the picture is clear: this is a market in fear, but not in capitulation.
Month-to-Date Performance Summary
Metric
Start of May
Current (May 20)
Change
Total Market Cap
~$2.80T
$2.651T
-5.3%
BTC Price
~$81,300
$77,200
-5.0%
ETH Price
~$2,310
$2,126
-8.0%
SOL Price
~$95.60
$84.80
-11.3%
BTC Dominance
57.1%
58.28%
+1.18pp
Fear & Greed
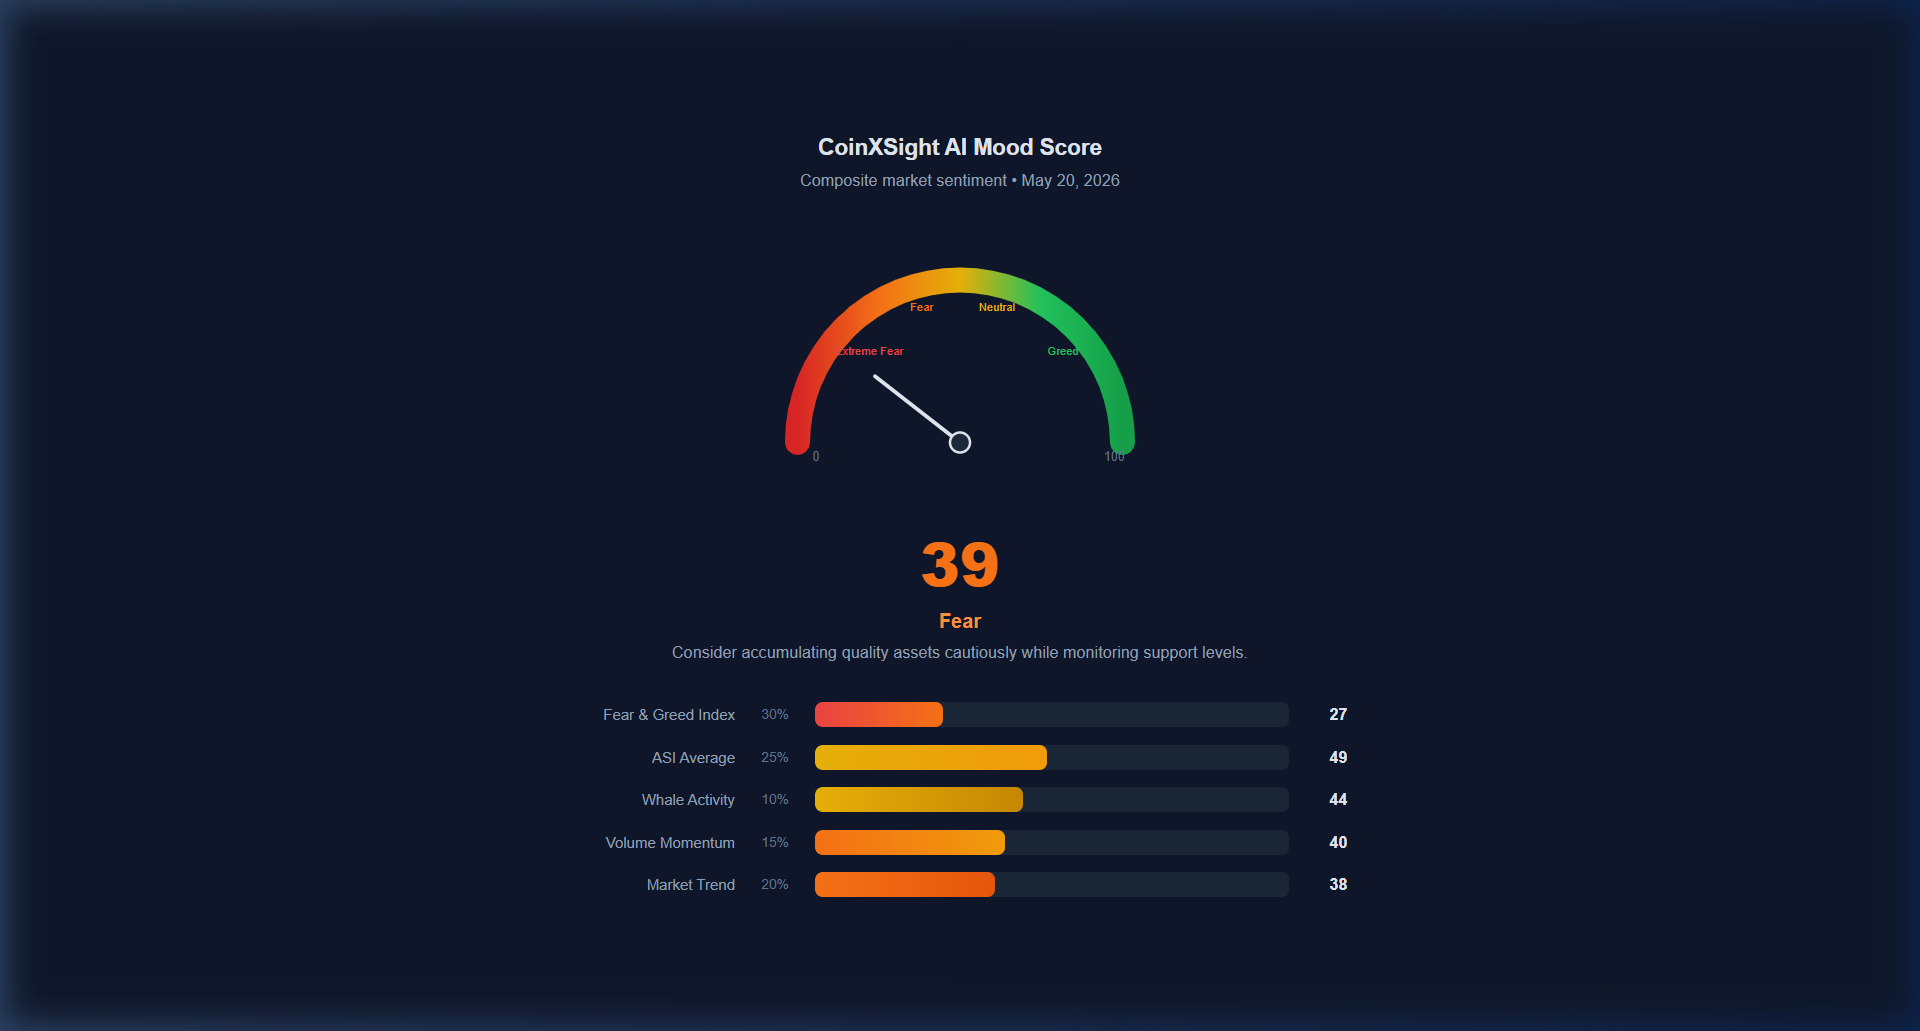
42 (Fear)
27 (Fear)
-15 points
AI Mood Score
—
39 (Fear)
Persistent fear
The market has shed approximately $150 billion in total capitalization over 20 days, with altcoins bearing the brunt of the drawdown. BTC's relative outperformance (only -5% vs. SOL's -11.3%) has pushed dominance above 58% — a trend that historically precedes either major altcoin capitulation or a dominance reversal rally.
The Three Forces Shaping May
1. The Strait of Hormuz Crisis
The single largest macro catalyst of May 2026 has been the escalation of US-Israeli military confrontation with Iran, culminating in the partial blocking of the Strait of Hormuz — the world's most critical oil shipping chokepoint. The consequences have been immediate and severe:
Global growth forecast cut to 2.5% by the United Nations (from 2.7%)
Developing economy inflation projected to accelerate from 4.2% to 5.2%
Risk assets across all classes experienced selling pressure
For crypto specifically, the energy crisis has created a double headwind: direct inflationary pressure that keeps the Fed hawkish, and indirect risk-off sentiment that pulls capital toward treasuries and gold.
2. Federal Reserve Policy Paralysis
The Federal Reserve, now under Chair Kevin Warsh, finds itself in an uncomfortable position. The federal funds rate sits at 3.50% – 3.75%, and the market that entered 2026 expecting cuts is now debating whether hikes are necessary.
Key data points driving the shift:
Hot inflation prints in April and early May, amplified by energy costs
Bond yields rising as markets reprice the rate path
64.6% probability of holding rates steady (vs. previous expectations of 2-3 cuts by year-end)
Growing probability of a quarter-point hike in the June or July FOMC meetings
This uncertainty is poison for speculative assets. Without a clear dovish pivot, crypto lacks the monetary tailwind that powered the 2024-2025 bull run.
3. US-China Trade Thaw
The month's sole constructive development came from President Trump's mid-May state visit to China:
Agreement to reduce tariffs on goods valued at $30B+ per side
Establishment of a new Trade Council for ongoing negotiations
Commitment to address non-tariff barriers
While structurally insufficient to resolve the deeper technology and supply chain frictions, this represents a marginal positive that prevented further equity and crypto deterioration in the second half of the month.
Asset-by-Asset Breakdown
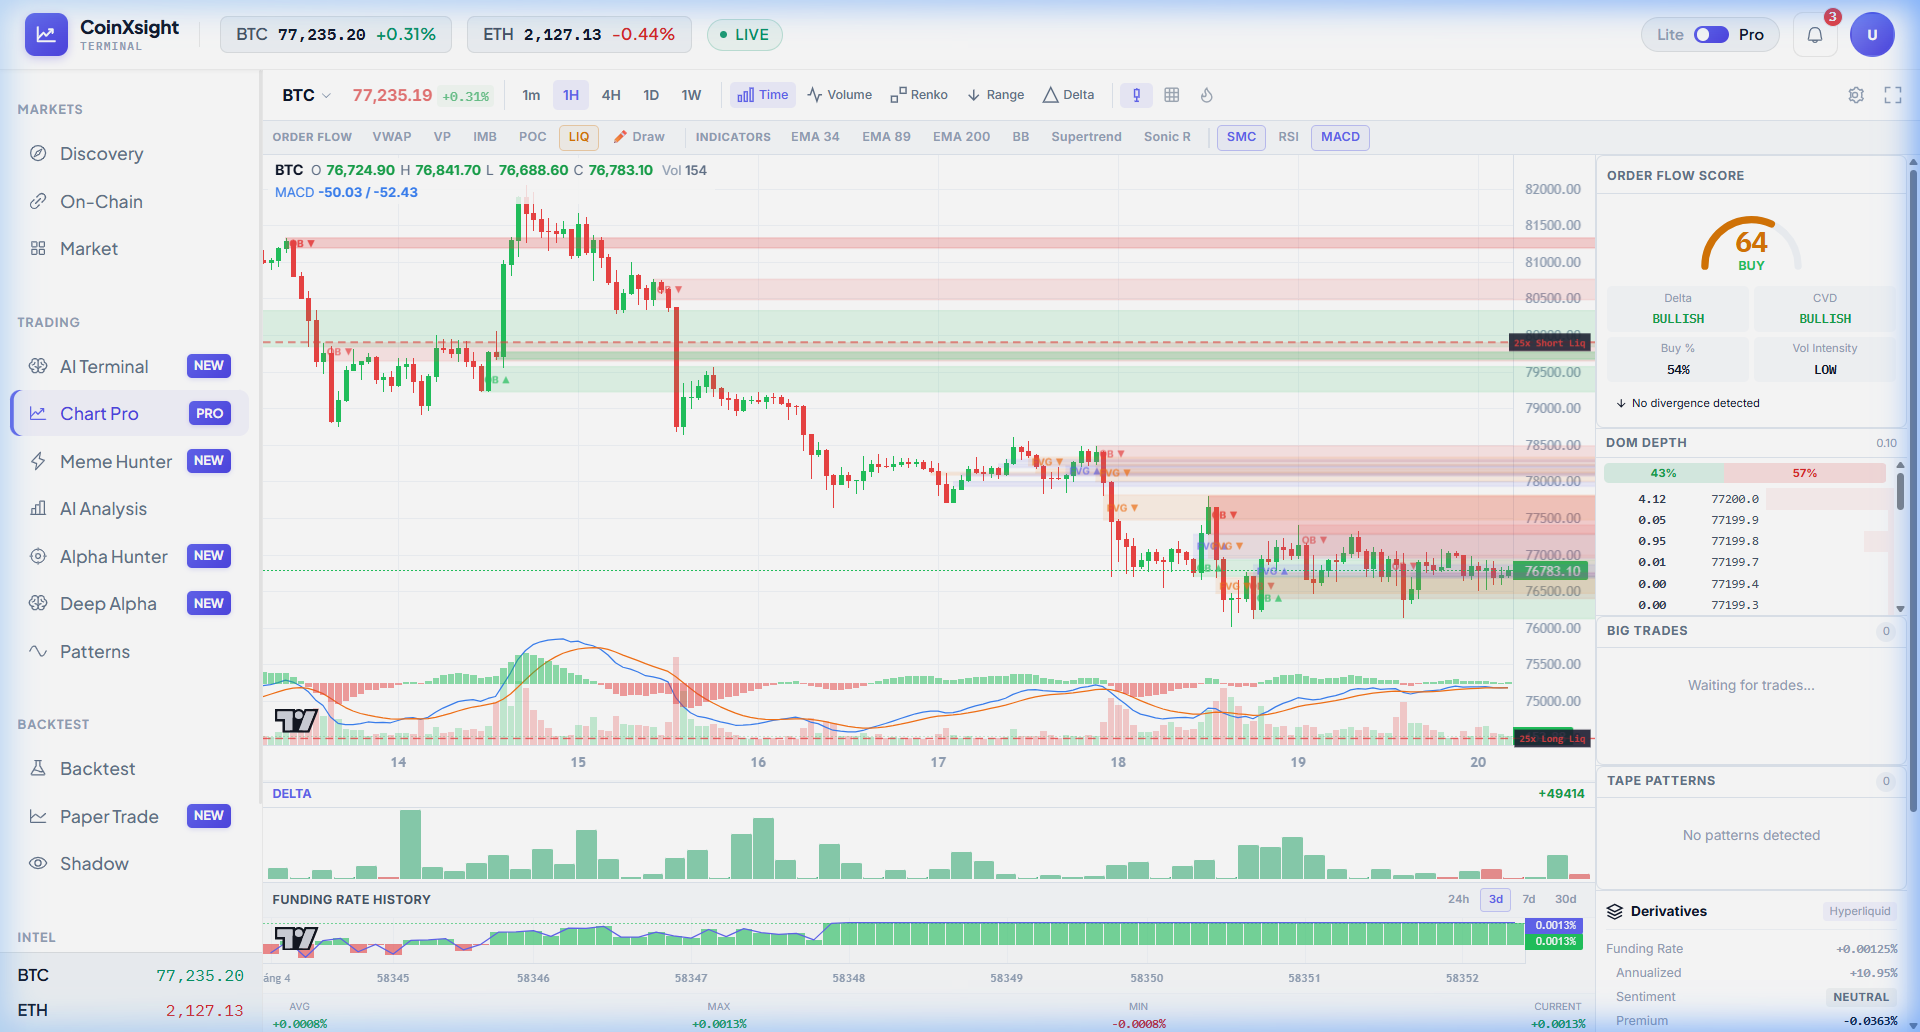
This is where crypto technical analysis becomes practical — a quality crypto analytics platform will display these signals in real time, helping you act on setups as they form.
Bitcoin (BTC): The Reluctant Leader
Current Price: $77,200 | MTD: -5.0% | Market Cap: $1,544.5B
Bitcoin's May journey has been a study in reluctant resilience. After failing to sustain above $80,000 early in the month, BTC has been grinding lower but refusing to break below the critical $75,000 support zone.
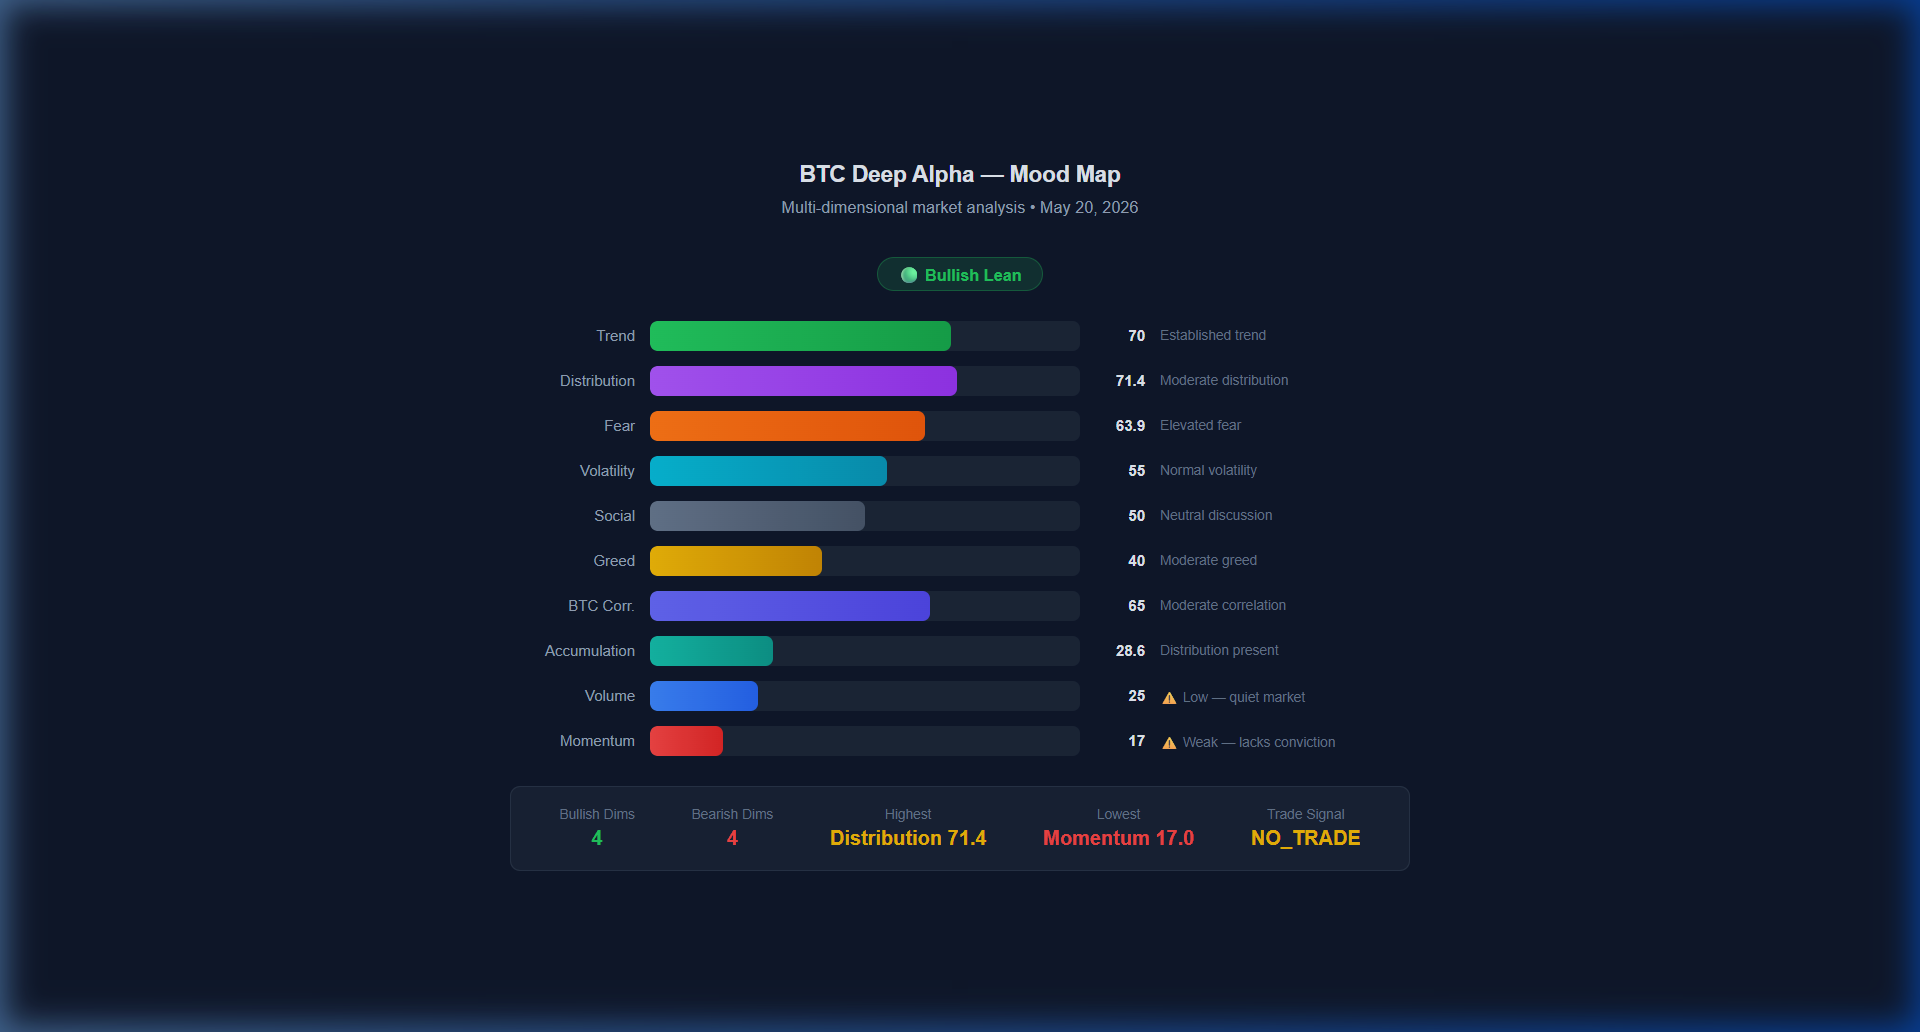
CoinXSight Deep Alpha Assessment:
The multi-factor analysis paints a mixed picture:
Trend: 70/100 — The macro trend remains structurally intact despite the pullback
Momentum: 17/100 — The weakest reading, indicating the current move lacks conviction
Volume: 25/100 — Dangerously low, suggesting a coiled spring or further decay
Distribution: 71.4/100 — Outweighs accumulation (28.6), indicating sellers still in control
Monthly Narrative: Bitcoin is in a classic "no man's land" — too strong to break down convincingly, too weak to attract fresh momentum-driven buying. The 58.28% dominance tells us capital is flowing into BTC from altcoins (relative safety), but not enough fresh capital is entering the crypto ecosystem to push price higher.
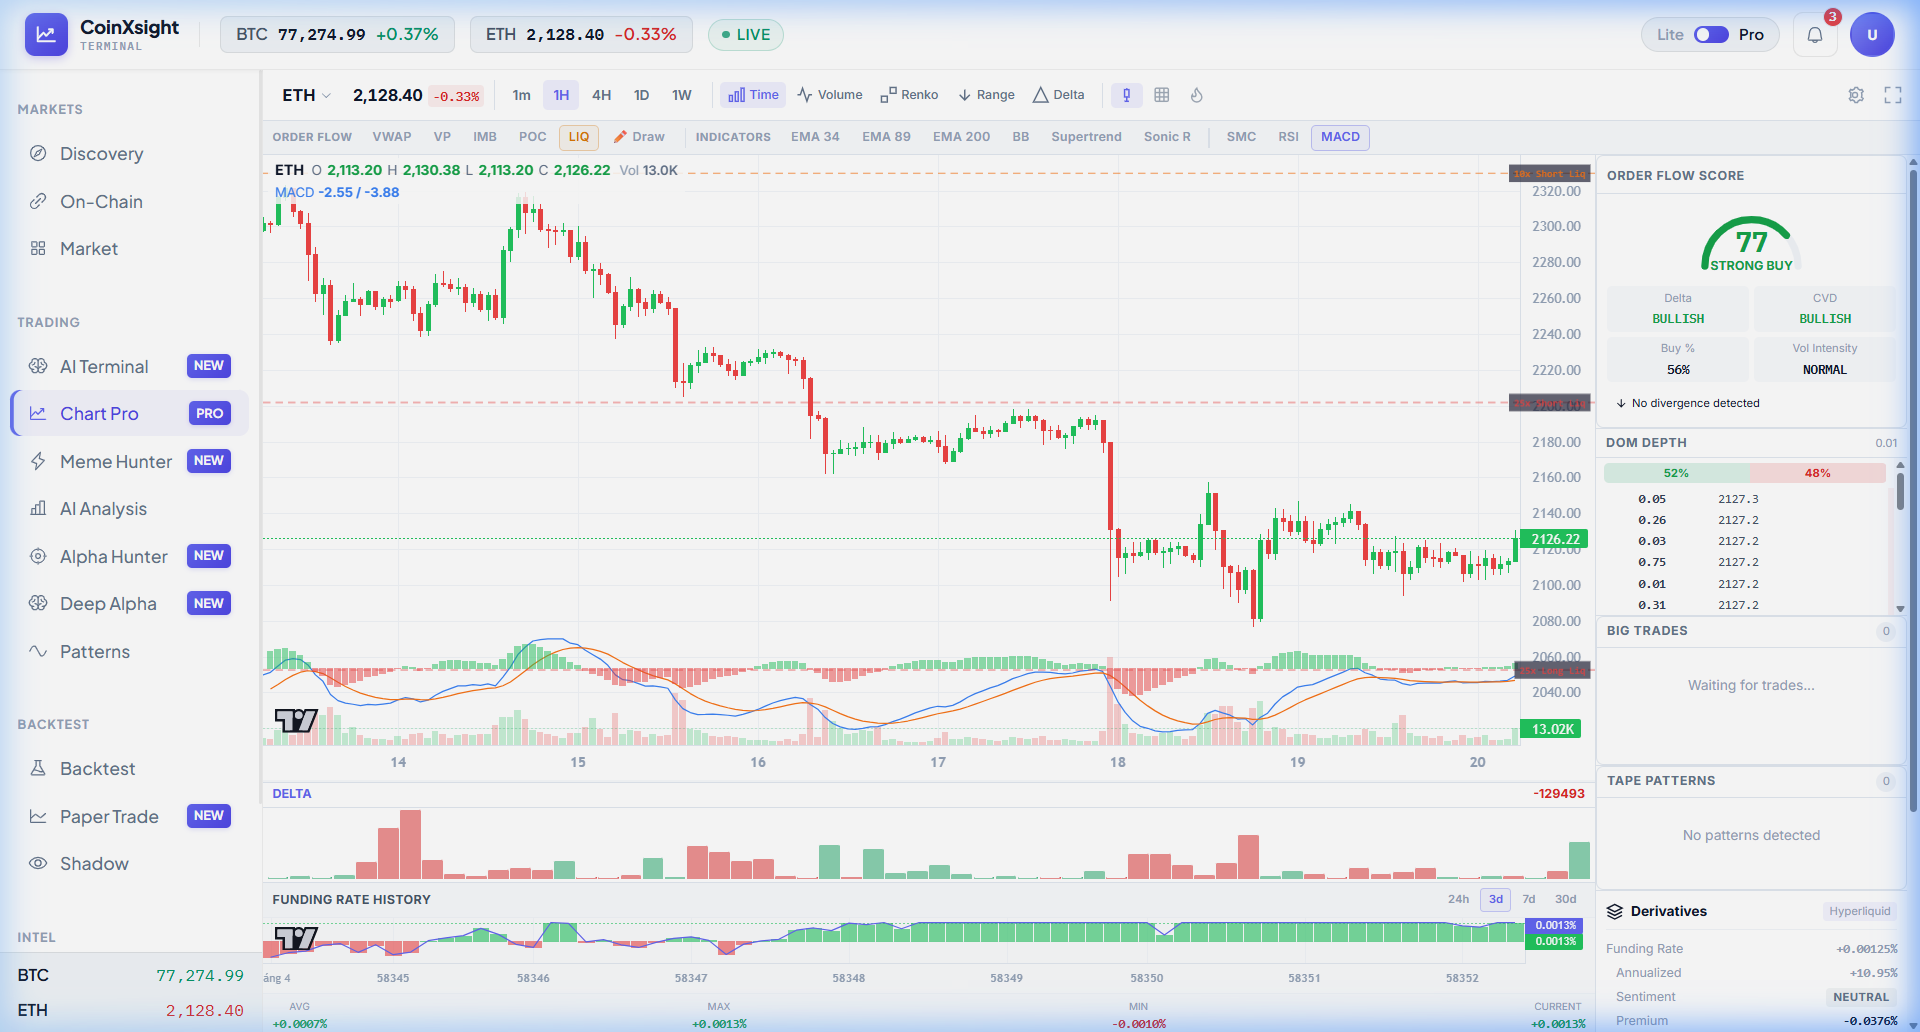
Current Price: $2,126 | MTD: -8.0% | Market Cap: $256.3B
Ethereum has underperformed Bitcoin significantly this month, with ETH/BTC declining alongside spot price. The 9.67% dominance represents a concerning deterioration.
CoinXSight Deep Alpha Assessment:
Paradoxically, ETH shows the strongest technical readings:
Trend: 95/100 — The strongest trend score of any major asset (but it's a downtrend)
The contradiction between the "Strong Bullish Setup" mood and the bearish price action deserves explanation: the multi-dimensional analysis shows that conditions for a reversal are aligning (accumulation signals, sentiment extremes), even though the current trend is decisively bearish. This is a textbook bottoming signal that precedes reversals — but timing the bottom is notoriously difficult.
Recent Alpha Performance:
The Alpha Hunter pipeline successfully generated an ETH LONG at $2,104.30 on May 18, which hit TP1 at $2,136 for a +1.51% gain via a Wyckoff Spring pattern. This confirms that short-term reversal plays remain profitable within the broader downtrend.
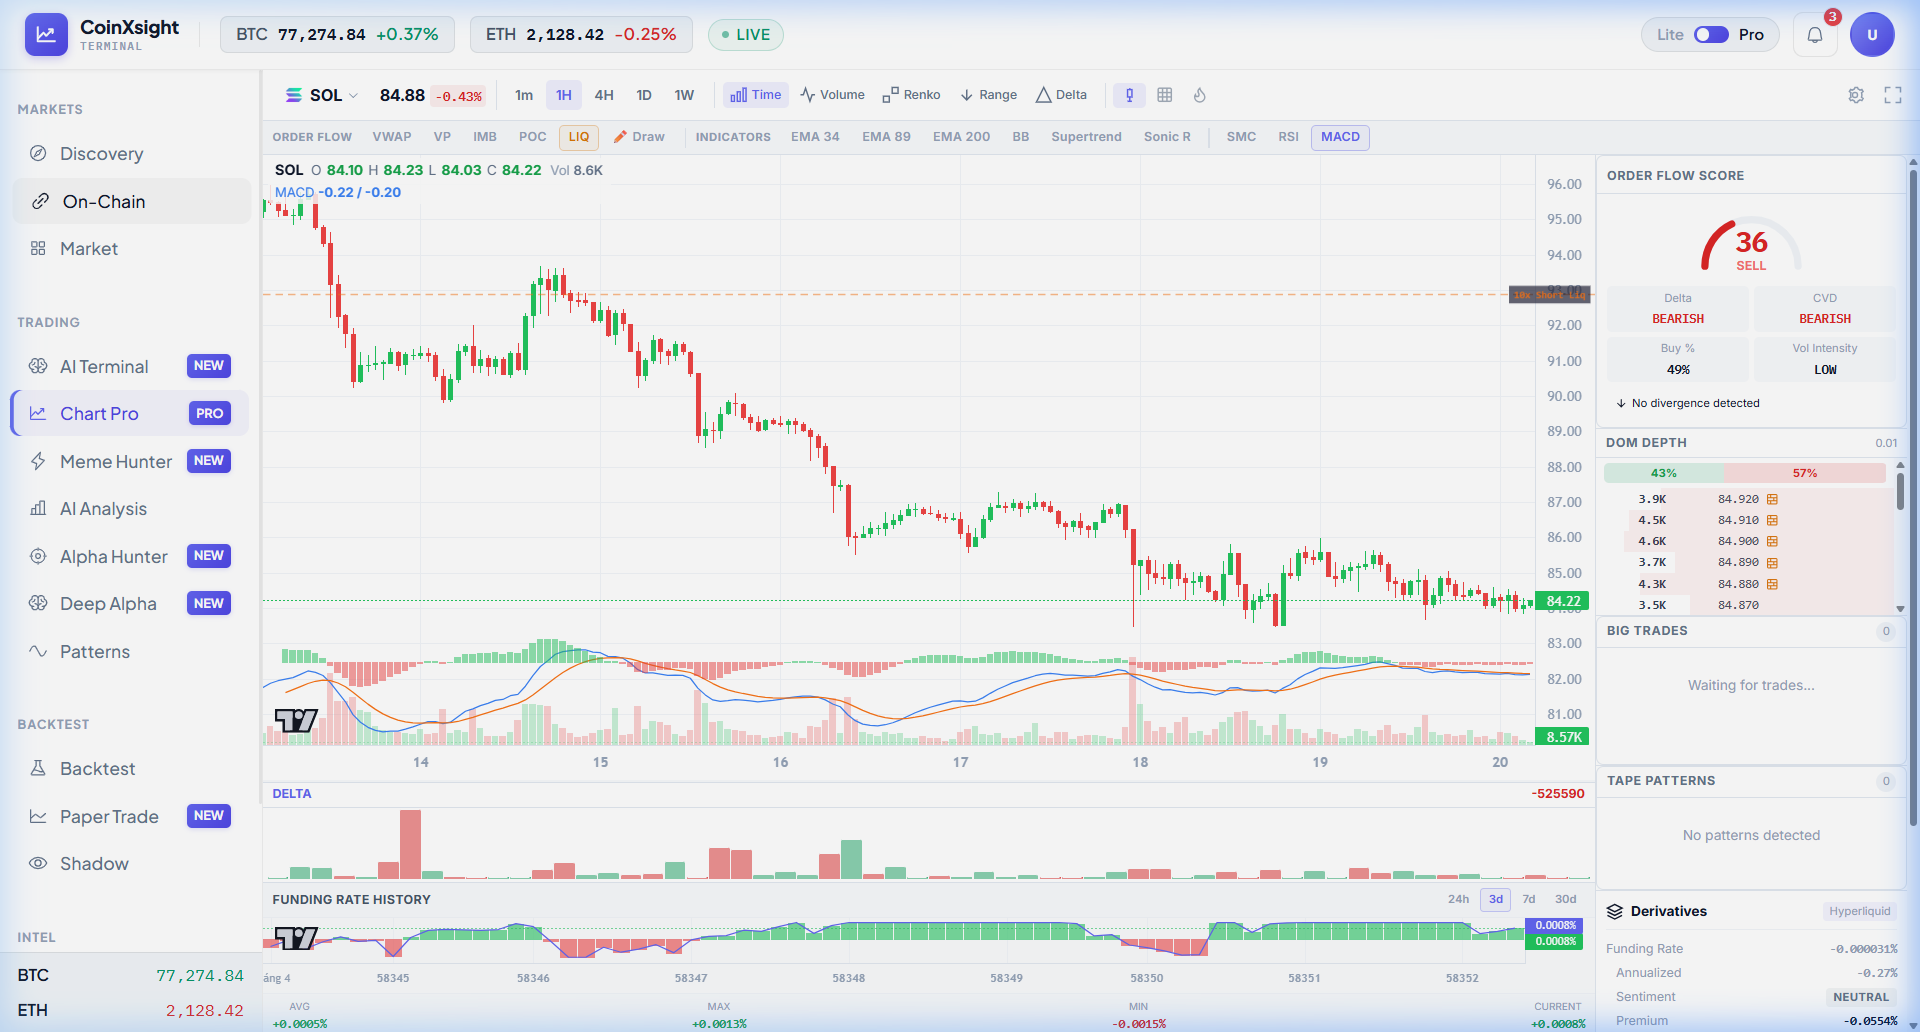
Current Price: $84.80 | MTD: -11.3% | Market Cap: $48.9B
Solana has been the most punished major asset in May, with an 11.3% drawdown that significantly exceeds BTC and ETH. However, the technical picture contains an intriguing contradiction.
CoinXSight Deep Alpha Assessment:
Momentum: 91/100 — The highest reading across all majors this month
Trend: 60/100 — Established bearish trend
Accumulation: 50/100 — Neutral (no panic selling yet)
Distribution: 50/100 — Limited (no aggressive dumping)
The 91/100 momentum score is extraordinary — it indicates that the bearish move has maximum force behind it. This is both a warning (don't fight the trend) and a harbinger (extreme momentum readings historically precede reversals).
The balanced 50/50 accumulation/distribution ratio is particularly notable: it tells us that the sell-off is orderly, not capitulatory. Whales are not aggressively dumping SOL — they're reducing exposure methodically.
Continued Fear zone with selective accumulation opportunities
Bear Case (25% probability)
Catalyst: Oil crisis escalation, Fed rate hike, major ETF outflows
BTC: $68,000 – $74,000
ETH: $1,700 – $1,950
SOL: $60 – $75
Capitulation event triggers broad reset
Strategic Recommendations
For Long-Term Holders (HODLers)
Continue DCA into BTC and ETH at current fear levels
The AI Mood Score at 39 is historically favorable for 6-month returns
Do not over-allocate to high-beta altcoins until fear lifts above 50
For Active Traders
Follow the Alpha Hunter signals — Wyckoff Spring patterns have shown consistent profitability
LINK offers the best risk/reward among current active signals (60 confluence, 100% confidence)
Use tight stops — elevated volatility means wider swings
Avoid counter-trend positions without volume confirmation (sub-50/100 volume readings are a red flag)
For Risk-Off Participants
Stablecoin yields remain attractive in the current rate environment
Consider TRX staking as a defensive yield play within crypto
Wait for AI Mood Score to drop below 25 (extreme fear) for maximum contrarian opportunity
This monthly analysis is powered by CoinXSight's comprehensive AI intelligence suite — combining Deep Alpha multi-factor analysis, Alpha Hunter signal pipeline, AI Mood Score, and real-time market data. All data sourced live from CoinXSight production APIs at the time of publication.
This is not financial advice. Cryptocurrency markets are highly volatile. Always conduct your own research and consult with a qualified financial advisor before making investment decisions.
Head of Macro & Market Structure·Global Macro Desk
Former institutional FX and macro derivative analyst. Specializes in global liquidity cycles, central bank balance sheets, and crypto market microstructure.
QUANTITATIVE SUITE // DEEP ALPHA ENGINEACTIVE
BTC/USDT // LIVE SCANNER
CONFLUENCE 79
LIVE SPOT PRICE$83,613.06MODERATE_BUY
TP2
$89,046.84
+6.95%
TP1
$85,576.95
+2.78%
ENTRY
$83,263.68
ZONE
SL
$82,107.05
-1.39%
Auto-detect Order Blocks, Fair Value Gaps and risk-adjusted DCA ladders in < 5s.