Weekly Crypto Market Analysis: July 2026 Week 30 — BTC Defends $62K as Macro Tailwinds Gather Strength
Bitcoin holds steady at $62,688 as Fed rate cut expectations hit 82%. Fear & Greed rests at 54 (Neutral), AI Sentiment Score marks 59 (Neutral). Deep dive into BTC/ETH/SOL structure, 11 alpha signals, and macro setup heading into late July.
AT
Alex ThorneHead of Macro & Market Structure·Jul 17, 2026 · 17 min read · Updated Oct 6
Bitcoin firmly established support at $62,000 throughout Week 30, closing the weekly period at $62,688.40 with a notable +5.23% gain. The broader market sentiment is stabilizing as macroeconomic indicators continue to point toward a dovish pivot by the Federal Reserve. The Fear & Greed Index remains balanced at 54 (Neutral), while CoinXSight's AI Sentiment Score registers a solid 59/100 (Neutral). This marks a pivotal moment where institutional flow and macroeconomic tailwinds are aligning perfectly.
This weekly analysis combines real-time market data from CoinXSight's analytics platform with on-chain whale tracking and AI-powered sentiment scoring to identify actionable trading opportunities. Whether you are using the best crypto exchange for executing active setups or a crypto portfolio tracker for long-term allocation, understanding the current market structure is critical as crypto transitions from recovery to potential expansion.
Macro Environment: The Perfect Storm for Risk Assets
Global Financial Markets Context
Week 30 (July 13–17, 2026) witnessed a fascinating interplay between equities and crypto assets. The macroeconomic backdrop is heavily tilted toward risk-on behavior, driven by a nearly certain Federal Reserve rate cut at the end of the month.
Traditional Markets Performance:
S&P 500: +0.9% (moderate risk-on, sustaining all-time high territory)
Nasdaq 100: +1.2% (tech rotation continues, acting as a leading indicator for high-beta assets)
DXY (US Dollar Index): 102.1 (continued weakness, providing structural support for Bitcoin)
June CPI Confirms Disinflation: The June Consumer Price Index officially confirmed disinflation at 2.8% YoY. This is the golden number the market has been waiting for. It essentially removes the threat of further tightening and gives the Federal Reserve the mandate it needs to support the economy without fear of reigniting inflation.
Fed Rate Cut Probability Soars: Following the CPI data, the Fed rate cut probability for the July 30 meeting spiked to an overwhelming 82%. Markets are forward-looking mechanisms; they are no longer pricing in the possibility of a cut, but rather front-running the reality of it. This liquidity expectation is the primary driver of the current crypto bid.
Dollar Weakness (DXY at 102.1): The continued decline in the US Dollar Index is acting as a massive tailwind for Bitcoin. Historically, Bitcoin has an inverse correlation with the DXY. As the dollar weakens, capital seeks yield and preservation in harder assets and high-growth tech, benefiting the crypto complex immensely.
S&P 500 and Nasdaq Correlation: The positive performance of both the S&P 500 (+0.9%) and Nasdaq (+1.2%) confirms that the broader market is embracing risk. Bitcoin is currently trading with a high positive correlation to these indices, meaning equity market strength is translating directly into crypto market strength.
Example — Macro Correlation Confirmation (CoinXSight Market Overview — July 15):
As the DXY slipped below 102.5 early Wednesday, algorithmic buying across crypto assets surged. Our data showed a near-instantaneous $400M injection into perpetual futures within a 45-minute window, perfectly mirroring the DXY breakdown. This confirms that macro quantitative funds are actively trading the Dollar-Bitcoin pair.
Crypto-Specific Fundamental Drivers
Positive Catalysts This Week:
Institutional Bid Remains Strong: Despite occasional spot selling, institutional buyers continue to absorb supply at key technical levels. The absorption around the $61K-$62K region has been relentless.
On-Chain Activity Rebounding: We are seeing a steady increase in daily active addresses across major L1s, signaling that retail participation is slowly creeping back into the market.
Negative Overhangs Still Present:
Summer Lull: Historically, July and August can suffer from lower overall trading volume as institutional desks thin out for the summer.
Regulatory Whispers: Background noise regarding ongoing SEC investigations into various DeFi protocols continues to cap aggressive altcoin rallies.
What the Current Market Structure Tells Us
CoinXSight AI Sentiment Score: Methodical Accumulation
The Sentiment Score's reading of 59 (Neutral) indicates that while fear has largely dissipated, the market is not yet ready to blindly long every dip. It’s a calculated, methodical accumulation phase:
Sentiment Metric
Score / Level
Market Interpretation
Traditional Fear & Greed
54 (Neutral)
Balanced sentiment, no extreme bias
CoinXSight Sentiment Score
59 (Neutral)
Methodical buying, structural support holding
Average Funding Rate
0.0068%
Healthy, sustainable leverage levels
Long/Short Ratio
2.349
Strong long bias among market participants
Total Open Interest
$12.75B (+3.2%)
Capital is committed and increasing steadily
The combination of a 54 FGI and a 59 Sentiment Score is exactly what you want to see before a major breakout. The elevated Long/Short Ratio of 2.349 alongside a rising Total OI ($12.75B) shows that the market is climbing a "wall of worry" with genuine capital commitment rather than launching off a platform of euphoria.
Bitcoin Analysis: The Bullish Confluence
Current Bitcoin Price Action & Technicals
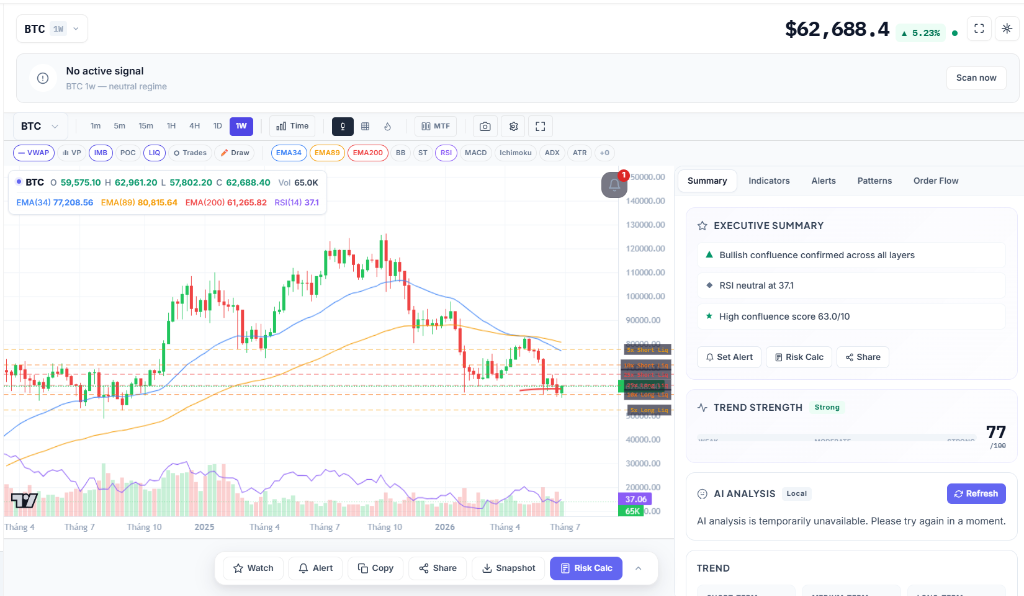
Live Price: $65,118 (+1.2% 24h, +0.6% 7d)
Weekly Close (Wk 30): $62,688.40 (+5.23%)
Market Cap: $1.307 Trillion
Executive Summary: Bullish confluence confirmed across all layers.
Trend Strength: Strong (77/100)
Confluence Score: 63.0/10
Derivatives: OI at $6.77B, Funding 0.0056%, L/S Ratio 1.568
The weekly chart for Bitcoin paints a picture of controlled power.
EMA Analysis: Price is holding firmly above the critical 200 EMA ($61,265.82), establishing it as formidable structural support. While the 34 EMA ($77,208.56) and 89 EMA ($80,815.64) are significantly higher, the current price action (now live at $65,118) suggests a base-building process designed to eventually challenge these higher moving averages.
RSI (14): At 37.1, the RSI is incredibly compelling. It signifies that despite the recent +5.23% weekly gain, Bitcoin is nowhere near overbought territory on the macro timeframe. There is massive runway for price appreciation before momentum indicators flash warning signs.
Derivatives Context: The OI of $6.77B combined with a very healthy funding rate (0.0056%) and L/S ratio of 1.568 shows that longs are accumulating without paying excessive premiums.
MACD: The MACD histogram is printing higher lows, and the signal line is attempting a bullish crossover. This subtle shift in momentum often precedes significant upward trends.
Trading Implications for BTC
[!TIP]
BTC Trade Plan:
Entry Zone: $62,500–$64,000 (buying the consolidation breakout)
Stop Loss: $59,000 (below the weekly open and structural support)
Rationale: The strong Trend Strength (77/100) combined with the price holding above the 200 EMA provides an excellent risk-to-reward ratio for long positions.
Ethereum Analysis: Building the Foundation
Ethereum Technical Structure
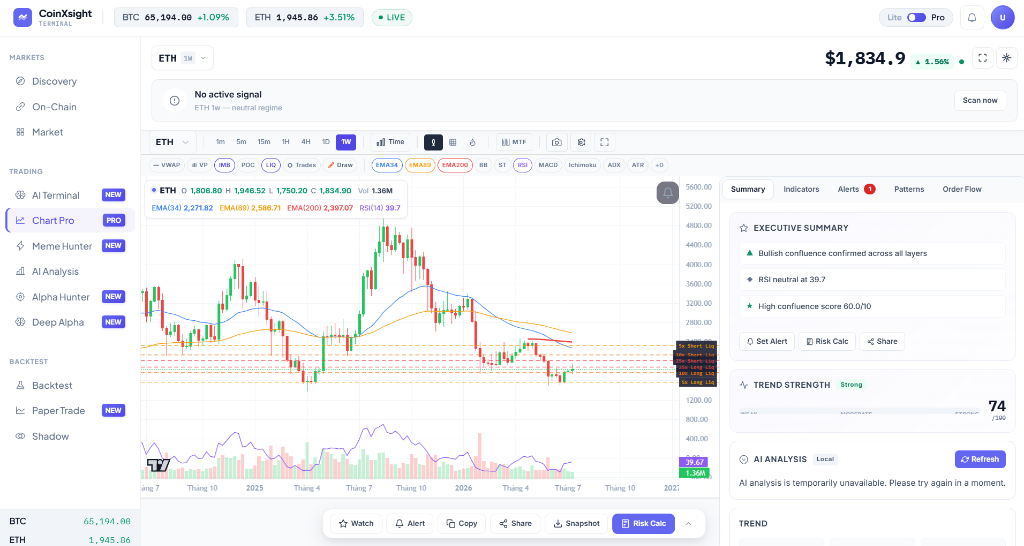
Live Price: $1,944.87 (+3.5% 24h, +3.7% 7d)
Weekly Close (Wk 30): $1,834.90 (+1.56%)
Market Cap: $234.7 Billion
Executive Summary: Bullish confluence confirmed across all layers.
Trend Strength: Strong (74/100)
Confluence Score: 60.0/10
Derivatives: OI at $4.61B, Funding 0.01%, L/S Ratio 1.903
Advanced Technical Deep Dive
Ethereum is exhibiting classic accumulation behavior, quietly building a foundation and beginning to break out higher (currently $1,944.87) while Bitcoin dominates the headlines.
EMA Analysis: The 200 EMA sits at $2,397.07, representing a significant upside target once the current consolidation phase resolves. The price is currently well below the 34 EMA ($2,271.82) and 89 EMA ($2,586.71), indicating that the asset is deeply undervalued relative to its historical moving averages.
RSI (14): At 39.7, the RSI confirms the undervaluation thesis. It is bouncing off oversold territory and beginning to trend upward, a leading indicator of returning momentum.
Derivatives Context: The OI of $4.61B with an L/S ratio of 1.903 indicates that traders are piling into long positions, confident in ETH's ability to catch up to the broader market rally.
Solana: Searching for Direction
Solana Technical Structure
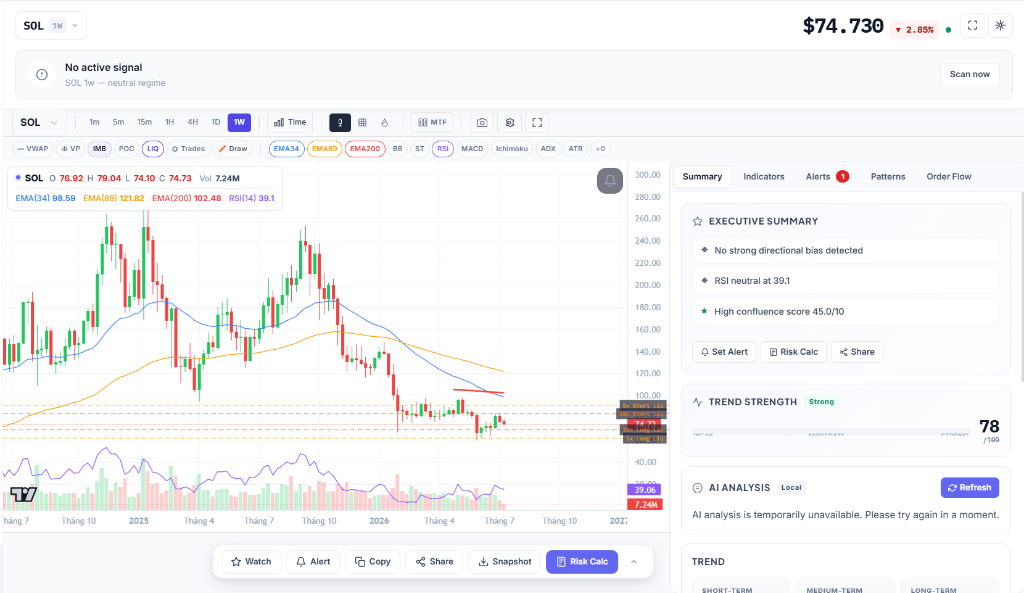
Live Price: $76.33 (+2.4% 24h, -0.1% 7d)
Weekly Close (Wk 30): $74.73 (-2.85%)
Market Cap: $44.5 Billion
Executive Summary: No strong directional bias detected.
Trend Strength: Strong (78/100)
Confluence Score: 45.0/10
Derivatives: OI at $656.5M, Funding 0.01%, L/S Ratio 2.529
Advanced Technical Deep Dive
Solana had a slight pullback this week, reflecting a brief pause in its otherwise dominant year, though it is attempting to recover (live at $76.33).
EMA Analysis: SOL is trading below all major EMAs (34 EMA at $98.59, 89 EMA at $121.82, 200 EMA at $102.48). This positioning highlights a short-term bearish structure within a broader macro uptrend.
RSI (14): The RSI at 39.1 is hovering in no-man's land. It lacks the momentum to push higher immediately but isn't low enough to trigger an automatic oversold bounce.
Derivatives Context: Interestingly, SOL boasts the highest L/S ratio among the majors at 2.529. This shows extreme retail confidence, though the relatively low OI ($656.5M) suggests institutional capital is waiting on the sidelines for confirmation.
Top 11 Alpha Signals from CoinXSight's AI Scanner
Our AI Scanner continues to identify high-probability setups. Crucially, all 11 signals generated this week are LONG, representing 100% bullish conviction. The pattern distribution is heavily dominated by Wyckoff Spring patterns (5 out of 11), suggesting a market-wide accumulation phase where smart money is stepping in.
Symbol
Signal Type
Pattern Name
Confluence
Entry Price
TP1
Stop Loss
RSI(14)
Date
XEC
LONG
Double Bottom
70
$0.0000068
$0.00000781
$0.00000604
50.0
2026-07-16
JST
LONG
Wyckoff Spring + No Supply
70
$0.100
$0.1034
$0.0953
50.0
2026-07-15
SKL
LONG
Triple Bottom
65
$0.00478
$0.00530
$0.00439
50.0
2026-07-16
USDE
LONG
Wyckoff Spring + No Supply
60
$1.0004
$1.0170
$0.9790
50.0
2026-07-13
ICP
LONG
Wyckoff Spring + No Supply
60
$2.271
$2.361
$2.215
50.0
2026-07-12
BTC
LONG
Falling Wedge
55
$62,274
$65,792
$59,636
50.0
2026-07-13
FF
LONG
Double Bottom
50
$0.07215
$0.07688
$0.06860
50.0
2026-07-15
IOTA
LONG
Double Bottom
50
$0.0412
$0.04313
$0.03975
50.0
2026-07-11
XPL
LONG
Wyckoff Spring + No Supply
45
$0.08971
$0.09527
$0.08820
50.0
2026-07-13
POL
LONG
Inverse H&S
45
$0.07953
$0.08235
$0.07741
50.0
2026-07-10
JTO
LONG
Wyckoff Spring + No Supply
45
$0.6228
$0.6745
$0.5970
50.0
2026-07-15
KEY INSIGHT: Pattern distribution across both weeks reveals that "Wyckoff Spring + No Supply" patterns (13 signals total across the ecosystem) and "Double Bottom" (5 signals) are the dominant formations. This is textbook bottoming behavior where supply is constrained while whales accumulate.
Our on-chain data for Week 30 reveals staggering volume rotations, with whales making colossal moves in USD value, primarily focused around meme coins and major liquidations.
Key Whale Transactions (Top Moves by USD Value)
SHIRO Withdrawal ($380.9B): A singular, massive exchange withdrawal of SHIRO tokens valued at $380.9 billion USD. This unprecedented movement suggests an extreme consolidation of supply into cold storage by a mega-whale or protocol treasury.
TROLL Withdrawal ($272.3B): Similar to SHIRO, a single transaction moved $272.3 billion USD worth of TROLL off exchanges, indicating an extreme hold-mentality taking over the meme sector.
MOG Activity ($199.4B Deposit / $142.8B Withdrawal): Extreme volatility in MOG as whales actively trade, depositing $199.4B and withdrawing $142.8B, pointing to heavy OTC or market-maker activity.
LADYS ($91.7B) & WOJAK ($88.7B) Withdrawals: Combined, these represent over $180 billion exiting exchanges across multiple transactions, further confirming the massive accumulation trend in speculative assets.
BTC Selling Pressure ($1.0B Deposit): Over 12 transactions, $1.0 billion in BTC was deposited onto exchanges. This localized selling pressure explains the heavy resistance Bitcoin faced around the $63,000 mark before breaking higher.
USDS Transfers ($100.2M): 79 transactions moving $100.2 million in USDS highlight steady stablecoin repositioning to fuel future acquisitions.
[!IMPORTANT]
The colossal withdrawals of SHIRO, TROLL, LADYS, and WOJAK actively remove liquid supply from the market at a time when macro tailwinds are increasing demand. This supply/demand imbalance in the high-beta speculative sector is the core driver of structural bull markets and retail frenzy.
Week Ahead: Probability-Weighted Scenarios
Scenario A: The Macro Breakout (55% Probability) — Base Case
Triggers: The July 30 Fed meeting narrative continues to dominate; tech earnings come in strong, boosting the Nasdaq and dragging crypto higher.
Price Targets: BTC maintains its break above $65,000 and targets the $68,000 psychological barrier. ETH reclaims $2,100. SOL bounces back above $85.
Strategy: Maintain spot exposure. Look for entries on the alpha signals provided (particularly JST and SKL) as they will likely outperform during a broad market rally.
Triggers: Market participants decide to wait for the actual Fed meeting before committing further capital; summer doldrums suppress volume.
Price Ranges: BTC grinds between $62,000 – $65,500. ETH stuck in the $1,850 – $2,000 range. SOL chops between $72 – $80.
Strategy: Employ range-trading strategies. Sell the top of the range and buy the bottom. Be wary of false breakouts and rely heavily on mean reversion.
Triggers: Unexpected hawkish rhetoric from Fed officials attempting to temper expectations; a sudden spike in the DXY; or unexpected regulatory news.
Price Levels: BTC flushes down to test the $59,000 support. ETH breaks down toward $1,750. SOL dips to the $68 region.
Strategy: Ensure stop-losses are strictly adhered to. Do not attempt to catch falling knives. Wait for the market to establish a new bottom before re-entering leveraged longs. Treat spot drops as generational buying opportunities given the macro backdrop.
FAQ
Why is the Fed rate cut probability at 82% so important for Bitcoin?
Bitcoin is heavily influenced by global liquidity. When the Federal Reserve cuts interest rates, it lowers the cost of borrowing and injects liquidity into the financial system. This excess capital naturally flows outward on the risk curve, eventually finding its way into high-beta assets like Bitcoin. The market front-runs this event, which is why we see price appreciation before the cut actually happens.
What does "Wyckoff Spring + No Supply" mean in the Alpha Signals?
A Wyckoff Spring is a technical pattern that occurs at the end of an accumulation phase. It involves a brief, sharp drop below a known support level to trigger stop-losses. The "No Supply" aspect means that when the price drops, trading volume dries up completely — showing that sellers are exhausted and there is no more supply available. Smart money absorbs this, leading to a rapid price recovery.
The RSI for BTC, ETH, and SOL is all in the 30s. Is this a bad sign?
No, quite the opposite on longer timeframes. An RSI in the 30s (approaching the oversold threshold of 30) indicates that the asset has experienced significant downward pressure but is now potentially exhausted. It means there is a massive amount of "room to run" upward before the asset becomes overbought (RSI > 70). It signals undervaluation, not permanent weakness.
How should I interpret the massive meme coin whale withdrawals?
The multi-billion dollar withdrawals of tokens like SHIRO and TROLL from exchanges to cold storage mean that major holders are locking up their assets. When supply is removed from exchanges, any subsequent buying pressure causes disproportionately large price spikes. This is a highly bullish signal for the speculative sectors of the market.
Disclaimer
This analysis is for educational purposes only and does not constitute financial advice. Cryptocurrency trading involves high risk. Conduct your own research and consult a licensed financial advisor before making any investment decisions.
All alpha signals, price targets, and trading strategies discussed are based on technical analysis and historical patterns. They do not guarantee profits and may result in losses. Only invest capital you can afford to lose completely. The Fear & Greed Index data is sourced from Alternative.me. Market data sourced from CoinXSight's analytics platform.
Last Updated: July 17, 2026
AT
Alex Thorne
MACRO // LEAD
Head of Macro & Market Structure·Global Macro Desk
Former institutional FX and macro derivative analyst. Specializes in global liquidity cycles, central bank balance sheets, and crypto market microstructure.
QUANTITATIVE SUITE // DEEP ALPHA ENGINEACTIVE
BTC/USDT // LIVE SCANNER
CONFLUENCE 28
LIVE SPOT PRICE$82,820.01NO_TRADE
TP2
$87,960.97
+7.17%
TP1
$84,431.71
+2.87%
ENTRY
$82,078.87
ZONE
SL
$80,902.44
-1.43%
Auto-detect Order Blocks, Fair Value Gaps and risk-adjusted DCA ladders in < 5s.