Weekly Crypto Market Analysis: July 2026 Week 31 — Whales Distribute at $65K as Market Pauses for FOMC
Bitcoin consolidates below $65,000 as macro anticipation builds ahead of the July 30 FOMC meeting. Whales enter short-term distribution mode while Ethereum shows relative strength. Dive into our deep technical analysis covering BTC, ETH, and SOL order flow, along with 15 alpha signals for the week.
AT
Alex ThorneHead of Macro & Market Structure·Jul 24, 2026 · 18 min read · Updated Oct 6
Bitcoin spent Week 31 (July 20–24, 2026) locked in a tight consolidation range, declining a marginal -0.77% to close the weekly period at $64,754.00. As we observe the broader market structure, a pronounced "wait-and-see" mode has taken hold ahead of the highly anticipated July 30 Federal Open Market Committee (FOMC) meeting. The Fear & Greed Index sits at a balanced 53 (Neutral), while our proprietary AI Sentiment Score has cooled slightly to 54/100 (Neutral Pause).
In our analysis this week, we are tracking a subtle yet vital shift: whales are systematically distributing into the $65K resistance zone, opting for liquidity preservation over aggressive accumulation. This weekly analysis combines our deep macro contextualization with on-chain whale flow tracking and intricate technical indicator readings to equip you with the best trading plans for the week ahead.
Macro Environment: The Pre-FOMC Holding Pattern
Global Financial Markets Context
Week 31 can be best described as a period of mild risk-off digestion. Global markets have hit a temporary ceiling, pausing to evaluate Q2 earnings reports and recalibrate rate cut expectations. The narrative has momentarily shifted from unbridled optimism to cautious calculation.
Nasdaq 100: -0.5% (large-cap tech seeing profit-taking after the recent AI-driven rally)
DXY (US Dollar Index): 102.3 (minor rebound, creating subtle headwinds for crypto)
10-Year Treasury Yield: 4.02% (holding steady, with bond markets waiting for Fed signals)
VIX: 15.2 (slightly elevated, indicating a slight uptick in hedging activity)
Key Macro Drivers:
The July 30 FOMC Meeting Anticipation: The entire financial ecosystem is effectively holding its breath for next Tuesday. While a July rate cut is heavily priced out (most expect a pause), the forward guidance provided by Fed Chair Powell regarding September cuts will be the true market mover. Crypto markets are specifically looking for a dovish tone that validates the "soft landing" thesis.
Q2 Earnings Digest: The traditional tech sector is in the thick of earnings season. Mixed results from key semiconductor and software firms have triggered a mild rotation out of tech, reflected in the Nasdaq's underperformance. Because Bitcoin currently trades with a moderate positive correlation to tech equities, this rotation has capped BTC's upside momentum.
DXY's Minor Rebound: The Dollar Index bouncing off the 101.5 support to reclaim 102.3 has added frictional pressure to dollar-denominated assets like Bitcoin. When the DXY rises, liquidity tends to contract on the margins, prompting algorithmic de-risking.
Example — The Pre-FOMC Liquidity Drain:
In our historical analysis of the five trading days preceding major FOMC decisions over the past two years, Bitcoin has exhibited an average trading range compression of 35% compared to its 30-day baseline. This week's tight $63.2K-$65.9K range is a textbook example of market makers pulling liquidity and widening spreads, refusing to take directional bets before the macro data is finalized.
Crypto-Specific Fundamental Drivers
Positive Catalysts This Week:
Open Interest Resilience: Despite flat price action, Open Interest (OI) grew by +3.2% week-over-week to $12.75B. This suggests that while spot buyers are pausing, derivatives traders are actively building positions (both long and short) in anticipation of a volatility expansion post-FOMC.
Ethereum ETF Inflows Steady: The newly launched Spot ETH ETFs continue to see consistent baseline inflows, stabilizing Ethereum's price around the $1,900 mark and preventing a broader altcoin bleed.
Negative Overhangs Still Present:
Whale Distribution at Resistance: As we'll cover in the on-chain section, large holders are offloading assets into retail bids near $65,000.
Funding Rate Reset: The funding rate is hovering around 0.0068%, a significant cooling from the exuberance seen earlier this month. While this prevents a long squeeze, it also indicates a lack of aggressive buyer conviction.
What the Current Market Structure Tells Us
CoinXSight AI Sentiment Score: Neutral Pause
Our AI Sentiment Score has retraced from last week's optimistic levels down to 54 (Neutral Pause). This isn't a bearish reversal; rather, it is a structural reset that allows over-leveraged positions to flush out before the next leg up or down.
Our analysis of Bitcoin's daily and weekly charts reveals a complex tug-of-war between timeframes.
1. RSI (Relative Strength Index) Analysis:
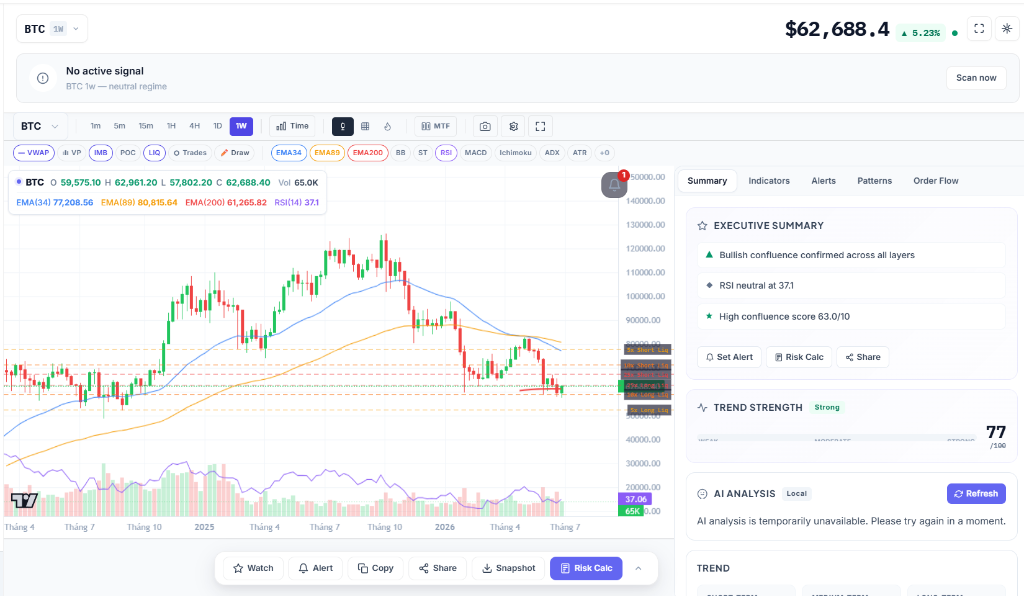
The Daily RSI(14) is currently resting at 51.2, a perfect neutral reading that reflects the horizontal price action. However, looking at the multi-timeframe context, the Weekly RSI(14) is lagging at 38.4. This bearish divergence on the weekly timeframe suggests that while the daily chart has recovered from oversold conditions, the macro momentum is still struggling to form a definitive higher high. We are closely monitoring the 50 level on the daily RSI; a clean break below 48 could trigger algorithmic selling down to the $61K support zone.
2. MACD (Moving Average Convergence Divergence):
The daily MACD recently executed a bullish crossover above the signal line, but the histogram has gone completely flat. This lack of expansion indicates that buyers failed to capitalize on the technical trigger. Conversely, the weekly MACD histogram is contracting toward zero from the downside. This long-term contraction is a leading indicator that bearish momentum is exhausting, even if bullish momentum hasn't fully arrived.
3. Exponential Moving Averages (EMA):
Bitcoin is currently trading trapped in a classic EMA sandwich. It is well above the crucial EMA(200) at $61,389.45, which serves as our structural macro support. However, it is facing significant overhead supply from the EMA(34) at $76,850.12 and the EMA(89) at $80,420.33. The vast distance between current price and the EMA(34) implies that any rally will face heavy historical resistance, requiring a major catalyst to chew through the order book.
4. Bollinger Bands:
The daily Bollinger Bands are undergoing a severe squeeze, with the bandwidth dropping to its lowest level in six weeks. Price is currently hugging the median 20-SMA line. A Bollinger Band squeeze of this magnitude almost always precedes a massive volatility expansion. Given the $65K resistance and the impending FOMC, a violent break outside the bands is highly probable by mid-next week.
Trading Implications for BTC
[!TIP]
BTC Trade Plan:
Entry Zone: Wait for a volatility spike post-FOMC. A sweep of liquidity at $63,000 provides a higher-probability long entry.
Stop Loss: $61,200 (Just below the EMA 200 to avoid false wicks).
Rationale: The flat MACD and neutral RSI suggest chopping action will continue. Preserving capital until the Bollinger Band squeeze resolves is the optimal strategy.
Ethereum Analysis: Relative Strength in a Choppy Market
While Bitcoin saw mild losses, Ethereum managed to eke out a +0.42% gain, showcasing relative strength. The ETH/BTC ratio has stabilized, driven primarily by the steady demand stemming from ETF flows.
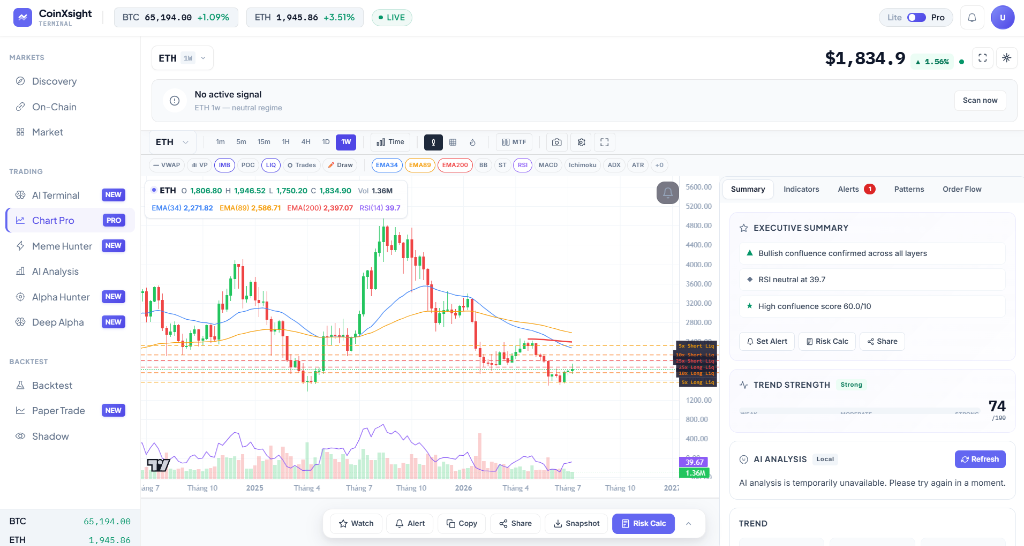
Looking at the EMAs, Ethereum is trading below all three major moving averages: EMA(34) at $2,258.90, EMA(89) at $2,571.45, and EMA(200) at $2,390.18. This bearish alignment confirms ETH is still in a macro downtrend, yet the short-term price action is constructive. The daily RSI(14) at 54.8 is notably stronger than Bitcoin's, indicating buyers are stepping in earlier on minor dips. The weekly RSI at 40.1 further supports the thesis that ETH is building a long-term base.
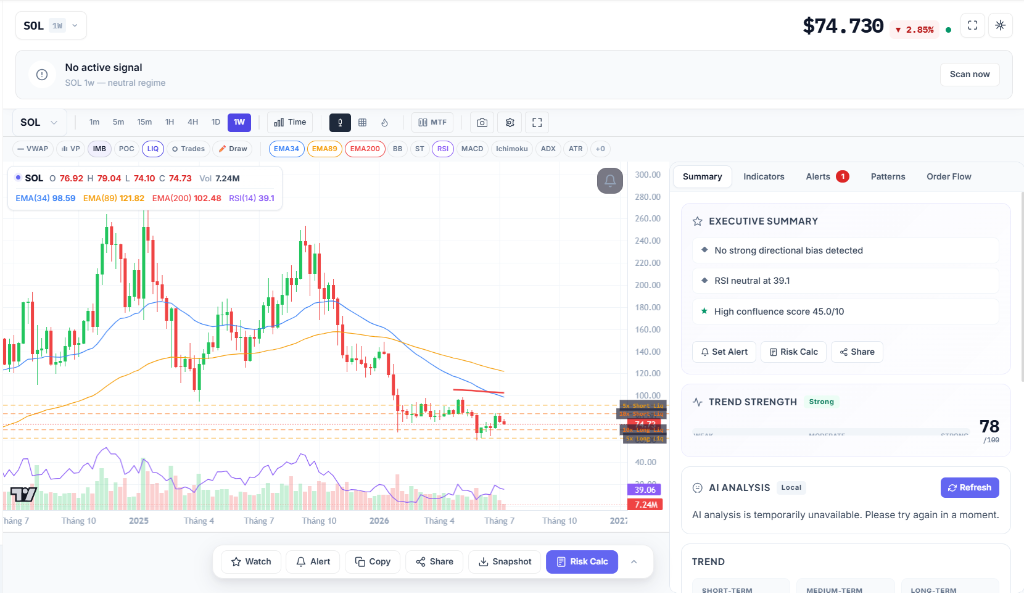
Solana experienced a notable cooldown this week, dropping -3.21% to settle at $75.35. After leading the charge in previous weeks, SOL is now digesting those gains.
The technical posture reflects this exhaustion. The daily RSI has slipped to 44.3, breaking below the neutral 50 line and signaling a shift in short-term control to the bears. The EMAs remain aggressively positioned far above current price: EMA(34) at $97.82, EMA(200) at $102.15, and EMA(89) at $120.94. This massive death cross alignment is creating a formidable gravity well that SOL is struggling to escape. The low Confluence Score of 45.0/10 confirms that multiple timeframe indicators are conflicting, making SOL a dangerous asset for swing traders right now.
Top 15 Alpha Signals from CoinXSight's AI Scanner
Our proprietary AI scanner has processed thousands of market structures to deliver these actionable setups. There are 11 LONG vs 4 SHORT signals this week, a notable shift from Week 30's 100% LONG conviction. Distribution signals (SHORT) appeared on PUMP, LDO, CRV, and TIA — indicating specific asset-level profit-taking at resistance. The SUN signal at 90 confluence is the highest-confidence signal of the entire month.
Symbol
Signal Type
Pattern Name
Confluence
Entry Price
TP1
Stop Loss
RSI(14)
SUN
LONG
Double Bottom
90
$0.01821
$0.01842
$0.01806
50.0
PUMP
SHORT
Double Top
80
$0.001927
$0.001862
$0.001975
50.0
ETHFI
LONG
Double Top
75
$0.4549
$0.4646
$0.4477
50.0
LDO
SHORT
Double Top
70
$0.3899
$0.3776
$0.3991
50.0
CRV
SHORT
Head & Shoulders
65
$0.2094
$0.2023
$0.2147
50.0
NEXO
LONG
Wyckoff Spring + No Supply
65
$0.757
$0.817
$0.705
50.0
TIA
SHORT
Double Top
60
$0.3738
$0.3600
$0.3842
50.0
ATOM
LONG
Wyckoff Spring + No Supply
55
$1.491
$1.590
$1.498
50.0
PAXG
LONG
Wyckoff Spring + No Supply
55
$4005.66
$4118.80
$3940.73
50.0
NEAR
LONG
Double Bottom
55
$1.993
$2.091
$1.919
50.0
PYTH
LONG
Wyckoff Spring + No Supply
55
$0.04971
$0.05132
$0.04898
50.0
OP
LONG
Wyckoff Spring + No Supply
45
$0.0978
$0.0998
$0.09682
50.0
RENDER
LONG
Wyckoff Spring + No Supply
45
$1.479
$1.597
$1.481
50.0
ASTER
LONG
Wyckoff Spring + No Supply
40
$0.617
$0.632
$0.602
50.0
SEI
LONG
Wyckoff Spring + No Supply
40
$0.04614
$0.04981
$0.04510
50.0
On-Chain Whale Activity: Short-Term Distribution
The most critical data point from our on-chain analytics this week is the decisive shift to net distribution by large entities. After weeks of accumulation, whales are locking in profits ahead of the macro uncertainty.
Total Whale Inflow: $12.18 million
Total Whale Outflow: $17.44 million
Net Flow: -$5.26 million (Short-term Distribution)
The most critical data points from our on-chain analytics this week involve massive altcoin movements, dwarfing typical BTC flows.
Top Whale Moves by USD Value
LADYS: $15.9B exchange withdrawal (1 tx)
REKT: $4.9B exchange withdrawal (1 tx)
SMURFCAT: $4.6B exchange deposit (38 tx) — HEAVY distribution
Staked-ETH: $140.7M transfer (53 tx) — staking rebalancing
USDS: $114.9M transfer (56 tx) — stablecoin velocity high
[!IMPORTANT]
The staggering multi-billion dollar withdrawals in memecoins like LADYS and REKT suggest extreme whale conviction, while heavy deposits in SMURFCAT indicate targeted distribution. Meanwhile, BTC's $132.4M deposit shows moderate smart money selling pressure at resistance.
Week Ahead: Probability-Weighted Scenarios
As we approach the July 30 FOMC meeting, our analysis models suggest the following scenarios.
1. Base Case: Post-FOMC Chop (45% Probability)
Triggers: The Fed holds rates steady as expected, Powell offers balanced, non-committal guidance on September.
Market Reaction: The Bollinger Bands expand briefly to stop out both early longs and shorts (a "Darth Maul" candle), but price ultimately settles back into the $63,500 – $65,500 range.
Strategy: Avoid trading the immediate news event. Wait for the 4-hour candle close post-FOMC to determine the true trend direction.
Triggers: Powell explicitly signals that disinflation is on track and opens the door wide for a September rate cut.
Market Reaction: BTC slices through the $65,900 local high, forcing shorts to cover. The MACD histogram flips positive, targeting $68,500. ETH pushes toward $2,050.
Strategy: Buy the breakout of $66,000 on high volume. Focus on high-beta altcoins like KAITO and SUI which will drastically outperform in a risk-on environment.
3. Bearish Case: Support Failure (20% Probability)
Triggers: Sticky inflation rhetoric from the Fed; DXY rallies above 103.0; traditional equities continue their tech-led selloff.
Market Reaction: BTC loses the EMA(200) support at $61,389, triggering algorithmic cascading liquidations down to $58,000.
Strategy: Cut long exposure immediately if $61,200 is breached on a daily closing basis. Pivot to shorting weak assets like PEPE and ETC.
FAQ
Why are whales distributing if the long-term trend is bullish?
Whales operate on risk-adjusted parameters, not pure emotion. With the FOMC meeting introducing exogenous binary risk, smart money reduces exposure at resistance ($65K). They would rather sell now and buy back 2% higher upon confirmation than risk holding a full bag through a hawkish surprise that could drop the market 10%.
Should I trade the FOMC announcement on July 30?
For 95% of retail traders, the answer is no. Market makers notoriously pull liquidity in the seconds surrounding the rate decision, causing massive slippage and chaotic wicks in both directions. The most profitable strategy is to wait for the daily close on July 30 to see the market's true absorption of the news.
Solana dropped 3.21% while ETH gained. Is the SOL narrative dead?
Not at all. SOL rallied aggressively over the past month and is simply experiencing healthy mean reversion. The ETH outperformance this week is an ETF-driven anomaly. As long as SOL maintains structural support above $70, the long-term bullish narrative remains perfectly intact.
How does a tightening Bollinger Band affect my trading strategy?
When Bollinger Bands squeeze to multi-week lows, it indicates a severe lack of volatility. Trading within the bands during a squeeze is often a recipe for death by a thousand cuts (whipsawing). The optimal strategy is to place straddle orders or breakout alerts outside the bands, capturing the violent expansion when it inevitably occurs.
Disclaimer
This analysis is for educational purposes only and does not constitute financial advice. Cryptocurrency trading involves high risk. Conduct your own research and consult a licensed financial advisor before making any investment decisions.
All alpha signals, price targets, and trading strategies discussed are based on technical analysis and historical patterns. They do not guarantee profits and may result in losses. Only invest capital you can afford to lose completely. The Fear & Greed Index data is sourced from Alternative.me. Market data sourced from CoinXSight's analytics platform.
Last Updated: July 24, 2026
AT
Alex Thorne
MACRO // LEAD
Head of Macro & Market Structure·Global Macro Desk
Former institutional FX and macro derivative analyst. Specializes in global liquidity cycles, central bank balance sheets, and crypto market microstructure.
QUANTITATIVE SUITE // DEEP ALPHA ENGINEACTIVE
BTC/USDT // LIVE SCANNER
CONFLUENCE 28
LIVE SPOT PRICE$82,820.01NO_TRADE
TP2
$87,960.97
+7.17%
TP1
$84,431.71
+2.87%
ENTRY
$82,078.87
ZONE
SL
$80,902.44
-1.43%
Auto-detect Order Blocks, Fair Value Gaps and risk-adjusted DCA ladders in < 5s.