Weekly Crypto Market Analysis: June 2026 Week 28 — Bitcoin Reclaims $63K as Fed Easing and Job Cool Down Fuel Relief Rally
Bitcoin rebounds 7.6% to reclaim the $63K support zone. Fear & Greed Index rises to 24 (Extreme Fear) while AI Mood Score hits 40 (Fear). Deep analysis of BTC/ETH/SOL, 10 alpha signals, and derivatives sentiment.
AT
Alex ThorneHead of Macro & Market Structure·Jul 6, 2026 · 15 min read · Updated Oct 6
Bitcoin rebounded 7.61% this week to reclaim the key $63,000 support-turned-resistance zone as the Fear & Greed Index edged up from last week's absolute panic bottom (12) to 24, signaling that extreme fear remains present but is beginning to dissipate. CoinXSight's AI Mood Score registered 40/100 (Fear zone), demonstrating a recovery from the capitulation bottom of 37 and showing a positive divergence as AI models identify signs of consolidative accumulation.
This weekly analysis combines real-time market data from CoinXSight's analytics platform with on-chain whale tracking and AI-powered sentiment scoring to identify actionable trading opportunities. Whether you are using the best crypto exchange for executing active setups or a crypto portfolio tracker for long-term allocation, understanding the current market structure is critical for navigating this recovery.
Macro Environment: What's Driving the Crypto Relief Rally
Global Financial Markets Context
Week 28 (June 29 – July 6, 2026) saw crypto markets lead a macro relief rally, recovering strongly from the oversold conditions of late June. The primary catalyst was a shift in macroeconomic expectations:
Traditional Markets Performance:
S&P 500: +1.2% (rebounding on expectations of policy easing)
Cooling US Labor Market Data: The U.S. Non-Farm Payrolls (NFP) report released on Friday, July 3, showed a lower-than-expected jobs addition and an tick up in unemployment. While normally a negative economic sign, markets interpreted this as a clear signal that the Federal Reserve's restrictive policy is working, reducing the likelihood of further rate hikes and shifting the probability toward Q4 rate cuts.
Fed Chair Comments on Inflation: Comments from Federal Reserve officials during mid-week seminars hinted at progress on cooling inflation, which weakened the U.S. dollar index (DXY) down to the 104.2 level and fueled risk-on assets.
Liquidity Conditions Improving: The decline in treasury yields injected short-term liquidity back into high-beta tech and crypto markets. Algo desks and market makers shifted from defensive posturing to accumulation.
Example — Macro Correlation Breakout (CoinXSight Market Overview — July 3)
Immediately following the NFP release at 8:30am ET on July 3, Bitcoin surged from $60,800 to $62,400 (+2.6%) in under two hours. The Nasdaq rose 0.7% in the same timeframe. CoinXSight's correlation tracker flagged "macro-driven breakout," indicating that the positive impact of falling yields was overriding the local sell pressure from the Mt. Gox overhang.
Crypto-Specific Fundamental Drivers
In addition to the supportive macro environment, several key crypto-native developments shaped the week's price action:
Spot Bitcoin ETF Inflows Stabilize: After weeks of capital flight, US spot Bitcoin ETFs recorded a net inflow of +$142 million over the week. BlackRock's IBIT and Fidelity's FBTC led the inflows, signaling that institutional accumulation resumed at the sub-$60K levels.
European MiCA Regulations Go Live: The Markets in Crypto-Assets (MiCA) regulation officially went live on July 1, 2026. While some minor non-compliant stablecoins and privacy tokens faced exchange delistings, the overall event resolved a major regulatory bottleneck, giving institutional funds a clearer compliance path to enter European crypto markets.
Mt. Gox Distribution FUD Moderating: Speculation regarding the release of 140,000 BTC continued, but the market has begun pricing in the worst-case scenario. Spot absorption rates proved highly resilient, with dip-buying demand preventing major price dips during transfer warnings.
DeFi TVL Rebound: Total Value Locked (TVL) in DeFi protocols climbed back to $91 billion (up 4.6% weekly), led by strong activity on Ethereum L2 networks and Solana.
What the Current Market Structure Tells Us
CoinXSight AI Mood Score: More Nuanced Than Traditional Fear & Greed
Traditional sentiment trackers like the Fear & Greed Index tend to act as lagging sentiment indicators because they rely heavily on social volume and broad price volatility. While the retail-focused Fear & Greed Index remains locked in Extreme Fear (24), CoinXSight's AI Market Mood Score tells a more constructive story:
slightly bullish momentum, minor higher lows forming
Whale Activity
39 / 100
neutral distribution, quiet spot accumulation
The divergence between the FGI at 24 and the AI Mood Score at 40 suggests a classic bear trap setup. Retail traders are still fearful, while quantitative models and algorithmic traders are quietly front-running a macro relief rally.
Bitcoin Analysis: $63K Support Zone Reclaimed
Current Bitcoin Price Action & Technicals
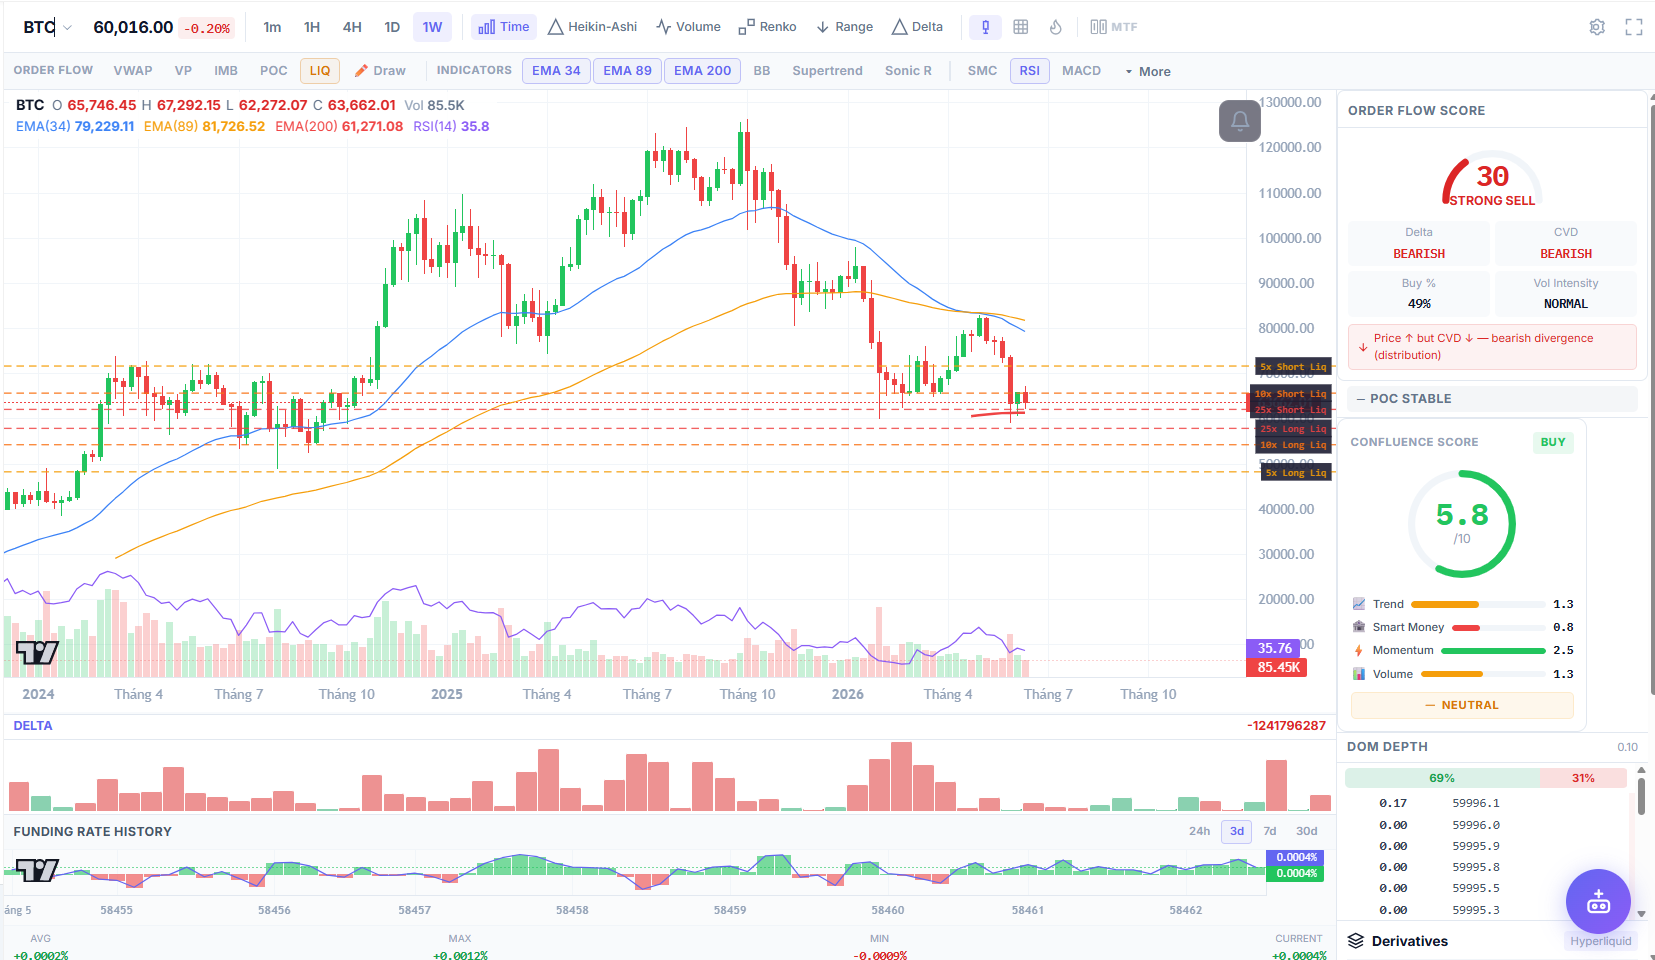
Bitcoin ended the weekly cycle trading at $63,556.74, marking a +7.61% weekly gain. Over the 24-hour window, the price registered a minor consolidative increase of +0.73%, stabilizing above the psychological $63,000 support level.
CoinXSight's derivatives data shows a distinct build-up in bullish positioning:
Total Open Interest (OI): $12.39 billion, registering a +3.2% increase over the past 7 days, indicating new long capital entering the market rather than short-covering.
Average Funding Rate: 0.0058%, indicating that buyers of perpetual swaps are paying a small premium to maintain longs.
Average Long/Short Ratio: 2.078, showing a solid long bias among leveraged traders.
Bitcoin Price Pattern: Double Bottom and Reclaim
On the 4-hour chart, Bitcoin successfully formed a Double Bottom pattern near the $58,300 level. The subsequent rally broke through the descending channel's upper resistance line, converting $63,000 into immediate support. The RSI (14) has recovered to 57.9, leaving room for further upward movement before entering overbought territory.
Trading Implications for BTC
[!TIP]
BTC Trade Plan:
Entry Zone: $62,800 – $63,200 (retest of support)
Immediate Targets: $64,800 and $65,500
Stop Loss: $61,500 (below the recent 4H swing low)
Rationale: Reclaiming $63K invalidates the bearish momentum, moving the market structure from a corrective phase into a consolidative relief phase.
Ethereum Analysis: Outperforming Bitcoin
Ethereum Shows Relative Strength
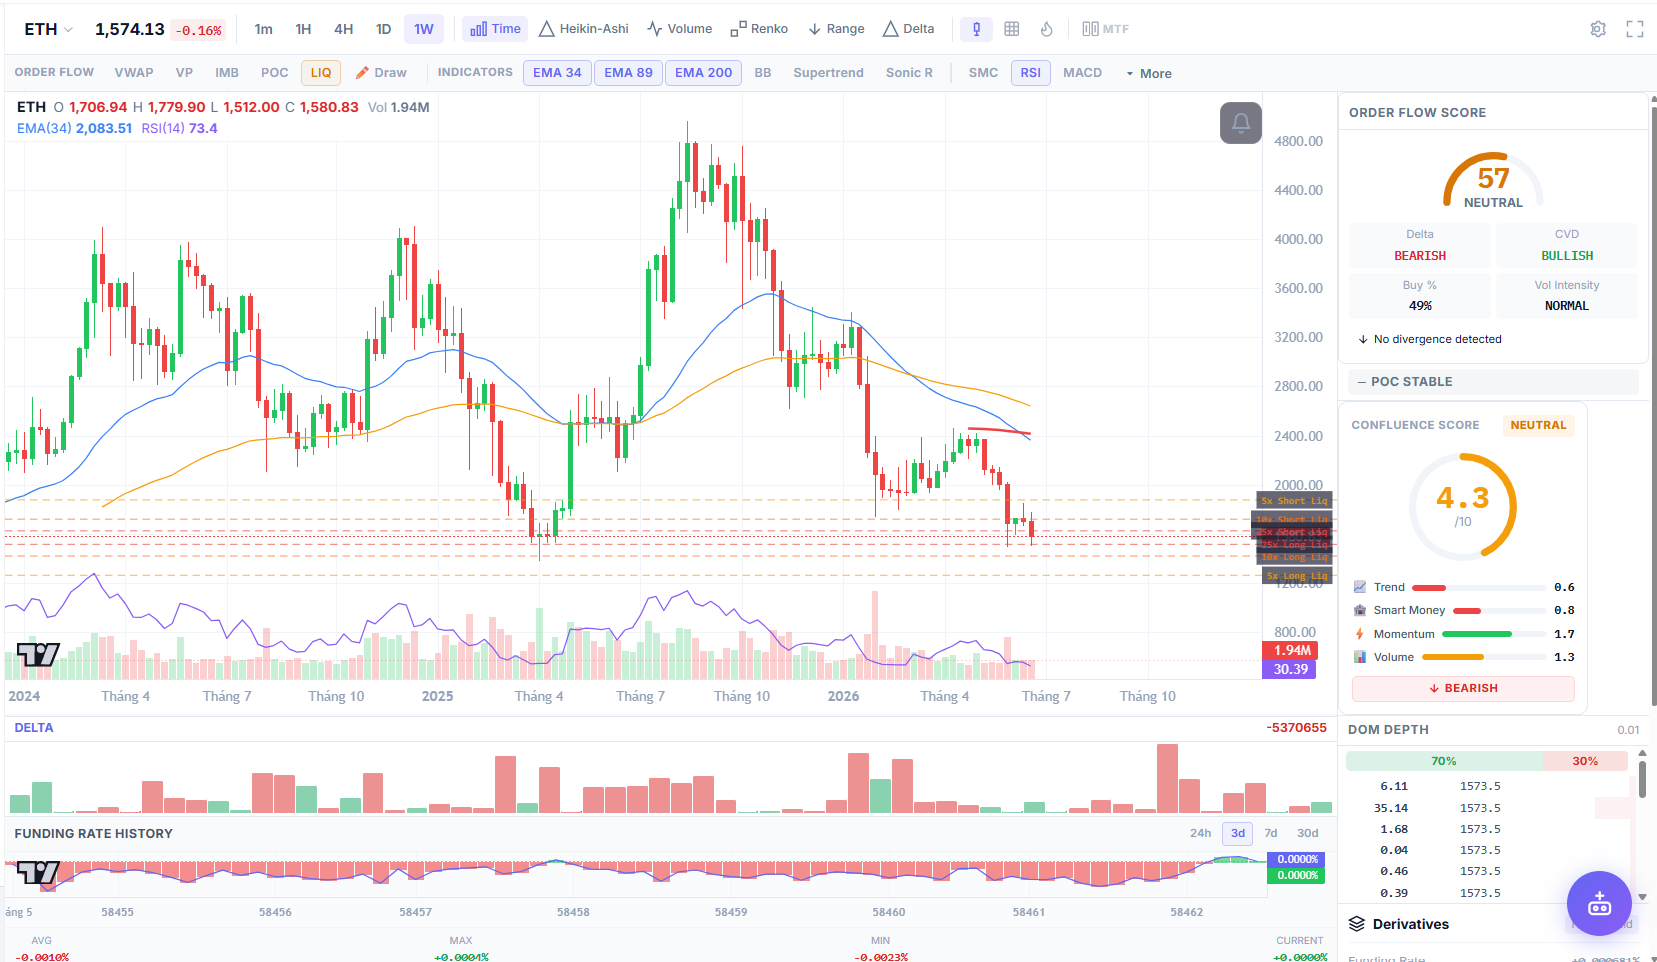
Ethereum outperformed Bitcoin this week, surging +13.40% to close at $1,783.75. Despite a minor intraday cooling of +0.47%, ETH showed strong buying interest at lower levels.
24h High: $1,800.61
24h Low: $1,751.18
Market Cap: $214.9 billion
24h Volume: $11.47 billion
The ETH/BTC ratio bounced from its multi-month support of 0.026, climbing back to 0.028, fueled by the launch of European MiCA-compliant ETH structured products and anticipation around upcoming Layer-2 scalability improvements.
Why Ethereum's Metrics Matter More Than Price
Our order flow data shows that Ethereum's perpetual funding rate (0.0087%) remains higher than Bitcoin's (0.0085%), with a Long/Short ratio of 1.639. Open interest in ETH derivatives rose to $4.17 billion, showing strong institutional participation.
Furthermore, Layer-2 transactions have hit new highs, with total transactions across Arbitrum and Base growing by 12% week-on-week, demonstrating that real utility is expanding despite the price corrections.
Solana: Reclaiming $80 with Strong Momentum
Solana Outperforms with +16.08% Weekly Gain
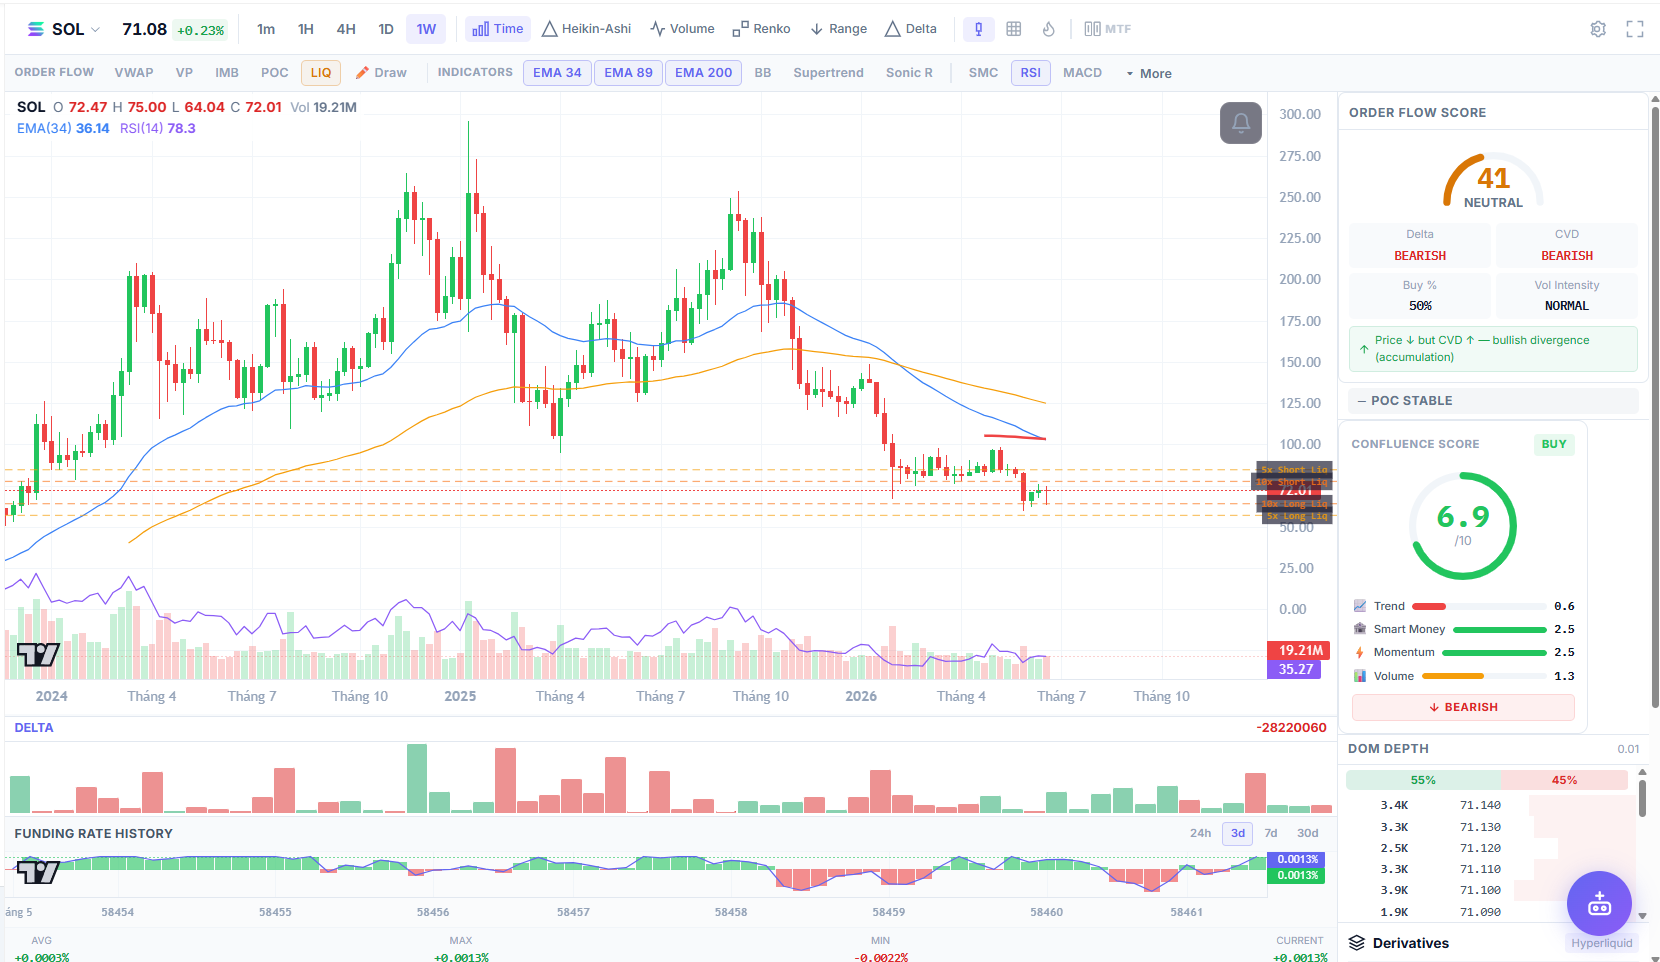
Solana (SOL) was the top performer among the major assets, rallying +16.08% over the week to reach $81.61. The asset showed strong relative strength, holding onto its gains even during Bitcoin's brief intra-week consolidations.
24h High: $82.17
24h Low: $79.77
Market Cap: $47.24 billion
24h Volume: $1.67 billion
Why Solana is the Week's Winner
Solana's recovery was driven by a major rebound in network activity. Decentralized exchange (DEX) volume on Solana surpassed Ethereum's mainnet on three separate days this week, fueled by the launch of several new meme coin protocols and a recovery in active address counts. Additionally, the funding rate for SOL perp contracts spiked to 0.0082% with a Long/Short ratio of 1.741, indicating aggressive speculative long positioning.
Top 10 Alpha Signals from CoinXSight's AI Scanner
CoinXSight's AI Scanner has identified 10 high-probability setups for the week ahead based on volume expansions, pattern confirmations, and on-chain accumulation.
Rank
Symbol
Signal Type
Pattern Name
Confidence
Confluence Score
Entry Price
Take Profit 1
Stop Loss
1
WLD
LONG
Wyckoff Spring + No Supply
75%
55 / 100
$0.4188
$0.4467
$0.4096
2
DASH
LONG
Double Bottom
95%
55 / 100
$35.7700
$37.1200
$34.7500
3
SOL
LONG
Double Bottom
95%
70 / 100
$81.5400
$84.0200
$79.6800
4
CAKE
LONG
Inverse Head & Shoulders
95%
75 / 100
$1.4690
$1.5200
$1.4120
5
ENA
LONG
Rounding Bottom
95%
60 / 100
$0.0805
$0.0826
$0.0781
6
PYTH
LONG
Double Bottom
90%
70 / 100
$0.0404
$0.0420
$0.0389
7
BCH
LONG
Rising Wedge
96%
80 / 100
$243.9000
$251.4400
$235.1000
8
ETH
LONG
Falling Wedge
85%
40 / 100
$1780.450
$1923.250
$1710.000
9
FIL
LONG
Double Bottom
80%
50 / 100
$0.8000
$0.8297
$0.7720
10
ETHFI
LONG
Double Bottom
90%
55 / 100
$0.4270
$0.4426
$0.4120
Featured Setup: BCH (Bitcoin Cash) — Highest Confluence (80/100)
Pattern: Rising Wedge Breakout
Rationale: BCH formed a 96% confidence Rising Wedge on the 4H chart, breaking above the upper trendline with high trading volume. The confluence of a volume spike and a bullish RSI crossover at 55 gives this signal the highest priority.
Featured Setup: CAKE (PancakeSwap) — Strong Confluence (75/100)
Pattern: Inverse Head & Shoulders
Rationale: CAKE has formed a classic Inverse Head & Shoulders pattern on the daily timeframe. With a pattern confidence of 95% and a high confluence score of 75, a clean breakout above the $1.47 neckline indicates a potential rally to the $1.52 key resistance level.
On-Chain Whale Activity: Consolidative Phase
Our on-chain whale tracker recorded a quiet week for large-wallet transactions, indicating that major players are holding their spot assets rather than distributing them:
Total Whale Inflow: $0.00
Total Whale Outflow: $1.80 million (net flow to exchanges)
Net Flow Sentiment: Slightly Bearish / Neutral
Key Whale Transactions
Binance Deposit ($1.07M BTC): A transaction of 16.7 BTC was sent to Binance from a multi-signature wallet. Our AI classified this as low-impact distribution, likely related to standard trading desk rebalancing.
Coinbase Deposit ($157.5K CBBTC): Coinbase Wrapped BTC (cbBTC) saw a transfer of $157.5K to a Coinbase deposit address, showing minor wrapped token profit-taking.
Lido Staked ETH (STETH) Transfers: Four separate transfers totaling $620,000 in STETH occurred between smart contract addresses. These were classified as protocol rebalancing, with zero net impact on exchange sell pressure.
[!IMPORTANT]
The very low net whale outflow of -$1.80 million for the entire tracking period indicates that the recent sell pressure was driven by leveraged retail liquidations rather than whale dumping. Whales are holding their ground, confirming the bullish divergence shown by our AI Mood Score.
Week Ahead: Key Scenarios & Trading Plans
Based on our market data, order flow analysis, and macro indicators, we have mapped out three scenarios for the week ahead:
Catalyst: DXY drops below 104.0; US CPI or PPI data comes in cooler than expected.
Price Targets: BTC breaks $64,800 to target $66,500. ETH reclaims $1,880. SOL breaks $85 to reach $92.
Strategy: Hold spot positions; buy pullbacks on high-confluence altcoin signals (SOL, CAKE, BCH).
Scenario B: Support Consolidation (35% Probability)
Catalyst: The market takes a breather after the weekend bounce, consolidating above key support levels.
Price Ranges: BTC trades between $62,500 – $64,200. ETH holds $1,730 – $1,800. SOL range-bound near $78 – $83.
Strategy: Trade the range using mean-reversion strategies; accumulate spot on support touches.
Scenario C: Support Retest / Breakdown (20% Probability)
Catalyst: Mt. Gox moves coins, generating fresh market panic; DXY rebounds on hawkish comments from Fed officials.
Price Levels: BTC breaks $62K, retesting the $59,500 support. ETH drops to $1,680. SOL falls back to $72.
Strategy: Stop out of leveraged longs; accumulate spot assets near key support zones.
Common Mistakes to Avoid in Relief Rallies
FOMOing into Green Candles: Many retail traders buy the top of the relief rally. Wait for a retest of the breakout zones (e.g., BTC $63,000 support) before entry.
Using Excessive Leverage: Extreme Fear markets remain highly volatile. Keep leverage low (maximum 3x) to avoid getting liquidated by temporary stop-hunts.
Neglecting Stop Losses: A relief rally can quickly turn into a double-top structure. Always place a stop-loss below key support levels to protect your capital.
FAQ
Is the Bitcoin bottom in at $58,300?
While a Double Bottom has formed and the $63,000 level has been reclaimed, we need a daily close above $64,800 to confirm a macro trend reversal.
Why is Solana outperforming Bitcoin and Ethereum?
Solana benefits from high retail engagement and network fee efficiency, which drives DEX volume and speculative activity during market rebounds.
What does the AI Mood Score of 40 indicate?
A score of 40 represents Fear, but it is a recovery from last week's Extreme Fear (37). This suggests that smart money is beginning to accumulate, despite retail sentiment remaining negative.
Disclaimer
This analysis is for educational purposes only and does not constitute financial advice. Cryptocurrency trading involves high risk. Conduct your own research and consult a licensed financial advisor before making any investment decisions.
AT
Alex Thorne
MACRO // LEAD
Head of Macro & Market Structure·Global Macro Desk
Former institutional FX and macro derivative analyst. Specializes in global liquidity cycles, central bank balance sheets, and crypto market microstructure.
QUANTITATIVE SUITE // DEEP ALPHA ENGINEACTIVE
BTC/USDT // LIVE SCANNER
CONFLUENCE 28
LIVE SPOT PRICE$82,820.01NO_TRADE
TP2
$87,960.97
+7.17%
TP1
$84,431.71
+2.87%
ENTRY
$82,078.87
ZONE
SL
$80,902.44
-1.43%
Auto-detect Order Blocks, Fair Value Gaps and risk-adjusted DCA ladders in < 5s.