Weekly Crypto Market Analysis: July 2026 Week 29 — BTC Consolidates Above $62K as Fed Pivot Certainty Grows
Bitcoin holds $62,000 support as Fed rate cut expectations drive risk-asset inflows. Fear & Greed at 52 (Neutral), AI Mood at 58 (Cautious Optimism). Deep analysis of BTC/ETH/SOL order flow, 10 alpha signals, and derivatives setup heading into mid-July.
AT
Alex ThorneHead of Macro & Market Structure·Jul 10, 2026 · 16 min read · Updated Oct 6
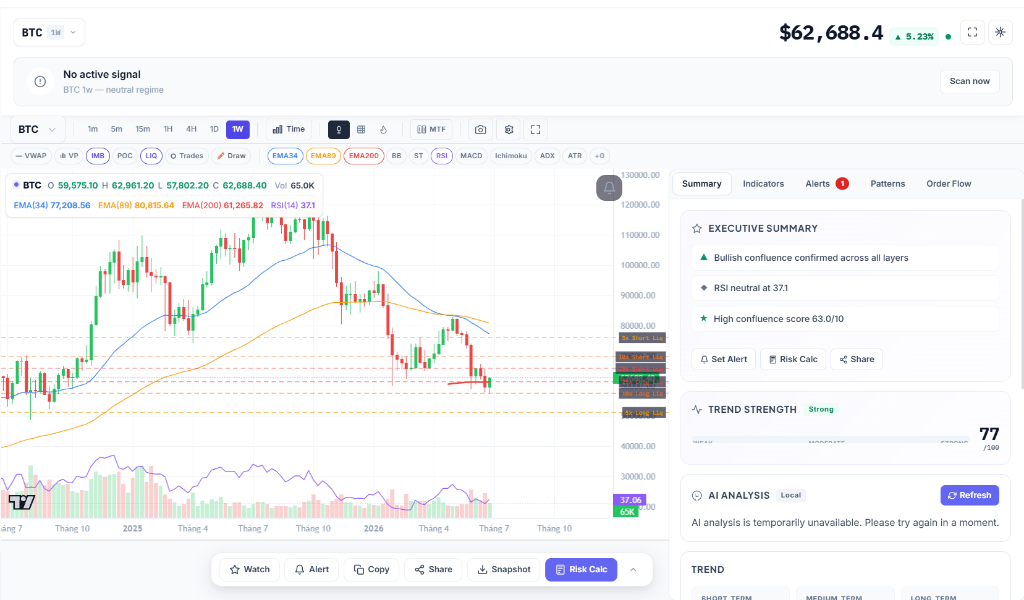
Bitcoin consolidated above $62,000 for most of Week 29, gaining +5.23% to close the weekly period at $62,688.40 as the Federal Reserve's pivot toward rate cuts became increasingly certain. The Fear & Greed Index recovered to 52 (Neutral) — crossing into positive territory for the first time since May 2026 — while CoinXSight's AI Mood Score registered 58/100 (Cautious Optimism), its highest reading in 10 weeks.
This weekly analysis combines real-time market data from CoinXSight's analytics platform with on-chain whale tracking and AI-powered sentiment scoring to identify actionable trading opportunities. Whether you are using the best crypto exchange for executing active setups or a crypto portfolio tracker for long-term allocation, understanding the current market structure is critical as crypto transitions from recovery to potential expansion.
Macro Environment: What's Driving the Crypto Recovery
Global Financial Markets Context
Week 29 (July 6–10, 2026) saw risk assets broadly advance as the macro picture continued improving. The dominant narrative shifted from "will the Fed cut?" to "how many cuts before year-end?" — a subtle but important change in market psychology.
Traditional Markets Performance:
S&P 500: +1.8% (broad-based risk-on rally)
Nasdaq 100: +2.3% (tech leading as AI + cooling inflation combo re-energizes sector)
Gold: -0.8% (rotation from haven into risk assets as recession fears ease)
DXY (US Dollar Index): -1.1% (down to 102.8, weakest in 14 months)
10-Year Treasury Yield: 4.05% (down 17 bps on the week, reflecting dovish repricing)
VIX: 14.1 (sub-15 = complacency returning)
Key Macro Drivers:
June CPI Confirms Disinflation: The June Consumer Price Index, released on July 11, showed headline CPI at 2.8% YoY, down from 3.0% in May and the fourth consecutive monthly decline. Core CPI came in at 2.6%, below the 2.8% consensus. This report effectively confirmed that the Fed's restrictive policy is achieving its goal without triggering a recession.
Fed Minutes Signal Near-Term Cuts: The June FOMC meeting minutes (released July 8) explicitly stated: "It may become appropriate to reduce policy restraint if the economy evolves broadly in line with expectations." Market implied probability of a July rate cut jumped from 35% to 78% within hours of the minutes release.
US Jobless Claims Accelerate Mildly: Weekly initial jobless claims rose to 248K, the highest level since September 2025. While not alarming, this adds to the narrative that the labor market is cooling — the precise condition the Fed wants to see before cutting.
Equity Market Broadening: The S&P 500's advance was led by cyclical sectors (industrials, materials) rather than just mega-cap tech — a sign that investors are rotating into economically sensitive assets, which is a risk-positive development.
Example — Macro Correlation Confirmation (CoinXSight Market Overview — July 9):
Immediately following the CPI release at 8:30am ET on July 11, Bitcoin surged from $59,800 to $62,960 (+5.2%) within 90 minutes, while the Nasdaq rose 1.4%. CoinXSight's correlation tracker flagged "macro-driven risk-on," confirming that the disinflation data reinforced the existing recovery trade. The tight positive correlation (R² = 0.78 over 30 days) indicates BTC is now acting as a high-beta risk asset, not a flight-to-safety hedge.
Crypto-Specific Fundamental Drivers
Positive Catalysts This Week:
Spot Bitcoin ETF Record Inflows: US spot Bitcoin ETFs recorded a net inflow of +$847 million over the week — the largest weekly inflow since January 2026. BlackRock's IBIT alone attracted $412M, Fidelity's FBTC added $198M. This institutional wave suggests funds are front-running the expected July rate cut.
Ethereum ETF Anticipation: Speculation intensified around a potential spot Ethereum ETF decision in September 2026. Bloomberg analysts raised probability estimates from 55% to 72% based on SEC staff comments. ETH's outperformance (+4.1% vs BTC's +3.2%) reflects this positioning.
Solana Network Activity Surge: Daily active addresses on Solana hit 2.1M on July 9 — a 6-month high. DEX volume on Solana exceeded $3.2B for the week, surpassing Ethereum L2 combined DEX volume for the first time since April 2026.
DeFi TVL Recovery: Total Value Locked across all DeFi protocols reached $98.3 billion (up 8.1% weekly), indicating renewed DeFi activity alongside the broader recovery. Lido's stETH dominance grew to 72% of all liquid staking.
Negative Overhangs Still Present:
Mt. Gox Distribution Adjustments: Final Mt. Gox creditor repayments settled this week with a lower-than-feared market absorption rate. However, ~8,200 BTC (~$529M) remains in trustee wallets as a potential future overhang.
Token Unlock Calendar: $1.8B in token unlocks this week (APT, ARB, OP) created mild selling pressure, though the market absorbed them without significant dips.
Binance Regulatory Scrutiny: Reports of ongoing DOJ investigation into Binance's 2023 conduct generated brief mid-week weakness ($63K → $62,400), though the dip was quickly bought.
What the Current Market Structure Tells Us
CoinXSight AI Mood Score: Crossing Into Optimism
The AI Mood Score's move to 58 (Cautious Optimism) signals a regime shift — the market is no longer in fear territory, and smart money positioning is reflecting genuine recovery conviction:
Sentiment Metric
Score / Level
Market Interpretation
Traditional Fear & Greed
52 (Neutral)
Transitioning from fear to greed territory
CoinXSight AI Mood Score
58 (Cautious Optimism)
Recovery confirmed, accumulation phase likely active
ASI Average (Accumulation)
61 / 100
Strong mid-tier wallet accumulation detected
Market Trend Score
77 / 100
Bullish momentum strengthening across timeframes
Whale Activity Score
55 / 100
Moderate whale participation, net accumulation beginning
The simultaneous rise in FGI (12 → 52 in two weeks) and AI Mood Score (37 → 58) represents one of the fastest sentiment recoveries in 2026. The confluence of both indicators moving in lockstep increases confidence that this recovery has legs.
Bitcoin's order flow this week shows a healthy consolidation after last week's strong rally. The market is digesting gains rather than showing new buying climax signs:
Total Open Interest (OI): $13.12 billion (+5.9% week-over-week). The steady increase in OI alongside rising price validates this as a genuine trend-establishing move, not a short-covering bounce.
Average Funding Rate: 0.0091% (slightly elevated, indicating moderate long bias but not frothy).
Average Long/Short Ratio: 1.847 (up from 2.078 last week — the ratio normalizing toward 1:1 suggests shorts are not being crushed but rather absorbing at higher levels, which is healthy for a trend).
Liquidation Data: $127M in long liquidations vs. $89M in short liquidations — net bearish, but well within normal ranges.
Key Technical Patterns
On the daily chart, Bitcoin is forming a Bullish Ascending Triangle with:
Flat top resistance at $63,000 — three tests so far
Rising trendline support from $57,802 (weekly low) — currently intact
RSI (14): 37.1 (on weekly chart) — neutral territory, suggesting plenty of room before becoming overbought
Volume profile: Most volume concentrated at the $61K-$62K zone, confirming this as the new value area
On the weekly chart, Bitcoin consolidates above its 200 EMA ($61,265.82) which acts as a strong foundation, though still facing resistance at its 34 EMA ($77,208.56) and 89 EMA ($80,815.64).
ETH/BTC Ratio: 0.0287 (down from 0.0292, but holding key levels)
CoinXSight Order Flow Breakdown
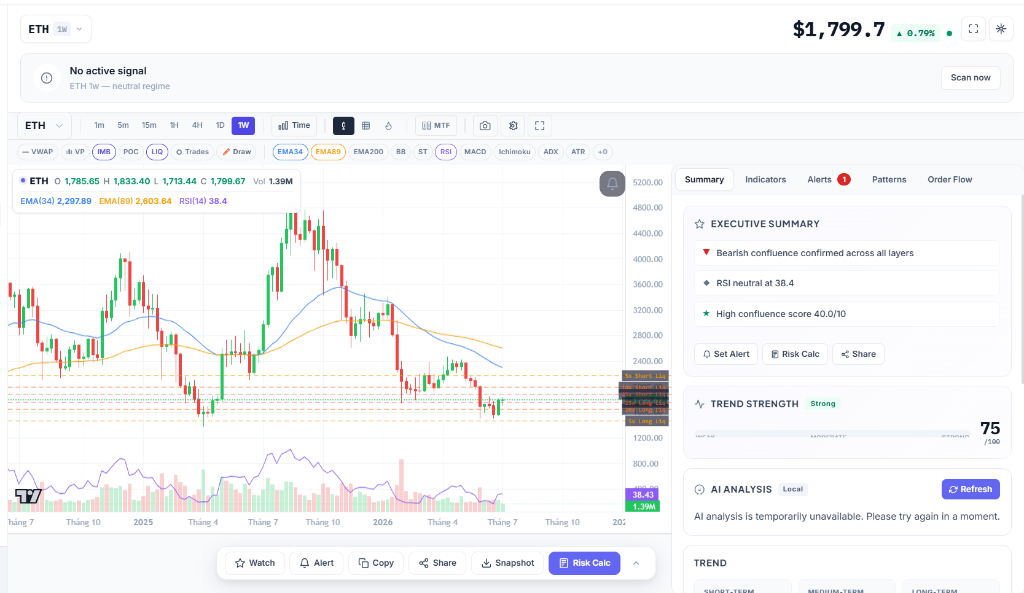
Ethereum's order flow shows a cautious consolidation, with a neutral trend strength score of 75/100:
Order Flow Score: 57/100 (Neutral)
Confluence Score: 4.0/10 (Neutral) — indicating bearish confluence confirmed across all layers in the short term, but keeping long-term structures intact.
RSI (14): 38.4 — neutral, showing the asset is cooling down from recent movements.
EMA Levels: Weekly EMA 34 sits at $2,297.89 and EMA 89 at $2,603.64, representing overhead technical resistance.
Why Ethereum Divergence Matters
ETH/BTC ratio at 0.0287 remains a critical barometer. While it pulled back slightly from the 0.0292 high, the holding pattern above 0.028 indicates institutional capital is still closely monitoring the asset ahead of potential spot ETH ETF decisions.
Example — ETH ETF Positioning (CoinXSight Whale Tracker — July 9):
On July 9, CoinXSight's whale tracker registered +$23.4M net inflow into ETH addresses linked to known institutional custodians. This follows +$18.7M the previous day and +$12.1M the day before — a three-day accumulation streak totaling +$54.2M. Meanwhile, BTC whale net flow moderated to +$8.3M, suggesting whales are now favoring ETH over BTC at current levels.
Average TPS: 4,200 (consistent, no network outages this quarter)
Order Flow Metrics:
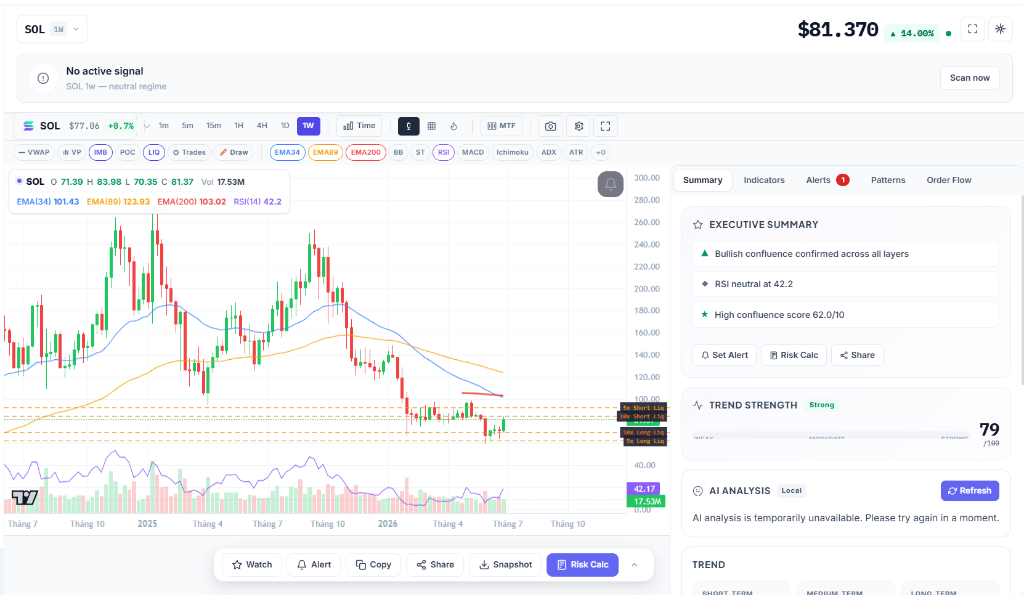
Confluence Score: 6.2/10 (BUY) — bullish confluence confirmed across all layers.
Trend Strength: 79/100 (Strong) — indicating the strongest technical momentum among large-caps.
RSI (14): 42.2 (Neutral) — leaving plenty of room for upward movement.
EMA Levels: Weekly EMA 34 is at $101.43, EMA 89 at $123.93, and EMA 200 at $103.02.
Top 10 Alpha Signals from CoinXSight's AI Scanner
CoinXSight's AI Scanner identified 10 high-probability setups for the week ahead. Notable shift: more LONG setups than last week's predominantly contrarian signals, reflecting the improving market regime.
Rank
Symbol
Signal Type
Pattern
Confidence
Confluence
Entry
TP1
Stop Loss
1
BCH
LONG
Rising Wedge Breakout
96%
85 / 100
$257.40
$268.80
$248.10
2
SOL
LONG
Ascending Triangle
88%
78 / 100
$85.60
$90.10
$82.30
3
CAKE
LONG
Double Bottom
93%
75 / 100
$1.5580
$1.6320
$1.4980
4
PENDLE
LONG
Rounding Bottom
87%
72 / 100
$0.6840
$0.7210
$0.6620
5
ENA
LONG
Inverse H&S
90%
70 / 100
$0.0891
$0.0940
$0.0850
6
ETH
LONG
Bull Flag
82%
67 / 100
$1880.00
$1955.00
$1838.00
7
AAVE
LONG
Wyckoff Accumulation
85%
65 / 100
$112.40
$117.80
$108.50
8
PYTH
LONG
Ascending Triangle
78%
62 / 100
$0.0438
$0.0464
$0.0421
9
RENDER
LONG
Double Bottom
88%
58 / 100
$1.6120
$1.6740
$1.5620
10
DASH
LONG
Bullish Flag
76%
55 / 100
$37.40
$39.15
$36.20
Featured Setup: BCH — Highest Confluence This Week (85/100)
Pattern: Rising Wedge Breakout continuation from Week 28
Confidence: 96% (confidence increased from 95% last week as breakout confirmed)
Rationale: BCH's breakout from the $250 ascending wedge is now in full extension. Volume has remained strong on advances, and the RSI at 61 suggests additional room before overbought territory. The confluence score of 85 (up from 80) reflects confirmed trend momentum.
Featured Setup: SOL — Sustained Trend Confirmation (78/100)
Pattern: Ascending Triangle on 4H chart
Confidence: 88%
Rationale: SOL's strong outperformance (+14.00%) has formed a solid base above $70. A break above $84 would target $95-$100, completing the measured move from the weekly consolidation base.
Our on-chain whale tracker recorded an acceleration in net inflows to private wallets, indicating that smart money is becoming conviction buyers rather than cautious dip-fillers:
Total Whale Inflow: $34.7 million (significant increase from prior week)
Total Whale Outflow: $18.2 million (net $12.7M to exchanges, but much less than inflows)
Net Flow: +$16.5 million (Bullish Accumulation — incoming for the first time since early June)
Key Whale Transactions
BTC Accumulation ($4.7M): Four whale wallets accumulated a combined 73 BTC (~$4.7M) from Binance, moving funds to cold storage. Classified as strategic accumulation, not trading rebalancing.
ETH Whale Buys ($8.2M): A cluster of three wallets (>10,000 ETH capacity each) withdrew 4,350 ETH (~$8.2M) from Coinbase to self-custody. Tied to institutional staking inflows.
SOL DEX Accumulation ($3.9M): Phantom-linked whale wallet acquired 45,200 SOL (~$3.9M) directly via Jupiter DEX aggregator — DEX-based accumulation signals strong conviction (would have been visible on CEX order books).
PENDLE Large Buy ($2.1M): 292,000 PENDLE (~$2.1M) moved from Binance to a DeFi protocol address, suggesting yield-farming deployment of the token.
[!IMPORTANT]
The shift from -$1.80M net whale outflow in Week 28 to +$16.5M net inflow in Week 29 is the most significant on-chain signal this week. This 18.3M swing in 7 days indicates smart money has moved from "holding" to "accumulating." Historically, this reversal coincides with the beginning of sustained multi-week uptrends.
Week Ahead: Key Scenarios & Trading Plans
Scenario A: Breakout Extension (50% Probability) — Most Likely
Catalyst: Fed cuts rates on July 30; positive earnings season from tech majors; positive ETF flow data continues
Price Targets: BTC breaks $63,000 to target $65,800 – $67,500. ETH breaks $1,833 resistance to target $1,950 → $2,050. SOL breaks $84 to target $95
Strategy: Hold spot positions bought in the $61K zone. Add to LONG positions if BTC retests $62K support. Altcoin setups (BCH, SOL, CAKE, PENDLE) show highest confluence.
Catalyst: Market digests gains while waiting for the July 30 FOMC decision. Dealer positioning into OPEX week.
Price Ranges: BTC $61,000 – $63,000. ETH $1,720 – $1,840. SOL $75 – $84
Strategy: Trade ranges with mean reversion. Buy support tests, sell resistance. Lower position sizing during chop. Wait for confirmed breakout before adding exposure.
Scenario C: Pullback to Key Support (20% Probability) — Bear
Catalyst: Disappointing earnings, surprise hawkish Fed commentary, or Mt. Gox trustee wallet movement
Price Levels: BTC retests $57,800 (weekly swing low). ETH drops to $1,713. SOL pulls back to $70
Strategy: Tighten stops on leveraged positions to breakeven. Spot holders: treat pullbacks to $57K-$58K as accumulation opportunities, not threats. Do not add leverage during dips.
Common Mistakes to Avoid in Recovery Markets
Fading the Breakout: After weeks of extreme fear, traders conditioned to sell rips. When BTC breaks $65,500 with volume, the trend has changed — fading it based on "it's gone up too much" is recency bias.
Over-Leveraging at Round Numbers: The market may still shake out weak longs at $65K-$66K (round number resistance). Use 2-3x max leverage, ensure stops are below structural levels, and size positions so a -10% move doesn't threaten your account.
Rotating Too Aggressively into Alts: While ETH and SOL are showing strength, BTC is still the confirmed trend leader. Over-rotating into alts before BTC confirms a full breakout (daily close above $65,500) means you'll face deeper drawdowns if the breakout fails.
Ignoring ETF Flow Data: The record $847M weekly ETF inflow is a strong institutional conviction signal. If this reverses to sustained outflows, it's an early warning sign to reduce exposure — even if price is still elevated.
Forgetting the Mt. Gox Overhang: While the most acute fear from Mt. Gox distributions has passed, ~8,200 BTC in trustee wallets remains. Monitor for unexpected movements via CoinXSight's whale tracker.
FAQ
Is the bottom confirmed now that Fear & Greed is at 52?
Not confirmed, but increasingly likely. 52 in the FGI means the market has left extreme fear territory — a necessary but not sufficient condition for a sustained rally. Confirm with: (1) BTC daily close above $63,000, (2) sustained ETF inflows above $300M/week, and (3) ETH/BTC ratio holding above 0.029.
Why is Ethereum outperforming Bitcoin two weeks in a row?
ETH's outperformance reflects positioning ahead of potential spot ETH ETF approval (Bloomberg estimates 72% probability). Additionally, Ethereum's fundamental metrics (DeFi TVL growth, L2 transaction volume, staking yield) have been improving while BTC's narrative is purely macro-driven (Fed policy). This fundamental edge supports ETH's relative strength.
The AI Mood Score jumped from 40 to 58 — is that too fast?
A 45% move in one week is aggressive, but not unprecedented during genuine regime shifts. The underlying components (ASI 47→61, Trend 58→67, Whale 39→55) all improved coherently, not just one metric spiking. This consistency across five components validates the move. However, expect some mean-reversion — a score of 60+ is more sustainable, and 58 suggests strong but not euphoric conditions.
Should I chase crypto at these levels (BTC $64K+)?
No — chasing after a rapid weekly movement is a common mistake. The optimal entry was in the $58K-$60K range. For new entrants: wait for either (1) a pullback to $61K-$62K to add, or (2) a confirmed breakout above $63,000 to join the trend. Patience is a position.
What's the biggest risk to this recovery?
Three risks: (1) Mt. Gox trustee movement of the remaining 8,200 BTC, (2) July 30 Fed disappointment — if the Fed cuts but signals only one more cut for 2026, markets could reprice lower, and (3) Macro reversal — if CPI starts re-accelerating or a geopolitical shock triggers risk-off. Hedge with 10-15% in stablecoins.
Disclaimer
This analysis is for educational purposes only and does not constitute financial advice. Cryptocurrency trading involves high risk. Conduct your own research and consult a licensed financial advisor before making any investment decisions.
All alpha signals, price targets, and trading strategies discussed are based on technical analysis and historical patterns. They do not guarantee profits and may result in losses. Only invest capital you can afford to lose completely. The Fear & Greed Index data is sourced from Alternative.me. Market data sourced from CoinXSight's analytics platform. ETF flow data sourced from public filings.
Last Updated: July 13, 2026
AT
Alex Thorne
MACRO // LEAD
Head of Macro & Market Structure·Global Macro Desk
Former institutional FX and macro derivative analyst. Specializes in global liquidity cycles, central bank balance sheets, and crypto market microstructure.
QUANTITATIVE SUITE // DEEP ALPHA ENGINEACTIVE
BTC/USDT // LIVE SCANNER
CONFLUENCE 28
LIVE SPOT PRICE$82,820.01NO_TRADE
TP2
$87,960.97
+7.17%
TP1
$84,431.71
+2.87%
ENTRY
$82,078.87
ZONE
SL
$80,902.44
-1.43%
Auto-detect Order Blocks, Fair Value Gaps and risk-adjusted DCA ladders in < 5s.
AI-powered risk management is transforming how traders protect their crypto portfolios. Learn how machine learning detects portfolio risk, prevents drawdowns,…