Bitcoin Broke $75,000 at the Weekly Close — Now the CPI Week Starts Underwater
Bitcoin lost $75,000 in the final hour of the week, closing below the $75,500 flip, the 50-week moving average and Strategy's cost basis — a fifth straight red week, and the worst of the five — with China data Monday morning and Tuesday's CPI now the only things standing between the market and $73,200.
CX
CoinXSight Alpha DeskQuantitative Research Desk·Nov 9, 2026 · Updated Nov 10
Bitcoin spent the whole weekend defending $75,000. It lost it in the final hour of the week.
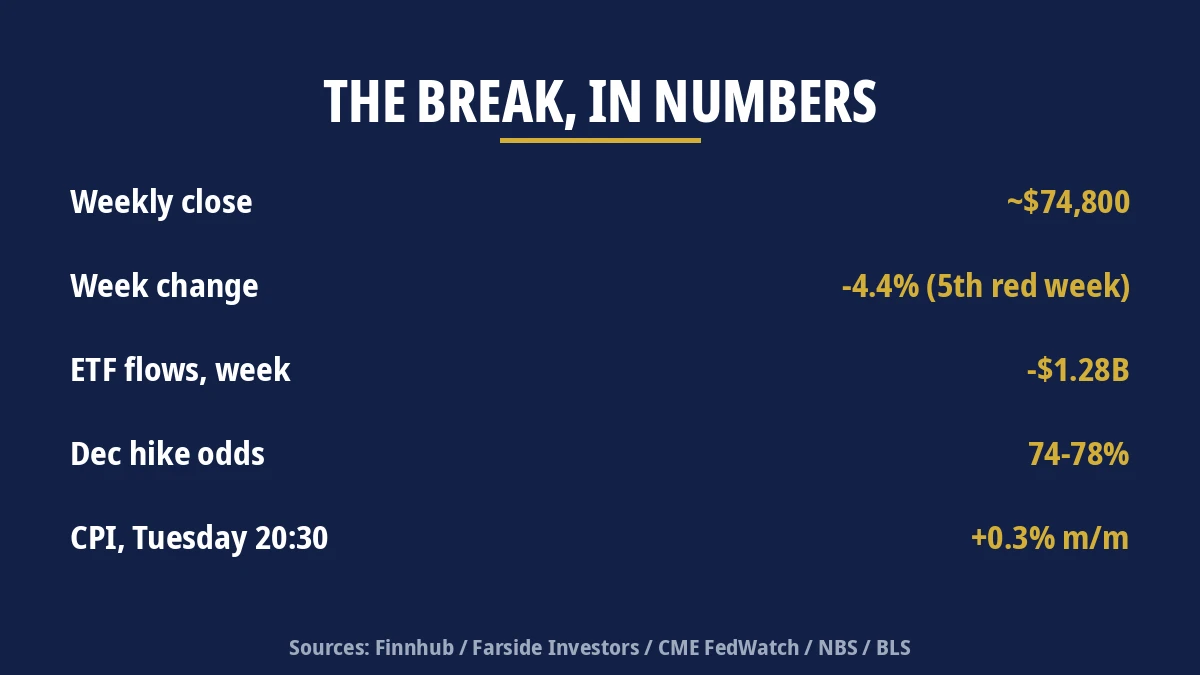
The break came late on Sunday night, in thin liquidity, with no new headline to blame. OKX data showed bitcoin slipping under $75,000 at 21:54 UTC, trading at $74,996. By 05:54 Vietnam time on Monday it was $74,863 on Coinbase. Finnhub’s Binance feed put it at $74,744 shortly before the weekly candle closed, with an intraday low of $73,510 — a wick that reached almost to the 200-day moving average. At the close itself, just after midnight UTC, bitcoin was changing hands near $74,800.
That is not the close the weekend promised. Sunday’s note had framed the weekend as a test of whether $75,000 would hold into the close, and all Sunday, bitcoin had sat almost motionless near $75,800, inside a $75,545-to-$75,920 band, holding Friday’s $74,722 low and the $75,000 line it had defended since the rout. The quiet was supposed to be the story. Instead, the last hour rewrote it: the weekly candle closed below the $75,500 liquidation flip, below the 50-week moving average near $75,556, and below Strategy’s average purchase cost of $75,451 — three lines, lost together, in about sixty minutes.
It is the fifth straight losing week, and the worst of the five. From Monday’s open of $78,232, bitcoin is down about 4.4% on the week. The four weeks before it each cost between 2% and 3.3%. Only twice since 2017 has bitcoin printed five red weeks in a row. The streak is no longer a slow bleed. It has a breakdown at the end of it.
What broke, and why it matters
Start with the three lines, because they are not the same kind of line, and losing all three at once is what turns a bad close into a statement.
The 50-week moving average, near $75,556, is the trend line. Bitcoin has held it for four days, and the whole weekend was framed around it: hold the average into the close and the structure survives into the CPI week. It did not hold. A weekly close below a 50-week average does not by itself end a bull market — bitcoin has recovered from worse — but it removes the one technical argument the bulls had left after Thursday’s rout, and it hands the bears a weekly chart that finally agrees with their story.
Strategy’s cost basis, $75,451, is the accounting line. Strategy holds 849,327 bitcoin bought for $64.08 billion, and at $74,863 the position is worth about $63.58 billion — roughly $500 million underwater, according to BBX’s calculation. The company has no obligation to sell; its September 30 filing says none of its bitcoin is pledged as collateral, and it holds $4.79 billion in reserves for preferred dividends and interest. But a corporate treasury sitting below its average cost is a different headline from a corporate treasury sitting above it, and the market will read it that way on Monday. Strategy’s next filing, expected Monday, will show whether it bought the dip as prices fell — the one data point that could flip the story back.
The $75,500 flip is the mechanical line. It is where the liquidation map changes sides: above it, rallies liquidate shorts and feed themselves; below it, sell-offs liquidate longs and feed themselves the other way. Bitcoin spent the weekend parked on it. Now it is below it, and the flip becomes the first resistance on any bounce. The walls around it have not moved — $76,500 above, $74,250 below — but the price is now on the wrong side of the hinge, and the next cluster of long liquidations sits at $74,250, barely $550 below the close.
Ethereum fell harder. It traded near $2,131 in the same late-Sunday window, down 4.8% on the day from a $2,239 open, with an intraday low of $2,060. That takes ether well below the $2,200-to-$2,220 support zone analysts were watching, and it underlines that this was not a bitcoin-specific move. The whole market gave way in the final hour. The Crypto Fear & Greed Index reads 28, in Fear, up a tick from 25 — a gauge that improved on a weekend when bitcoin barely moved, and now looks stale against the close.
The paradox is over
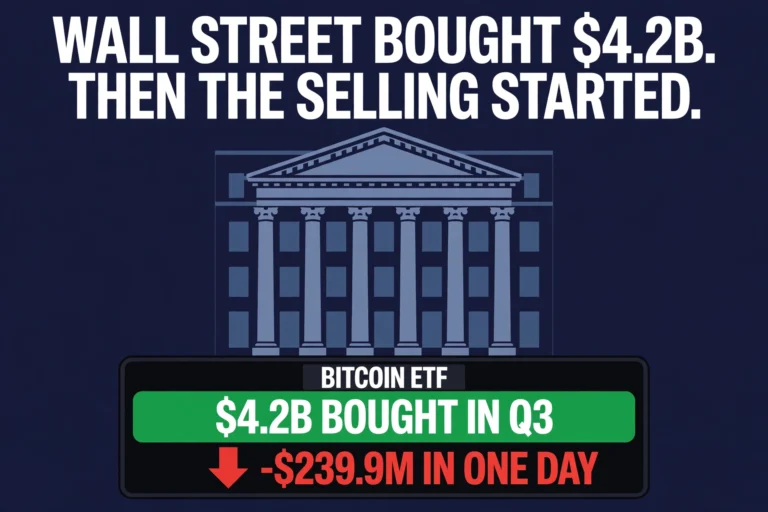
For most of the weekend, the story of this market was a paradox: record ETF outflows, and a price that refused to break. U.S. spot bitcoin ETFs lost $1.28 billion in the week to November 6, the worst week since late June, with BlackRock’s IBIT accounting for $1.21 billion of it — redemptions in all five sessions, $405.3 million on Monday and $403 million on Friday. Ether funds lost $365.2 million for the week. For the year, spot bitcoin ETF flows have now turned negative.
The paradox held while the price held. It does not hold anymore. A market that absorbs $1.28 billion of redemptions at $75,000 is resilient; a market that absorbs them and then breaks $75,000 into the close is a market where the absorption was just slower selling. The flows are still less than 1% of total spot ETF assets, and they measure fund redemptions rather than direct exchange selling, so they do not by themselves prove a rout. But the direction is the point: five straight sessions of redemptions from the category’s biggest fund, and now a weekly close below every line the weekend was defending. The buyers who were supposed to be absorbing the flow were not there at the close.
The weekend’s liquidation data tells the same story from the other side. Roughly $50 million in positions were liquidated across 15 exchanges in the past 24 hours, about 76% of it longs, according to MyCoinDeck — a quiet weekend by any measure, and a rounding error next to the $1.05 billion Thursday–Friday wave. That quiet is now the problem, not the comfort: with no forced sellers left to exhaust, the late-Sunday drop was a choice the market made, not a liquidation cascade. The next move has to be chosen too, and the first test of that choice comes with data, not with positioning.
The week in numbers
What
Number
Source / note
BTC weekly close (00:00 UTC Mon)
~$74,800
Finnhub/Binance at 00:01 UTC; below $75,500 flip, 50-week MA $75,556, Strategy cost $75,451
BTC weekly change
~−4.4%
From Monday open $78,232 / prior close $78,239; 5th straight red week
BTC late-Sunday low
$73,510
Finnhub/Binance intraday low; near 200-day MA ~$73,200
ETH
~$2,131, −4.8% day
Finnhub/Binance; intraday low $2,060, below $2,200 support
BTC ETF flows, week to Nov 6
−$1.28B
Farside; IBIT −$1.21B; worst week since late June; YTD now negative
ETH ETF flows, week to Nov 6
−$365.2M
Farside; Friday −$93M
Fear & Greed
28 (Fear)
alternative.me; up from 25
Liquidations, 24h
~$50M, 76% long
MyCoinDeck, 15 exchanges; quiet weekend, not a new wave
Core +0.2%; BLS publishes NO YoY this month — 3.7% is a nowcast, not a print
Monday starts with China, not with the close
The close is the verdict on last week. Monday morning brought the first data of the new one, and it arrived before most of Vietnam had breakfast. China’s October CPI came in at +0.7% year-on-year, below the +0.8% consensus and down from +0.9% in September, with prices flat month-on-month and core inflation easing to +0.8% from +1.0%. PPI, meanwhile, jumped +5.7% year-on-year — above the +5.3% consensus and up from +5.0%, the fastest factory-gate inflation in more than four years. The gap between the two now stands at about five percentage points, the widest yet.
The two numbers point in opposite directions, and that is the point. Consumer demand is still too weak to lift prices — CPI missed, core eased — while industrial input costs keep climbing on energy and commodities. For the Fed, that is a mixed read into Tuesday: soft consumer inflation argues the hawks are overreaching, hot producer prices argue input costs are still feeding through. Neither number will move bitcoin on its own. What they do is set the tone for the 36 hours before the print that does — and the tone is that the disinflation case and the inflation case are both still alive, which is exactly why Tuesday’s CPI is a coin flip the market has priced as a hike.
There is also a derivatives marker before the open: 7,932 bitcoin of Deribit options expire at 08:00 UTC on Monday, with max pain at $76,000 — now above the price, which means the expiry pulls the market up, weakly, toward a level it just lost. And Strategy’s Monday filing will show whether the company bought bitcoin into the fall. If it did, the underwater headline gets a counterweight the same morning. If it did not, the market reads the silence.
The background noise is worth one paragraph, because two regulatory stories landed over the weekend and neither is priced in yet. The U.S. Treasury’s FinCEN moved on Friday to cut off the exchange MEXC over alleged illicit flows of about $16 billion. Mercado Bitcoin, Brazil’s largest exchange, reopened in view-only mode on Monday, a week after attackers drained its hot wallets; withdrawals and trading are still shut. Neither story moved bitcoin’s price over the weekend, and neither should be written as the reason for the late-Sunday break — the break had no headline. But both add to a regulatory backdrop that was already the week’s other theme, and a market sitting below its key lines is more sensitive to the next headline than a market sitting above them.
Goolsbee speaks tonight; Tuesday decides
At 22:00 Vietnam time tonight, Chicago Fed President Austan Goolsbee speaks — the first Federal Reserve official to comment in public since Friday’s payrolls beat. October payrolls rose 165,000 against a consensus of 55,000 to 65,000, with 84,000 jobs of upward revisions and unemployment ticking down to 4.1%. Goolsbee’s audience will be listening for one thing: whether the Fed’s doves have absorbed a jobs report that beat every forecast, or are still looking for reasons to wait. Barkin and Bowman speak on Monday as well. None of them will move the December odds by themselves — the market already prices a hike at roughly 74% to 78% depending on the venue, with CME FedWatch at 75.5% as of November 8 — but a hawkish tone tonight would put $74,250 under pressure before Tuesday even arrives.
Tuesday is the print the whole week is built around. October consumer prices arrive at 20:30 Vietnam time, the last inflation reading the Fed will see before it decides on December 9. Forecasts are +0.3% month-on-month for the headline index, after +0.6% in September, and +0.2% for the core index, after +0.3%. One number is not to be watched, and it is the trap this month: the year-on-year rate. The Bureau of Labor Statistics will not publish a 12-month CPI figure for October, because there is no October 2025 data to compare against after last year’s shutdown. The 3.7% annual rate in some headlines is a model estimate, roughly the Cleveland Fed’s nowcast, not a Bureau print. Anyone writing it as the official figure on Tuesday night will be wrong, in public.
The framing is simple enough to state in one paragraph. A hot CPI pushes the hike odds up from here and puts $74,250 under immediate pressure, this time with the weekend’s quiet already spent and the weekly close already lost. A soft print gives the hold camp its best argument since the October meeting, and the first thing it would buy is a test of the $75,500 flip from below — the line that has to be reclaimed before anything else can be called a recovery. An in-line print changes nothing, and a market pricing a hike at three-to-one odds does not rally on confirmation.
What to watch now
The levels are the same ones the weekend was built around; only the side of them has changed. As of Monday morning in Vietnam, bitcoin was trading near $74,750–$75,000 (Finnhub $74,996 at about 08:45 VN; Crypheat $74,756), with ether near $2,125 — still below the flip, still below $75,000, and barely above the $74,740 support one technical read flagged as the line under threat. Below the close, $74,250 is the lower liquidation wall and the next cluster of long stops, then Friday’s $74,722 low — already broken intraday in the late-Sunday wick — and then the 200-day moving average near $73,200, which the $73,510 low nearly touched. Above, $75,000 is the first line to reclaim, then the $75,500 flip, then $76,000 to $76,250, where every rally died this weekend. A daily close back above $75,500 would be the first sign the breakdown was a wick rather than a verdict. A daily close below $74,250 would say the opposite, and would open the way to the 200-day average with very little in between.
The honest summary is shorter than the week that produced it. Bitcoin held $75,000 all weekend and lost it in the final hour, closing the week below every line that mattered, with the largest ETF in the category still bleeding and the biggest inflation print of the year 36 hours away. The market that opens on Monday is not the market that closed on Friday. It is a market that has to prove, before Tuesday night, that $75,000 was a floor and not a ledge — and the proof starts with China at 08:30 this morning.
Watch the China numbers with us this morning, and know your levels before Tuesday’s print, not after it.
This article is for informational purposes only and does not constitute financial advice. Figures are cited from official releases and market data as reported at the time of writing and are subject to revision. Cryptocurrency markets are volatile; always do your own research before making investment decisions.
Track real-time institutional orderflow, liquidity heatmaps, and whale positioning across global crypto venues with the CoinXSight Intelligence Terminal.
Disclaimer: This quantitative macroeconomic review and cryptocurrency market positioning analysis is published strictly for educational and informational purposes and does not constitute financial, investment, or trading advice. Digital asset markets carry significant capital risk and volatility. Always conduct independent due diligence (DYOR) before committing capital.
CX
CoinXSight Alpha Desk
ALPHA // DESK
Quantitative Research Desk·Global Alpha Division
CoinXSight Institutional Research Desk produces quantitative crypto market intelligence, algorithmic models, and on-chain forensics.
QUANTITATIVE SUITE // DEEP ALPHA ENGINEACTIVE
BTC/USDT // LIVE SCANNER
CONFLUENCE 74
LIVE SPOT PRICE$82,807.47WEAK_BUY
TP2
$89,522.75
+9.07%
TP1
$85,056.42
+3.63%
ENTRY
$82,078.86
ZONE
SL
$80,590.09
-1.81%
Auto-detect Order Blocks, Fair Value Gaps and risk-adjusted DCA ladders in < 5s.