Altseason 3.0 Is Not Here Yet – Bitcoin Dominance Above 61% Is the Line That Decides It
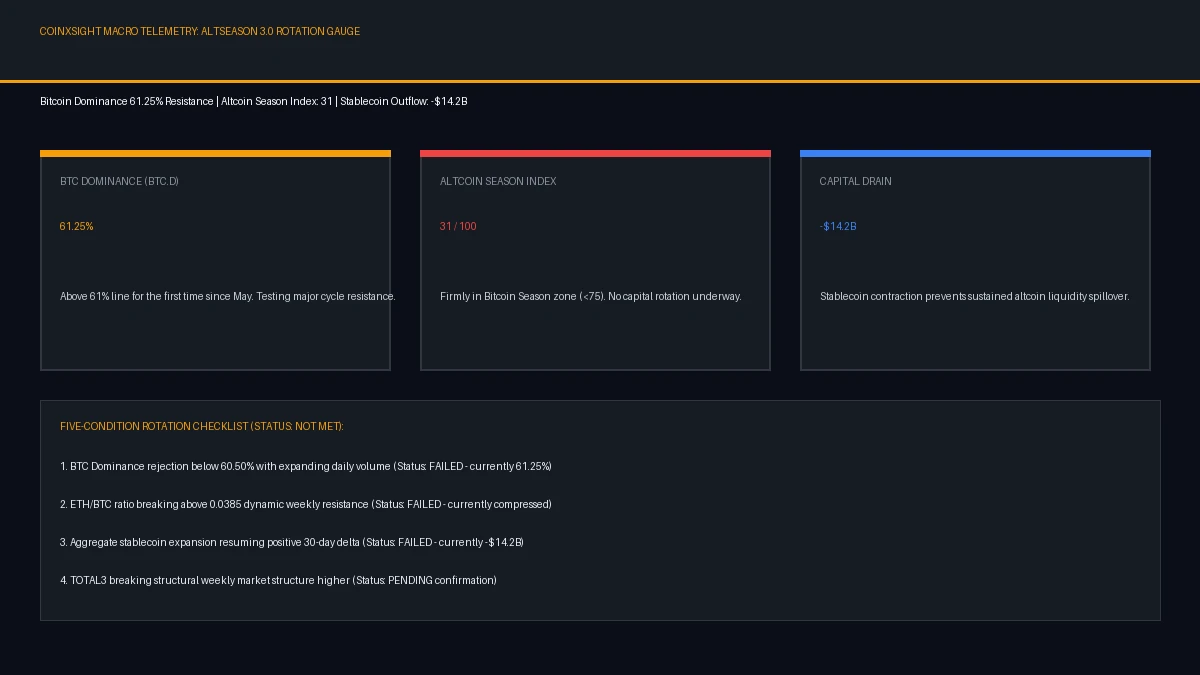
Bitcoin dominance pushed above 61% for the first time since May, but the Altcoin Season Index reads just 31 — this is not altseason. The three gauges that decide a rotation have not turned yet; here is the five-condition checklist that separates a real rotation from another head-fake.
CX
CoinXSight Alpha DeskQuantitative Research Desk·Nov 12, 2026 · Updated Nov 12
Bitcoin dominance pushed above 61% this week for the first time since May. The Altcoin Season Index reads 31. Those two numbers, side by side, answer the question the whole market is asking — and the answer is no. This is not altseason. Not yet.
The interesting question is not when altseason starts. It is what, exactly, has to break for capital to leave Bitcoin and spread into everything else — and how you will know it when it happens, instead of a week after it already did. Dominance is the decision line. This article is a framework for reading it: what the number means, the three gauges that confirm or kill a rotation, and the five conditions to watch before calling the turn.
The number: what 61% actually means
First, the number itself needs a footnote, because two honest measures disagree by more than a point — and the gap is the lesson.
TradingView’s BTC.D, the dominance gauge most traders watch, poked above 61% on November 11 for the first time since May. The level traders are watching now is 61.25%: the resistance that either breaks and opens the door to a deeper Bitcoin-led move, or rejects and marks the top of this leg. CoinGecko’s broader measure, which counts a much larger universe of tokens, reads 59.9% at the time of writing. Both are rising. The direction is not in dispute; only the decimal is.
The move has been steady rather than violent. CryptoNews reported dominance at 60.4% against 59.4% a month earlier — a gain of about one percentage point in thirty days — while Ethereum’s share fell to 10.3%, down 0.65 points over the same period. CoinGecko’s live read puts ETH at 10.12%. Whichever measure you prefer, the story is the same: Bitcoin has been taking share from everything else for a month, and the pace is quickening, not slowing.
Measure
Reading
Source and time
TradingView BTC.D
Above 61%, first time since May; 61.25% is the watched resistance
Material Indicators via blockchain.news, 11 Nov 2026
CoinGecko BTC share
59.9%
CoinGecko global data, 12 Nov ~10:35 VN
ETH dominance
10.1-10.3% and falling
CoinGecko; CryptoNews, 11-12 Nov 2026
Altcoin Season Index
31 — not altcoin season
blockchaincenter.net snapshot, 12 Nov 2026
Total crypto market cap
$2.47 trillion, down 2.6% in 24 hours
CoinGecko global data, 12 Nov ~10:35 VN
Dominance is a ratio, not a price, and that is why it matters more than the tape on any single day. It rises when Bitcoin falls less than everything else, or rises more. On a day Bitcoin is flat, dominance can still climb if altcoins bleed — and that is exactly what has been happening. The market is not rotating into Bitcoin because it loves Bitcoin. It is concentrating in Bitcoin because it is the most liquid exit when everything else looks worse.
The breadth test: fewer than one in ten alts is winning
The Altcoin Season Index exists to stop arguments like this one. It measures how many of the top 50 altcoins (excluding stablecoins) beat Bitcoin over the past 90 days. Above 75, it is altcoin season. Below 25, it is Bitcoin season. The snapshot for November 12 reads 31. That is not altcoin season. It is not even close to the borderline — it is a market where Bitcoin is still winning the breadth war by a wide margin.
Material Indicators, the on-chain analytics firm tracking the move, reported that fewer than 10% of altcoins posted positive returns over the past two weeks while dominance pushed above 61%. That is the breadth test failing in plain sight: the rally, such as it is, belongs to one asset.
Thursday morning’s tape tells the same story in a single screen. Bitcoin was trading at $73,748, up 0.13% on the day. Ethereum was at $2,052.85, down 0.37%. Solana was at $83.19, down 0.31%. XRP was at $1.046, down 1.30%. Binance Coin was at $678.45, down 0.53%. Dogecoin was at $0.0674, down 1.36%. Cardano was at $0.1734, down 1.15%. Chainlink was at $10.13, down 2.48%. Bitcoin was the only major asset in the green, and only barely. When the market’s biggest asset is flat and everything beneath it is red, dominance rises by definition — and no single altcoin’s chart can argue with the arithmetic. The selling is not new, either: the market already flushed $1.15–$1.2 billion in leveraged positions on Sunday–Monday, a wave that belongs to the weekend’s own dynamics and must never be added to this week’s CPI-driven liquidations.
TOTAL3, the combined market value of all crypto excluding Bitcoin and Ethereum, sits at roughly $742 billion. That is the pool a rotation would have to fill. Right now it is not filling. It is leaking, slowly, while Bitcoin holds its ground near $73,700 — right on top of its 200-day moving average near $73,100, the line that has defined this market’s mood for a week.
The three gauges that decide a rotation
Altseason is not a feeling and it is not a hashtag. It is a sequence, and the sequence has an order. Three gauges have to turn, roughly in this order, before a rotation is real. Watch them in this order, and you will not be early, and you will not be late.
The first gauge is TOTAL3 itself. A real rotation shows up as TOTAL3 rising while Bitcoin dominance falls — money leaving the biggest asset and landing in the next tier. A falling TOTAL3 with falling dominance is not rotation; it is everything falling together with Bitcoin falling slightly faster, which is just a different kind of sell-off. The confirm is TOTAL3 breaking higher with rising volume over several sessions. The kill is TOTAL3 making lower highs while dominance holds above 61%.
The second gauge is ETH/BTC. Ethereum is the bridge asset: institutions and large traders rotate through ETH before they touch smaller altcoins, and ETH/BTC is the ratio that shows whether that bridge is open. The ratio stands at 0.0278. Ethereum closed Sunday below its 200-day moving average for the first time since August 18, and it has led every leg of this sell-off down. For a rotation to start, ETH has to reclaim that moving average and ETH/BTC has to turn up and hold. Until then, the bridge is closed, and talk of altseason is talk about a road nobody is driving on.
The third gauge is stablecoin supply — the dry powder. Rotation needs fresh money entering the system, and in crypto that money arrives as stablecoins. This week the flow ran the other way: stablecoin supply fell $14.2 billion, the largest drain since the 2022 bear market. That is not money rotating from Bitcoin into altcoins. That is money leaving crypto altogether. A rotation cannot start while the stablecoin pool is shrinking; the fuel has to stop draining first, then grow. Watch for the drain to stop before you watch for anything else.
None of the three gauges has turned. TOTAL3 is leaking, ETH/BTC is at the lows with ETH below its 200-day average, and stablecoin supply just printed its biggest weekly drain in four years. That is why the index reads 31 and not 75. The framework is not being bearish. It is being literal: the conditions for altseason are not met, so altseason is not happening.
Why the money is not rotating yet
The gauges do not turn in a vacuum. They are pinned down by the macro tape, and this week’s tape is the heaviest it has been in months.
October’s CPI came in hot on both lines — headline up 0.4% month-on-month against a 0.3% forecast, core up 0.3% for the third consecutive month — landing exactly on the threshold Fed Governor Christopher Waller had said would force a half-point hike onto the table. The December question is no longer whether the Fed hikes. Traders price a move as certain, with 25 basis points at 84.7% and 50 basis points at 15.3% on CME FedWatch. Dallas Fed President Lorie Logan has called for at least two more hikes. The tightening that was supposed to be over is back on the calendar, and the next print — PPI, Friday evening Vietnam time, forecast at 0.4% month-on-month — lands before the weekend. A hot PPI does to the 50-basis-point odds what Tuesday’s CPI just did.
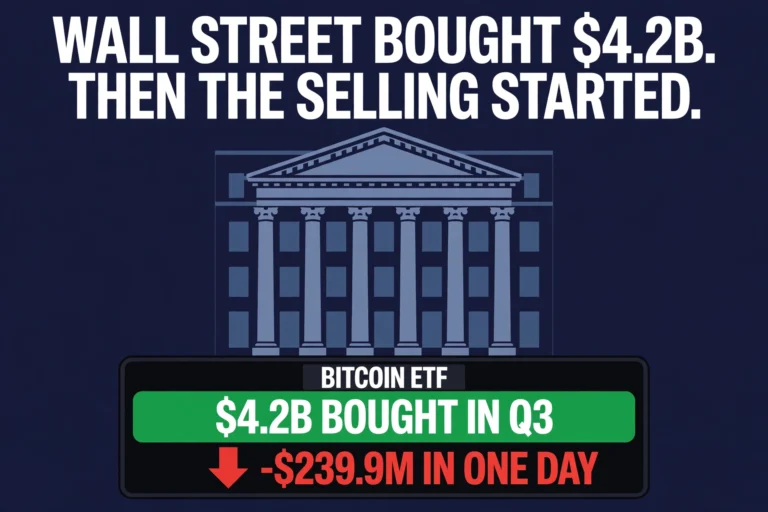
The institutional flow underneath is just as cold. US spot bitcoin ETFs recorded $95 million of net outflows on November 11, the fourth straight session of redemptions, following a $1.28 billion weekly outflow — the worst since late June. Spot ether ETFs are bleeding alongside them. There is no dip-buying from the ETF complex to catch this fall, and there has not been for a week. The CPI print that broke Bitcoin below $73,200 did not produce a single day of ETF inflows afterward. The tape has already tested the optimistic case and rejected it. Bitcoin reclaimed $73,200 on Wednesday, but the market never trusted the reclaim — and Thursday’s tape shows why: the level held, yet not a single major altcoin followed it higher. When a reclaim holds the level and still fails to pull capital down the ladder, traders stop buying dips and start selling rallies. That is exactly what dominance is measuring.
Then came the index shock. MSCI removed Strategy from its indices, effective at the close on November 30 — the largest corporate Bitcoin holder, ejected from the benchmarks that force passive money to own it. The estimated forced selling runs into the billions, and the signal it sends is worse than the flow: the index world is treating crypto-adjacent equity as a risk to be managed, not an exposure to be held.
Large holders are acting the same way. Roughly 34,000 Bitcoin — about $2.6 billion at current prices — left whale wallets over the past week. The Crypto Fear & Greed Index reads 28, in Fear, down from 32 two days ago. None of this is a panic. It is a repricing, and the repricing runs in one direction: toward the most liquid asset, away from everything else. That is what dominance above 61% is measuring. It is not enthusiasm for Bitcoin. It is a flight to the exit with the widest door.
What a real altseason actually looks like
The last time the index meant it was April 2021. The Altcoin Season Index printed 90 or above for days on end — 90 on April 9, 96 on April 12, 94 on April 15 — and dominance fell for weeks, not days, while Ethereum led the move and the rotation spread down the market-cap ladder in order: large caps first, mid caps second, the long tail last. That is the shape of a real rotation. It is slow, it is ordered, and it lasts long enough to argue about while it is happening.
The head-fakes look different. They are fast, they are narrow, and they reverse within days. A single altcoin ripping 5x while the index sits below 40 is not altseason; it is a lottery ticket with good marketing. A two-day dip in dominance that reverses at the first sign of macro stress is not rotation; it is a crowded trade getting stopped out. The 2021 pattern took weeks to build and weeks to confirm. Anyone calling altseason on a 48-hour move is selling you the headline, not the data.
That is the discipline this framework exists to enforce. A rotation is a regime change, and regime changes leave footprints in all three gauges at once. One gauge turning is noise. Two is a signal worth watching. Three is the trade.
The checklist: five conditions, two kill signals
Here is the whole framework on one page. Print it, or save it, and check it against the tape each morning instead of checking your timeline.
Dominance closes below 60% and keeps falling for a week, not a day. A single daily close below 60% is a wobble; a week of lower closes is a trend.
ETH/BTC turns up and Ethereum reclaims its 200-day moving average. The bridge asset has to lead — if ETH cannot lead, nothing smaller will.
TOTAL3 breaks higher with rising volume. The altcoin pool has to grow in dollars, not just in dominance math.
The Altcoin Season Index crosses 50, then 75, and stays there. The breadth has to confirm the price action.
Stablecoin supply stops shrinking and starts growing again. Fresh money has to enter the system; rotation without inflows is just reshuffling a shrinking pile.
And the two kill signals, either of which ends the thesis on the spot: dominance closes above the 61.25% resistance and holds it, or Bitcoin breaks $70,000 and the whole market reprices lower together — in which case dominance will rise for the worst reason of all, and no altcoin will be spared.
If all five conditions check out, the rotation is real, and the right move is to size into it in order — large caps first, mid caps second, the long tail last, exactly as 2021 taught. If two or fewer check out, the right move is to wait. Waiting is a position. In a market where fewer than one in ten altcoins beat Bitcoin over the past two weeks, waiting has been the best-performing position of the month.
The line is 61%. The gauges are TOTAL3, ETH/BTC, and stablecoin supply. The index reads 31. None of the five conditions is met, and both kill signals are live. That is not a prediction that altseason will never come. It is a measurement that it has not come yet — and a checklist for knowing the morning it does.
Watch the PPI on Friday, watch whether dominance holds or rejects at 61.25%, and watch whether the stablecoin drain stops. That is where the next decision gets made.
Track real-time institutional orderflow, liquidity heatmaps, and whale positioning across global crypto venues with the CoinXSight Intelligence Terminal.
Disclaimer: This article is for informational purposes only and does not constitute financial advice. Figures are cited from official releases and market data as reported at the time of writing and are subject to revision. Cryptocurrency markets are volatile; always do your own research before making investment decisions.
CX
CoinXSight Alpha Desk
ALPHA // DESK
Quantitative Research Desk·Global Alpha Division
CoinXSight Institutional Research Desk produces quantitative crypto market intelligence, algorithmic models, and on-chain forensics.
QUANTITATIVE SUITE // DEEP ALPHA ENGINEACTIVE
BTC/USDT // LIVE SCANNER
CONFLUENCE 74
LIVE SPOT PRICE$82,807.47WEAK_BUY
TP2
$89,522.75
+9.07%
TP1
$85,056.42
+3.63%
ENTRY
$82,078.86
ZONE
SL
$80,590.09
-1.81%
Auto-detect Order Blocks, Fair Value Gaps and risk-adjusted DCA ladders in < 5s.