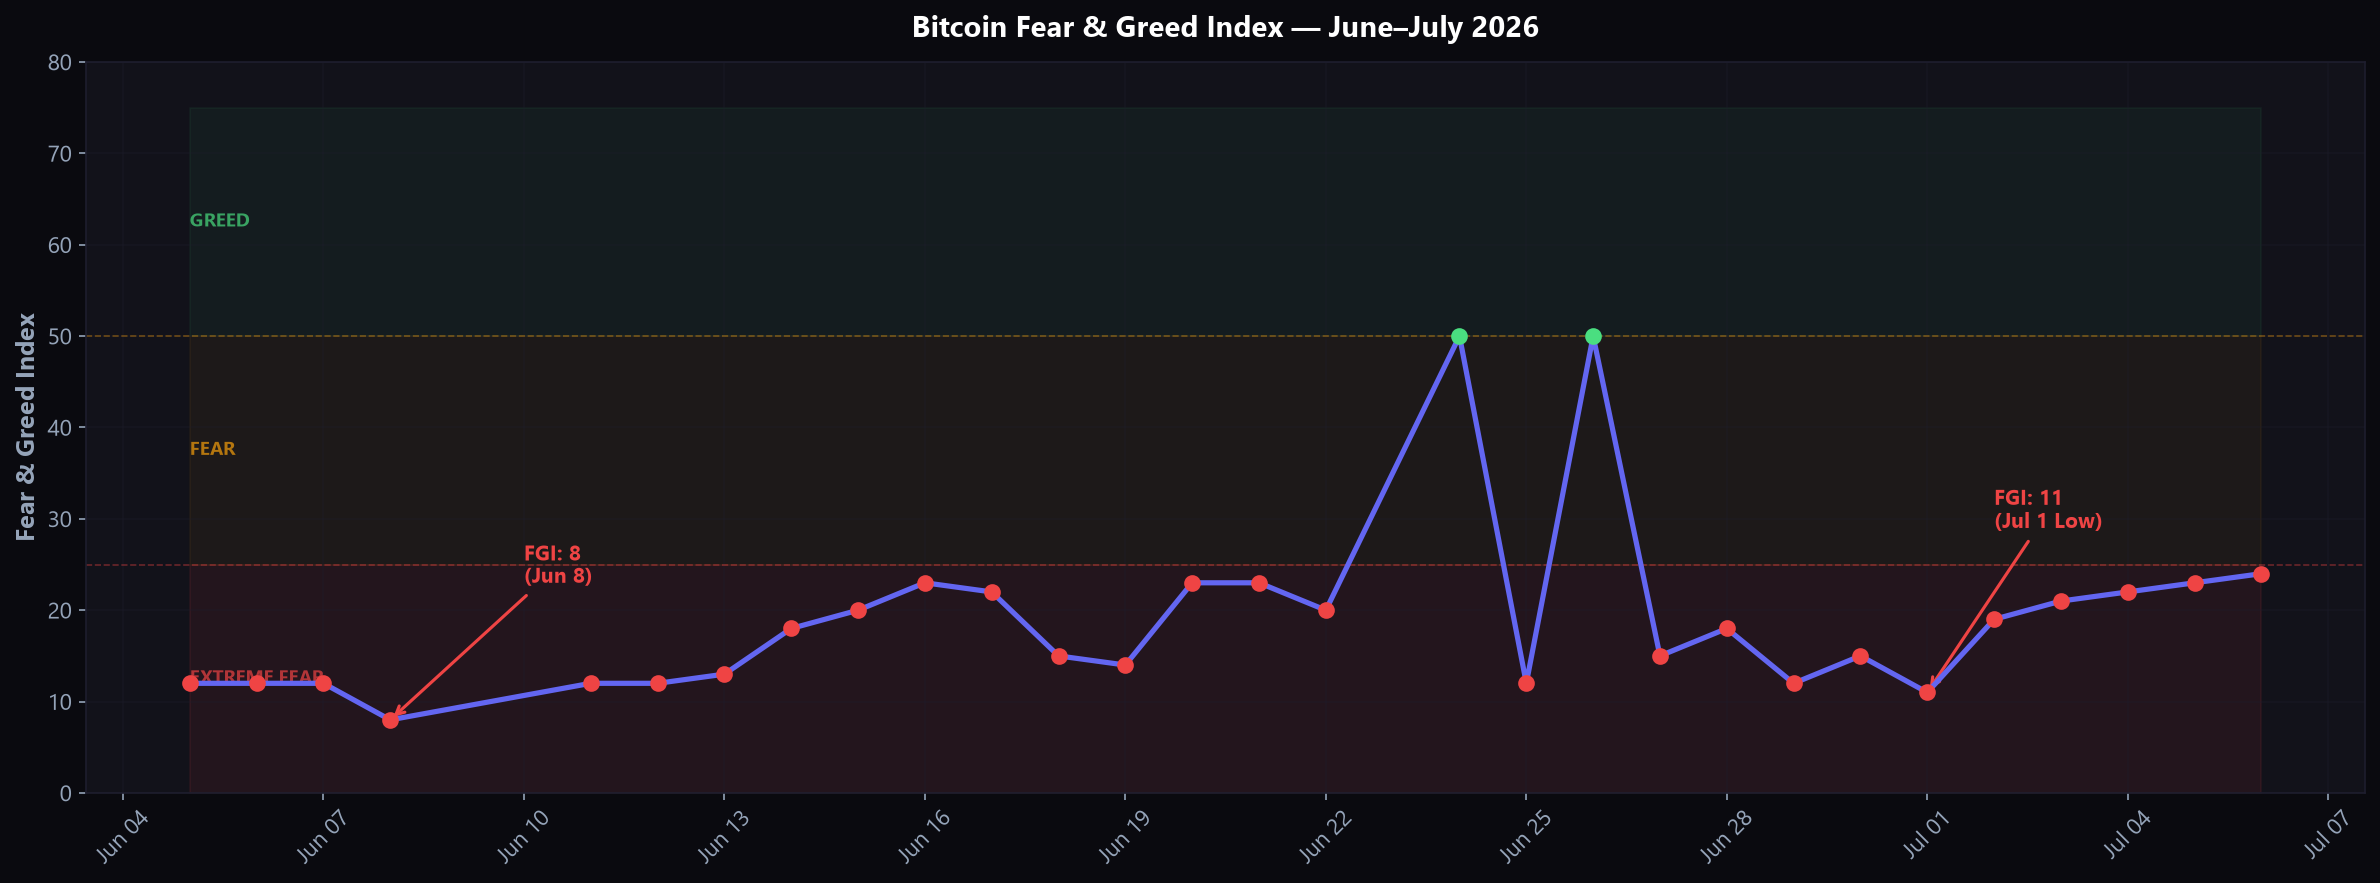
Bitcoin closed July 2026 at $63,006, recovering +7.3% from a Fear & Greed Index low of 11 (Extreme Fear) on July 1. Beneath this steady recovery, on-chain data reveals $1.15 billion in whale exchange deposits and a dramatic shift from accumulation to distribution signals across the broader crypto ecosystem.
As we step into August, Bitcoin (BTC) sits at a critical juncture. The world's premier digital asset is up 4.2% over the last 30 days, navigating an uncertain path from the mid-$58k levels. But a deeper look into the charts—whether you are using the best crypto exchange for volume profiling or a dedicated crypto trading platform for order flow—combined with massive on-chain whale movements and systemic alpha signal shifts, suggests that the surface-level recovery may be masking a significant distribution phase.
In this comprehensive technical analysis guide, we will analyze Bitcoin's July 2026 trajectory using advanced charting techniques, proprietary on-chain flow analysis, and multi-timeframe indicator confluence. Whether you are a discretionary swing trader or an algorithmic quantitative researcher, this analysis will give you the actionable insights needed to navigate the coming volatility.
1. Market Context & Price Overview: The Tale of July 2026
To understand where Bitcoin is going, we must first deeply contextualize where it has been. The story of July 2026 was one of extreme psychological testing followed by a slow, grueling grind upward against a backdrop of hidden selling pressure.
The Macro Price Action
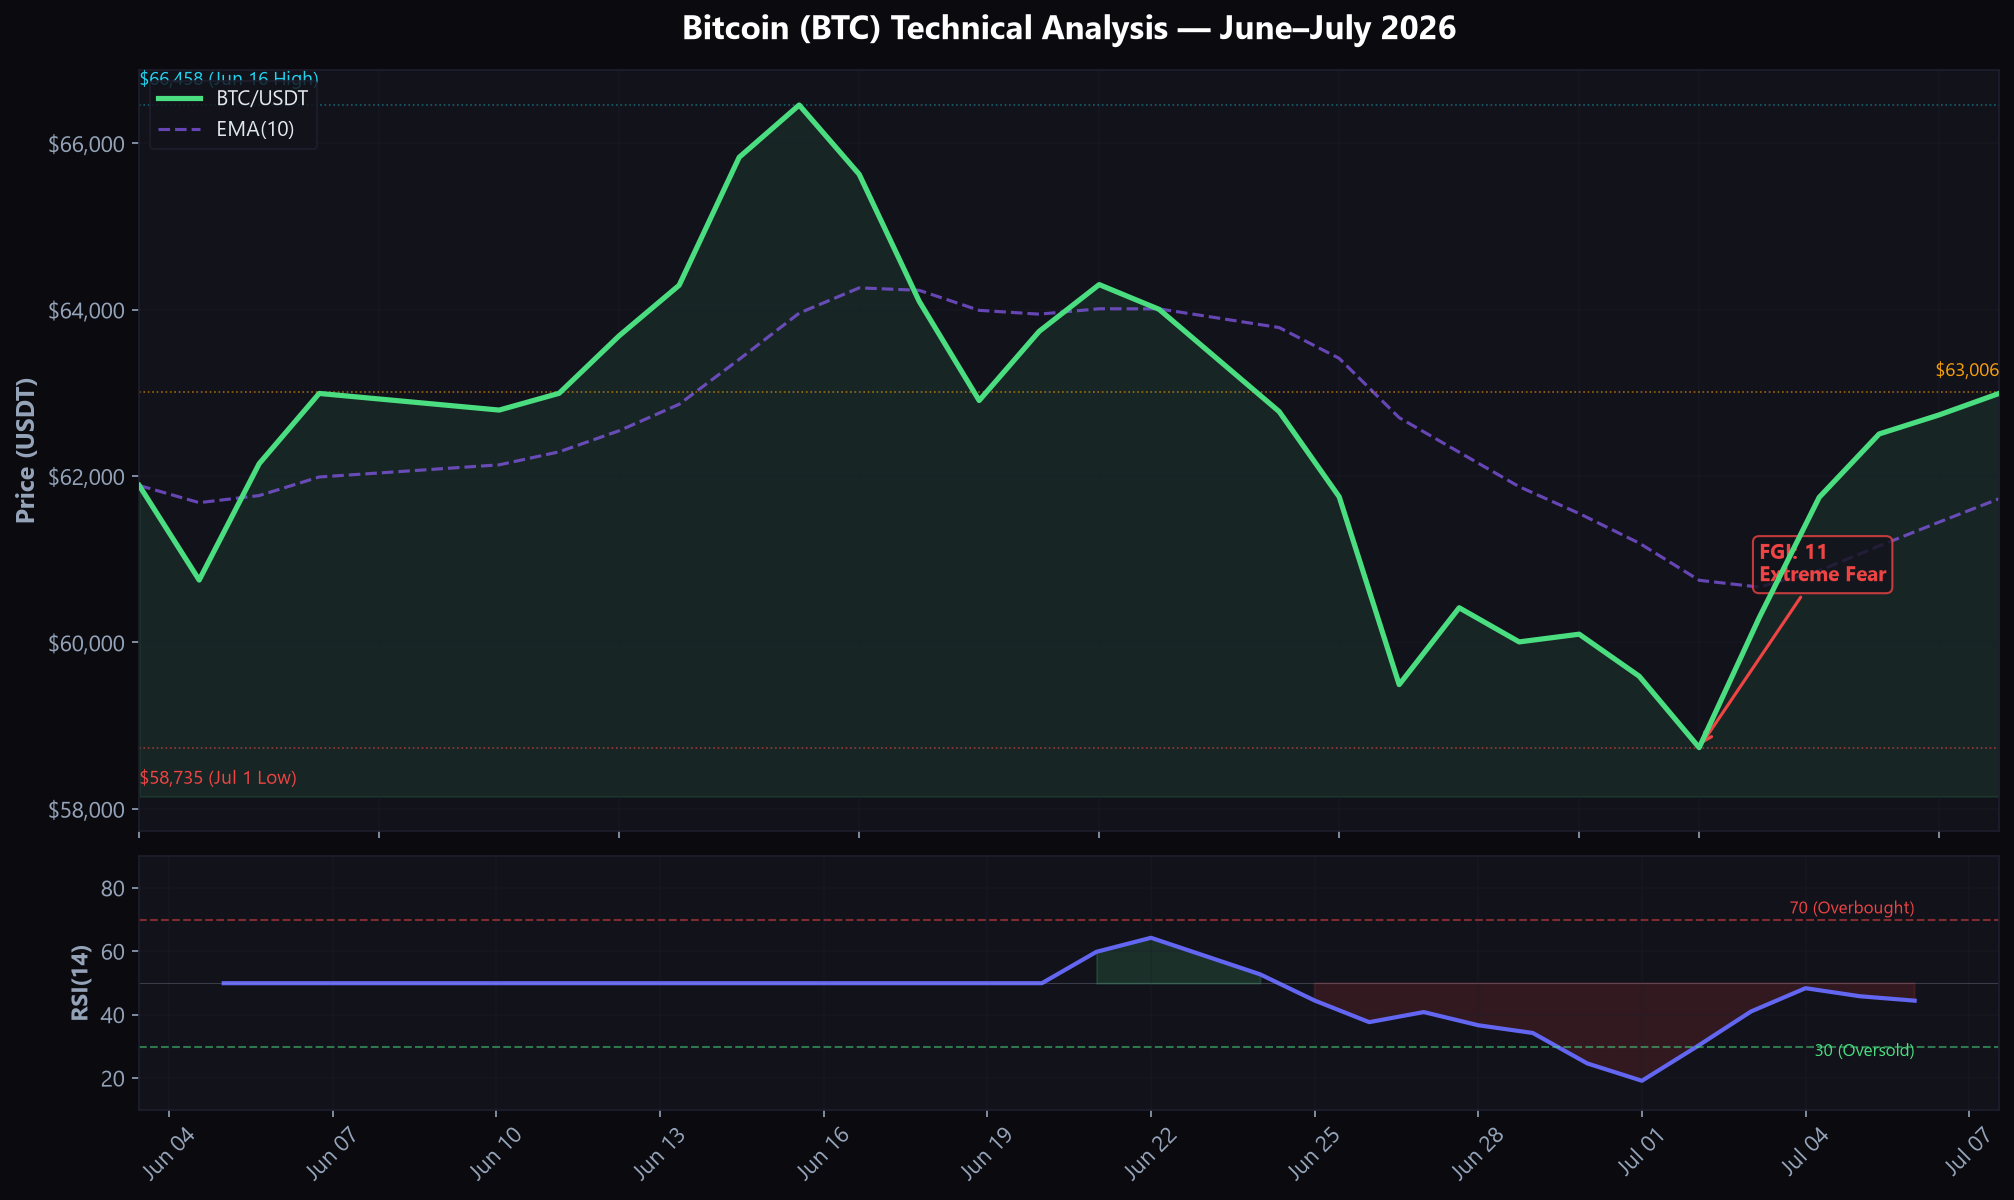
At the beginning of July, the market was enveloped in capitulation. On July 1, the Fear & Greed Index plummeted to an astonishing 11 (Extreme Fear), one of the lowest readings we have witnessed since the bear market depths. Bitcoin's price was hovering at $58,735, threatening to break down into the mid-$50k range.
However, instead of collapsing, BTC staged a textbook accumulation phase at local support. By July 6, the price had crept up to $62,993, and the Fear & Greed Index slowly thawed to 24. Over the course of the 30-day window, we witnessed a journey from $58,735 to our current standing at $63,006 (+7.3%).
The Hidden Regime Shift: Accumulation to Distribution
While the price chart shows a steady upward slope, our proprietary Alpha Signal data reveals a dramatic structural shift beneath the surface.
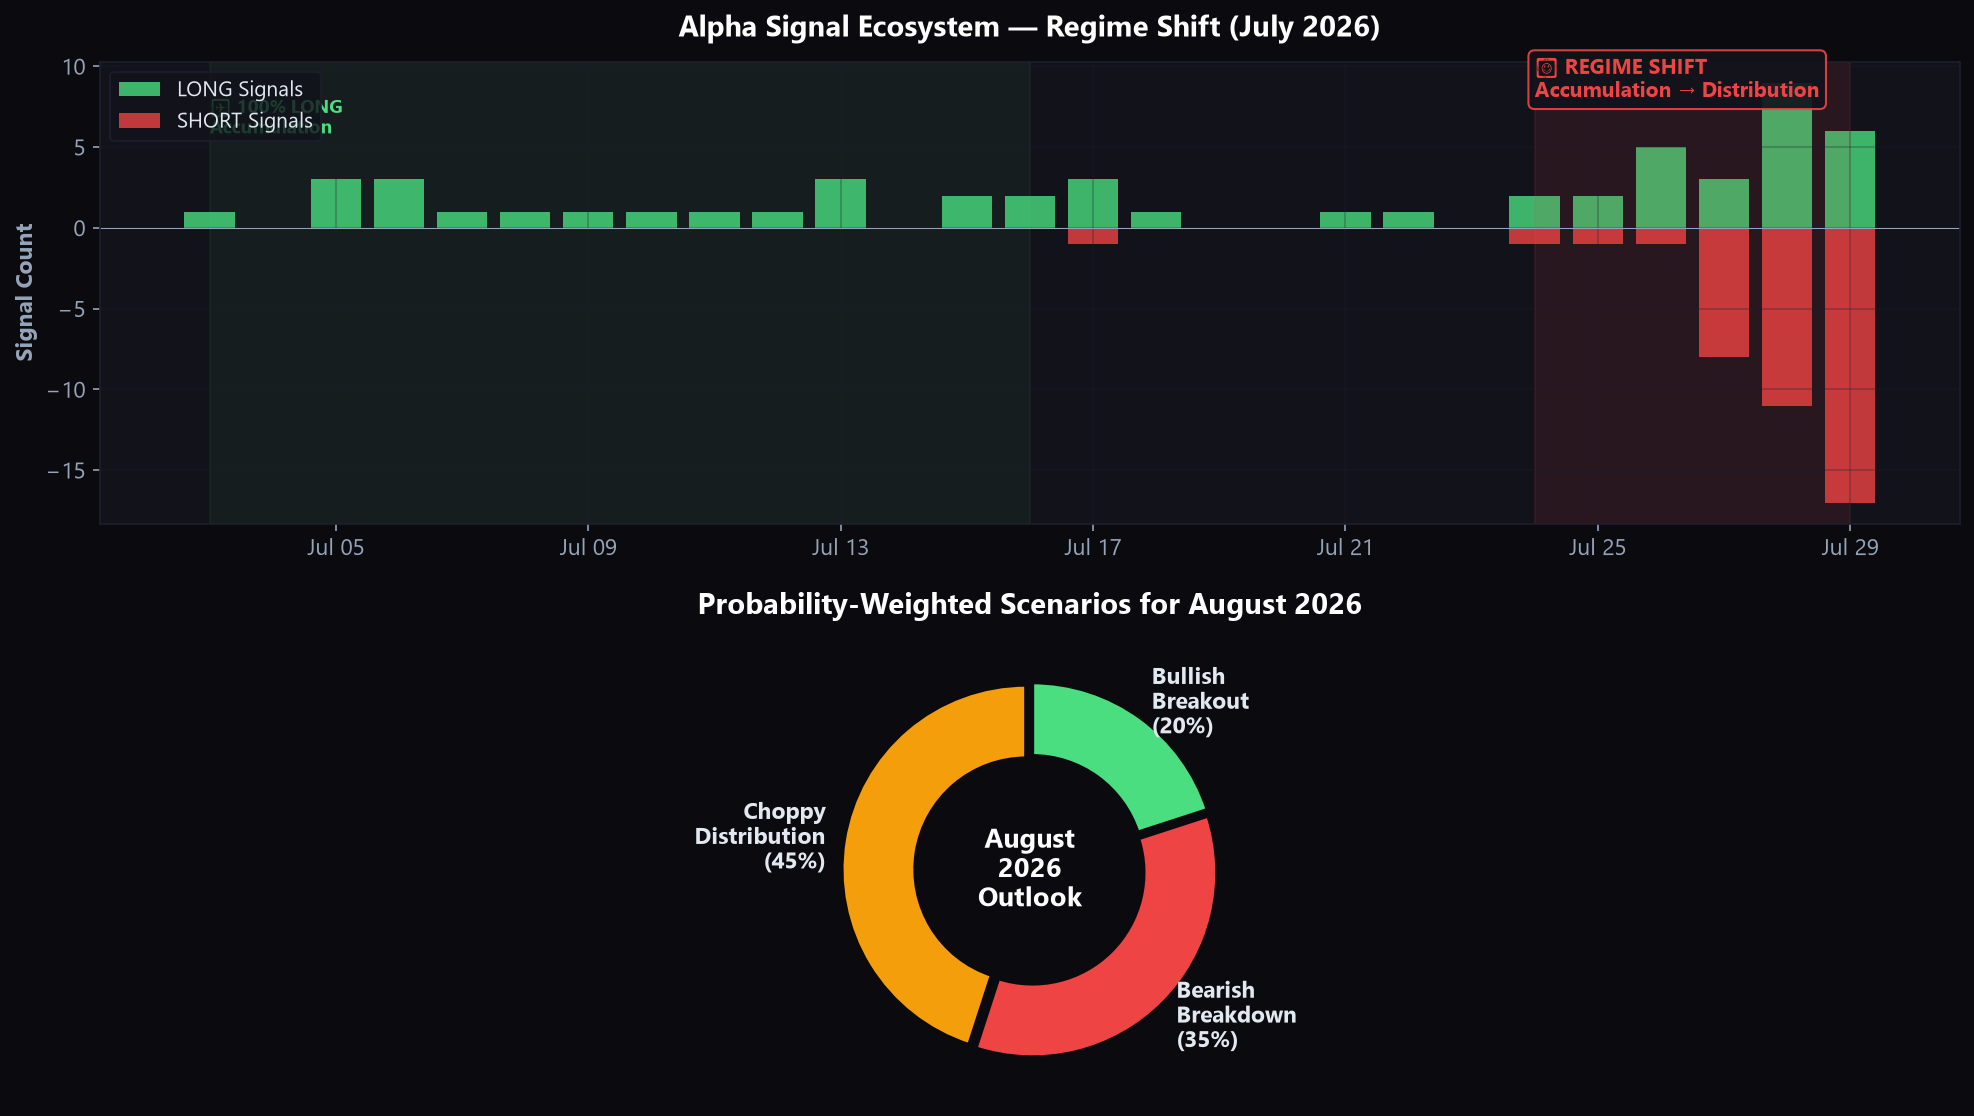
In Early July (July 1-10), the market was in a state of uniform accumulation. Across the crypto ecosystem, 100% of our algorithmic signals were LONG, identifying bullish patterns like Double Bottoms and Ascending Triangles on assets like PENDLE, YFI, and JUP.
However, by Late July (July 22-29), the landscape shifted violently. We recorded a massive wave of Wyckoff Upthrust SHORT signals across major altcoins including TRX, APT, ALGO, DOGE, and BNB. This structural shift from 100% LONG to majority SHORT indicates that smart money used the July recovery to distribute their holdings into retail liquidity.
[!WARNING]
Regime Shift Alert: When altcoins flash synchronized Wyckoff Upthrust patterns while Bitcoin grinds higher, it typically signals a broader market distribution phase. Do not mistake a low-volume price crawl for genuine bullish momentum.
The Whale Flow Anomaly
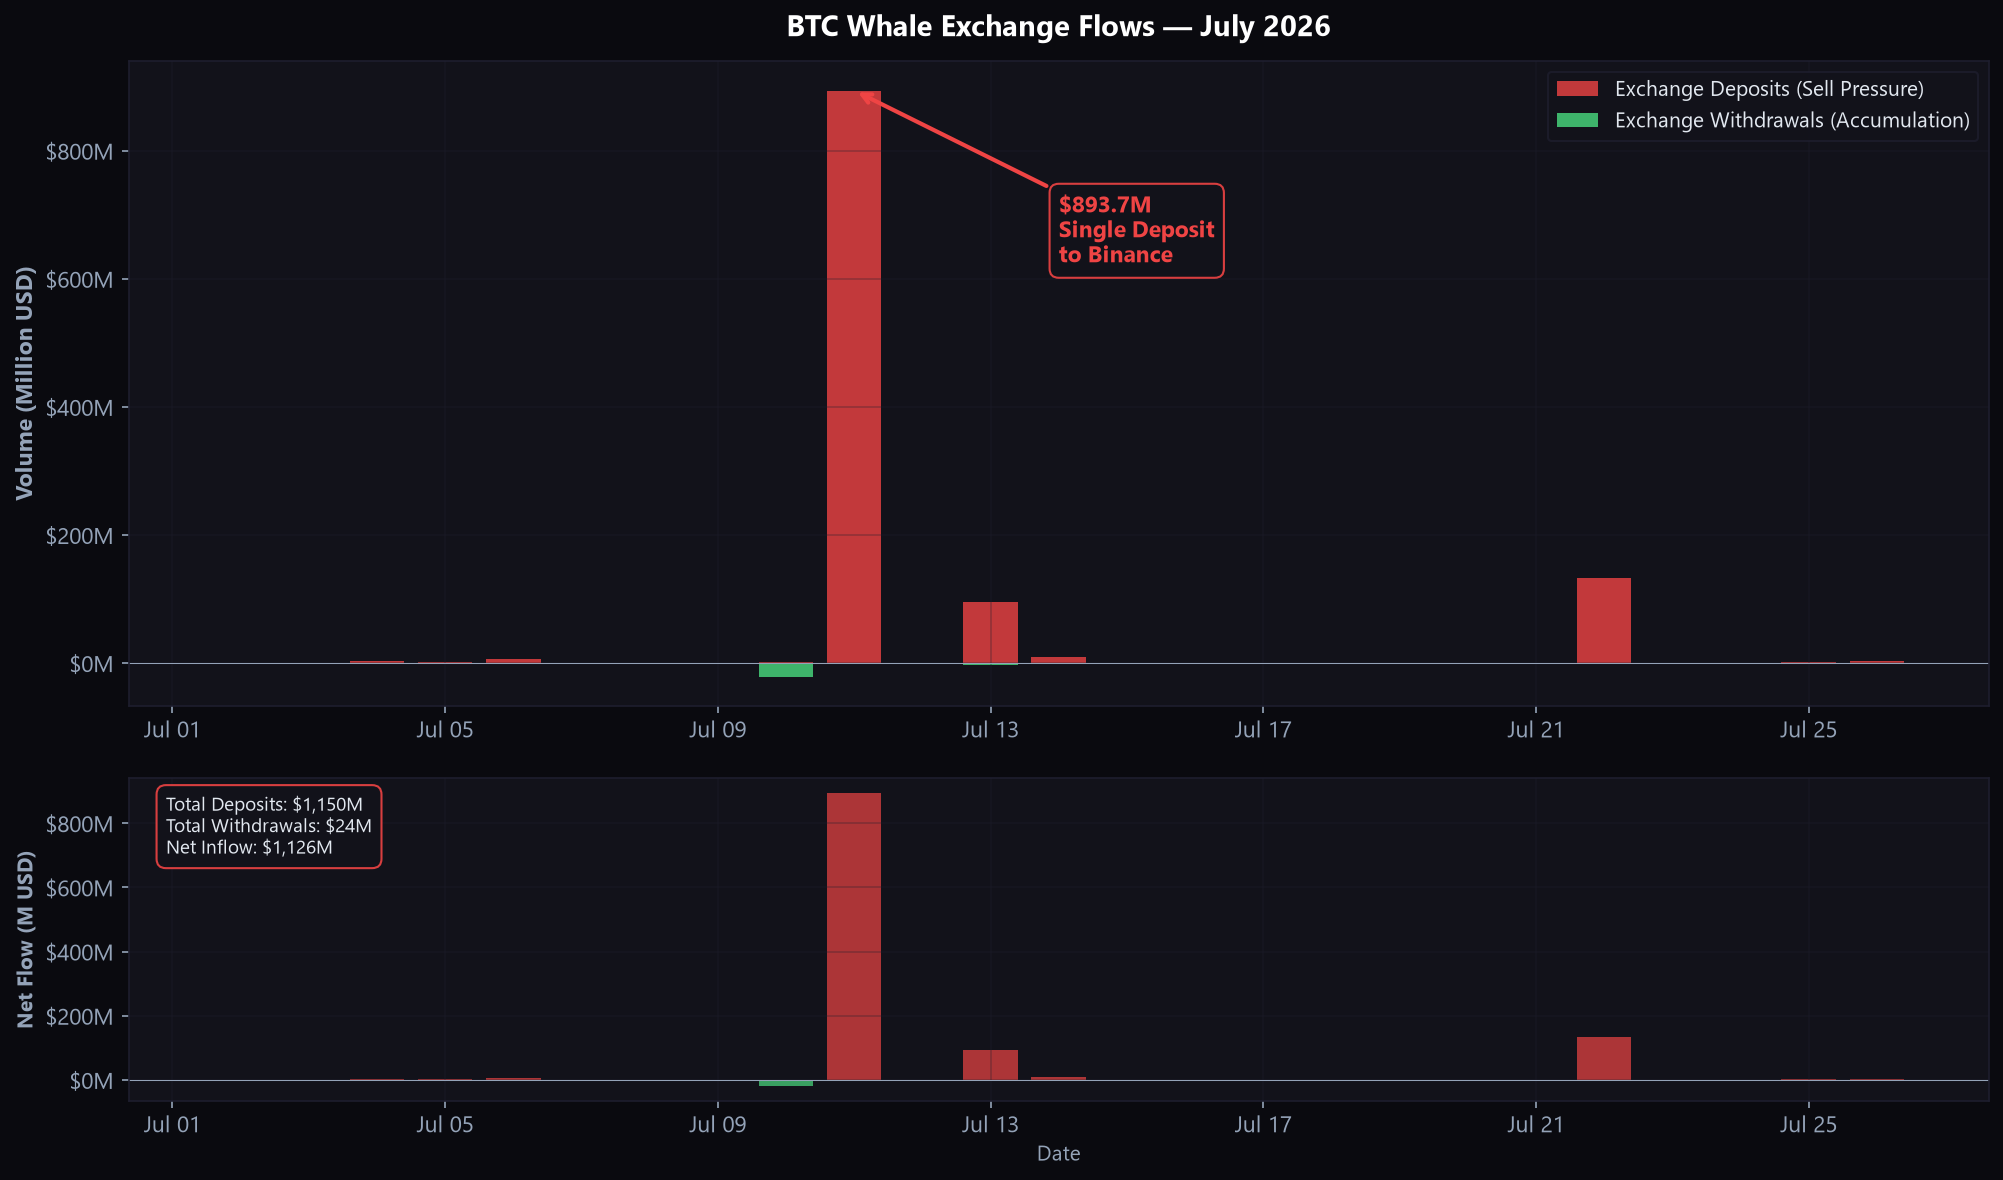
This distribution thesis is heavily supported by on-chain data. During July 2026, we tracked a staggering $1.15 Billion in whale deposits to major exchanges across 34 transactions, compared to a mere $24.2 Million in withdrawals. This net inflow of -$1.126B heavily skewed toward selling pressure.
Example — $893.7M BTC Deposit Alert on CoinXSight Whale Tracker (July 11, 2026)
CoinXSight's Whale Tracker flagged a single transaction of $893.7 million deposited to Binance. Historically, BTC exchange deposits exceeding $100M precede 2-5% price drops within 72 hours. In this case, BTC subsequently failed to break $64,500 resistance, confirming the distribution thesis.
2. Macro Environment: The Forces Shaping Crypto in July 2026
Bitcoin does not trade in a vacuum. Understanding the macroeconomic and geopolitical backdrop is essential for contextualizing the technical signals. July 2026 presented a complex mix of monetary policy inertia, softening inflation, sluggish GDP growth, and evolving regulatory dynamics—all of which directly influenced crypto market sentiment and capital flows.
2.1 Federal Reserve & FOMC: Higher for Longer
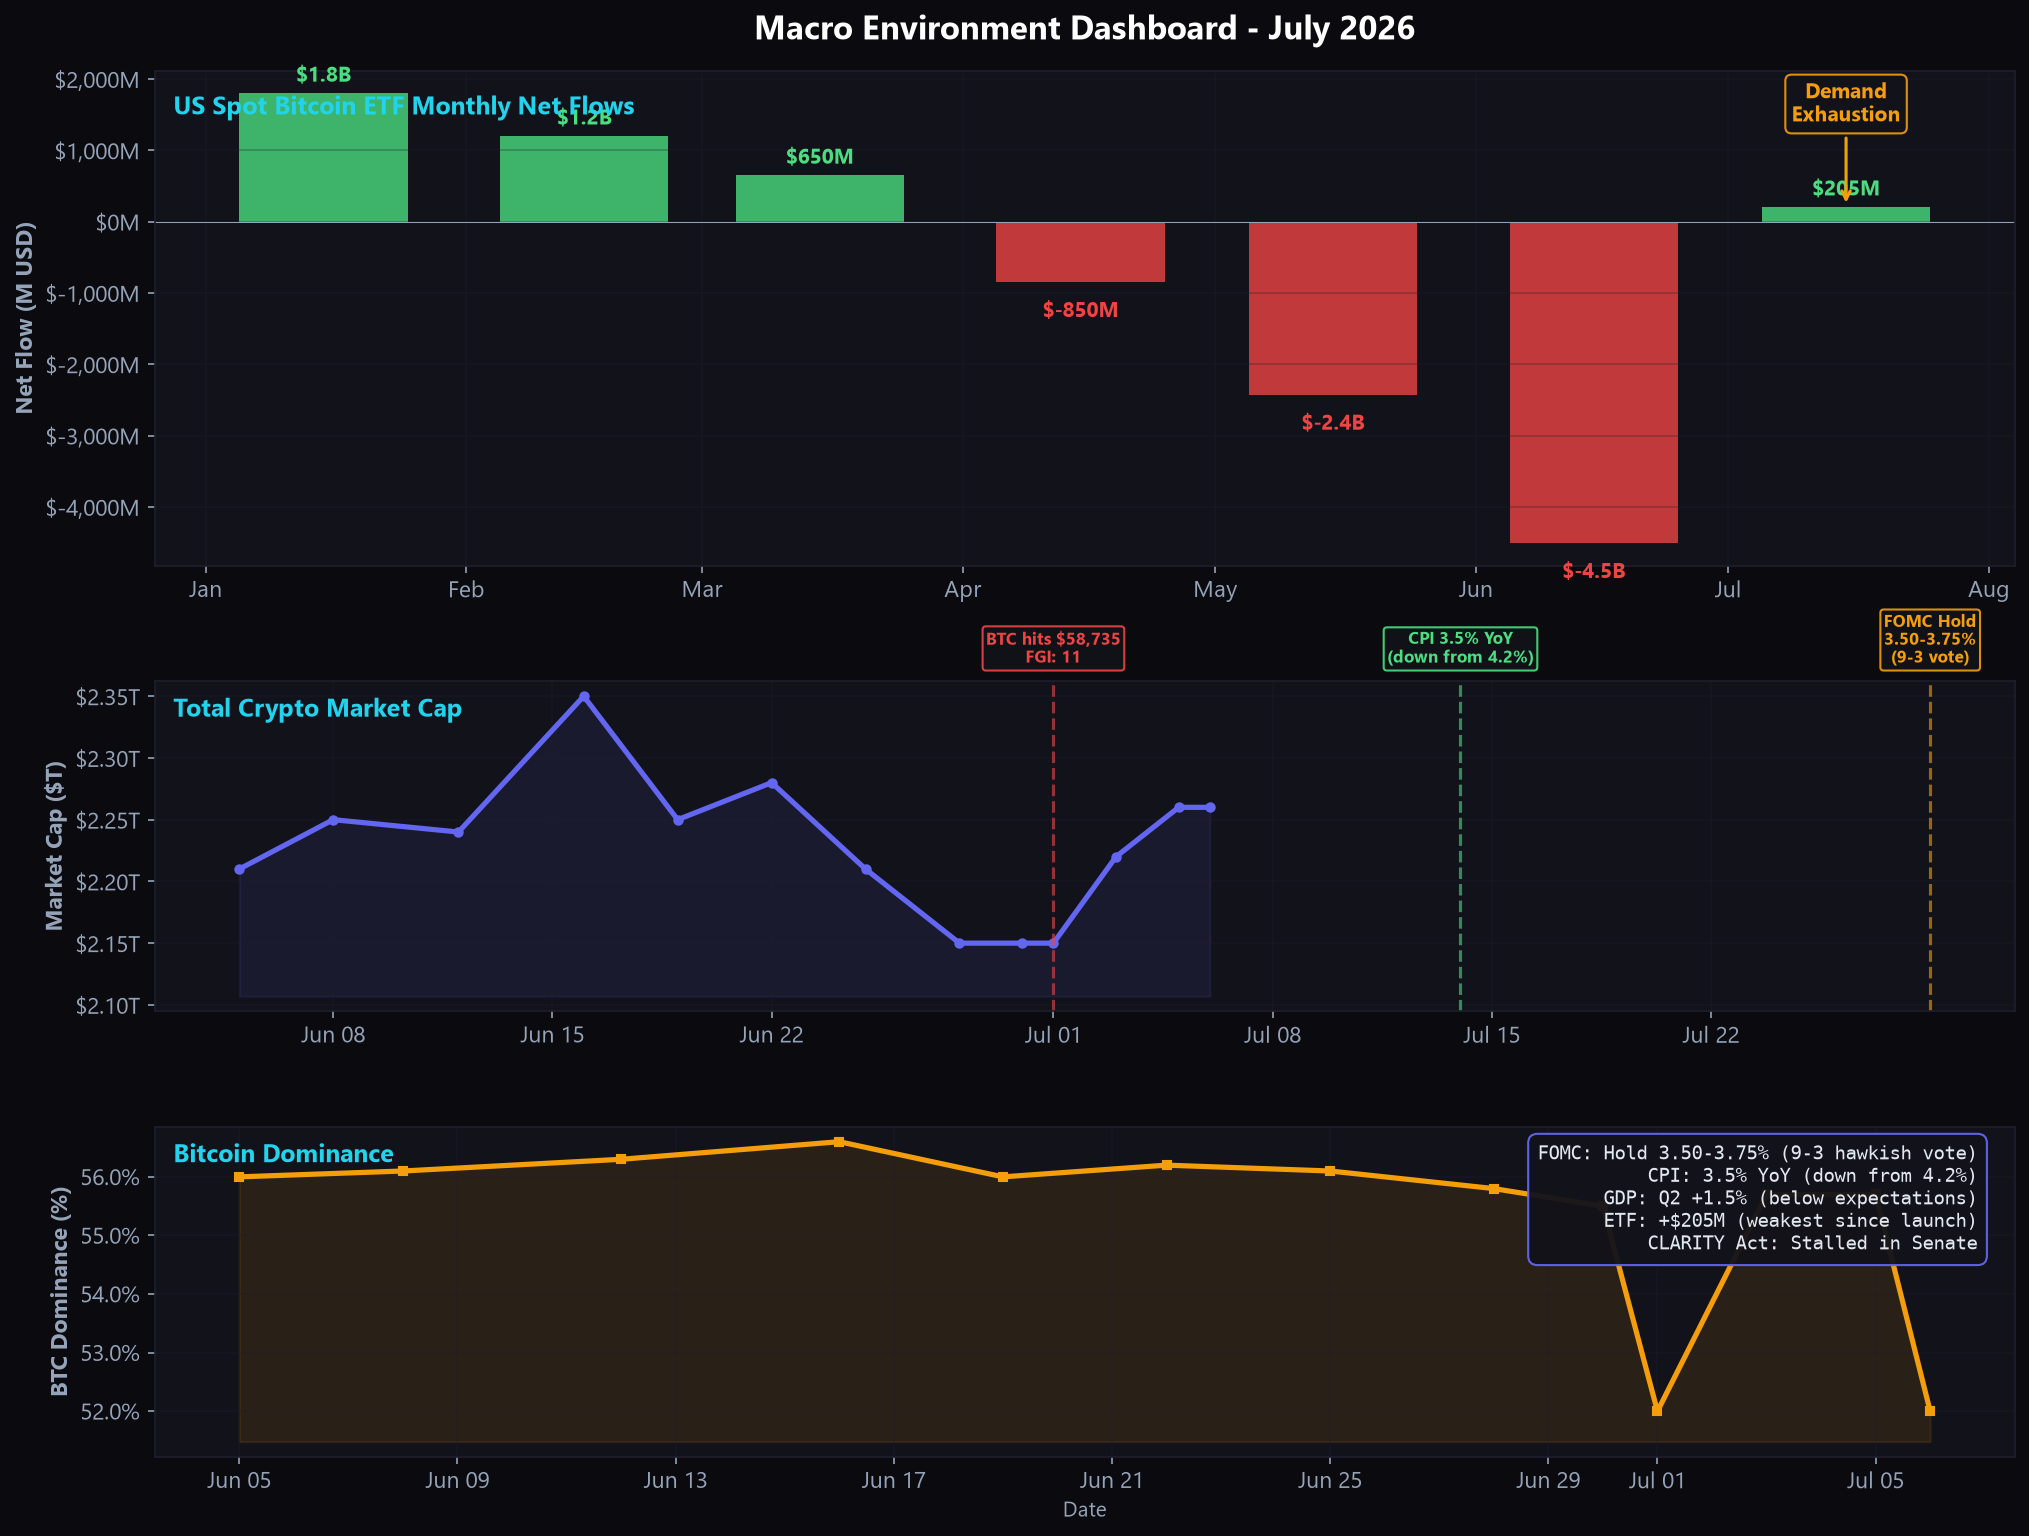
The FOMC concluded its July 28-29 meeting with a decision to hold the federal funds rate at 3.50%–3.75%—the fifth consecutive meeting without a change. The decision passed with a 9–3 vote, a hawkish signal as three members (Hammack, Kashkari, Logan) dissented in favor of a 25 bps rate hike.
Impact on Crypto: The "hold" was largely priced in, resulting in only a ~1% BTC uptick to $64,400 post-announcement. However, the hawkish dissents reinforce a "higher for longer" narrative that continues to pressure risk assets. The cost of capital remains elevated, reducing the attractiveness of zero-yield assets like Bitcoin relative to 5%+ Treasury yields.
[!IMPORTANT]
Key Takeaway: Three FOMC dissents favoring a rate hike is the strongest hawkish signal since Q1 2025. Watch the September FOMC meeting closely—if CPI ticks up, a surprise hike could trigger a 10-15% crypto correction.
2.2 CPI & Inflation: A Brief Relief Rally
On July 14, the Bureau of Labor Statistics released June 2026 CPI data showing headline inflation at 3.5% YoY, down from 4.2% in May. The monthly CPI declined 0.4%, the largest one-month drop since April 2020, driven primarily by a 5.7% collapse in energy costs.
Impact on Crypto: BTC surged toward $65,000 mid-month on the softer CPI print, as markets briefly repriced Fed rate hike probabilities lower. However, the rally was short-lived—core CPI (excluding food and energy) remained sticky at 3.1%, suggesting that the disinflationary impulse was energy-driven rather than structural. This aligns with the "dead cat bounce" pattern we observed in the RSI analysis.
2.3 GDP & Trade War Headwinds
U.S. Q2 2026 GDP grew at an annualized rate of just 1.5%, decelerating from 2.1% in Q1 and below consensus expectations. Net exports and inventories subtracted 1.7 percentage points, reflecting the ongoing impact of Section 301 tariff expansions across approximately 60 trading partners.
Impact on Crypto: The sluggish GDP print reinforced Bitcoin's recent correlation with high-beta tech stocks. As institutional investors rotated capital into AI-focused equities, crypto experienced capital outflows. The tariff-induced "risk-off" environment contributed to the broader defensive posture seen across digital asset markets throughout Q2.
2.4 Bitcoin ETF Flows: Demand Exhaustion
U.S. spot Bitcoin ETFs recorded a mere $205 million in net inflows for July—the weakest monthly total since the products launched in January 2024. This follows massive outflows of $2.43B (May) and $4.51B (June).
Period
ETF Net Flow
Key Event
May 2026
-$2.43B
Tariff escalation sell-off
June 2026
-$4.51B
FOMC hawkish hold + geopolitical risk
July 2026
+$205M
Demand exhaustion / indecision
Jul 30
+$233.1M
IBIT led with $183.4M (79% of total)
Jul 31
-$265.4M
Month-end reversal; IBIT -$122.7M
BlackRock's IBIT maintained ~50-60% market share ($46-47B AUM) but experienced volatile daily swings. Notably, Ethereum ETFs outperformed Bitcoin ETFs in July, attracting $342.85M—a sign of potential capital rotation within the crypto ecosystem.
2.5 Regulatory Landscape: Stalled Clarity
The Digital Asset Market CLARITY Act passed the House in July 2025 and cleared the Senate Banking Committee in May 2026, but stalled on the Senate floor before the August recess. Senate Majority Leader Thune cited a crowded legislative calendar, pushing crypto market structure legislation to Q4 at the earliest.
Meanwhile, SEC Chair Paul Atkins signaled the agency is "ready, willing, and able" to write its own crypto market rules if Congress fails to act. The SEC's Spring 2026 Unified Agenda includes three crypto-specific rulemaking initiatives: token offering pathways, broker-dealer custody amendments, and digital asset exchange structure rules.
The GENIUS Act (stablecoin framework) is already law since July 2025, with full enforcement beginning January 2027. This regulatory asymmetry—stablecoins regulated but market structure unclear—creates a "limbo" effect that keeps institutional capital cautious.
[!NOTE]
Macro Summary for Traders: The macro environment in July 2026 was characterized by monetary policy inertia (Fed hold with hawkish lean), a temporary disinflationary impulse (CPI 3.5% from 4.2%), sluggish growth (GDP 1.5%), collapsing ETF demand ($205M vs. billions in prior months), and regulatory uncertainty (CLARITY Act stalled). This backdrop favors a range-bound, distribution-heavy market rather than a decisive breakout in either direction.
3. RSI Analysis (Relative Strength Index)
The Relative Strength Index (RSI) is a momentum oscillator that measures the speed and change of price movements on a scale of 0 to 100. RSI was developed by J. Welles Wilder Jr. and introduced in his 1978 book New Concepts in Technical Trading Systems. It is our primary tool for identifying overbought (>70) and oversold (<30) conditions, as well as divergence between momentum and price.
How the RSI Functioned in July
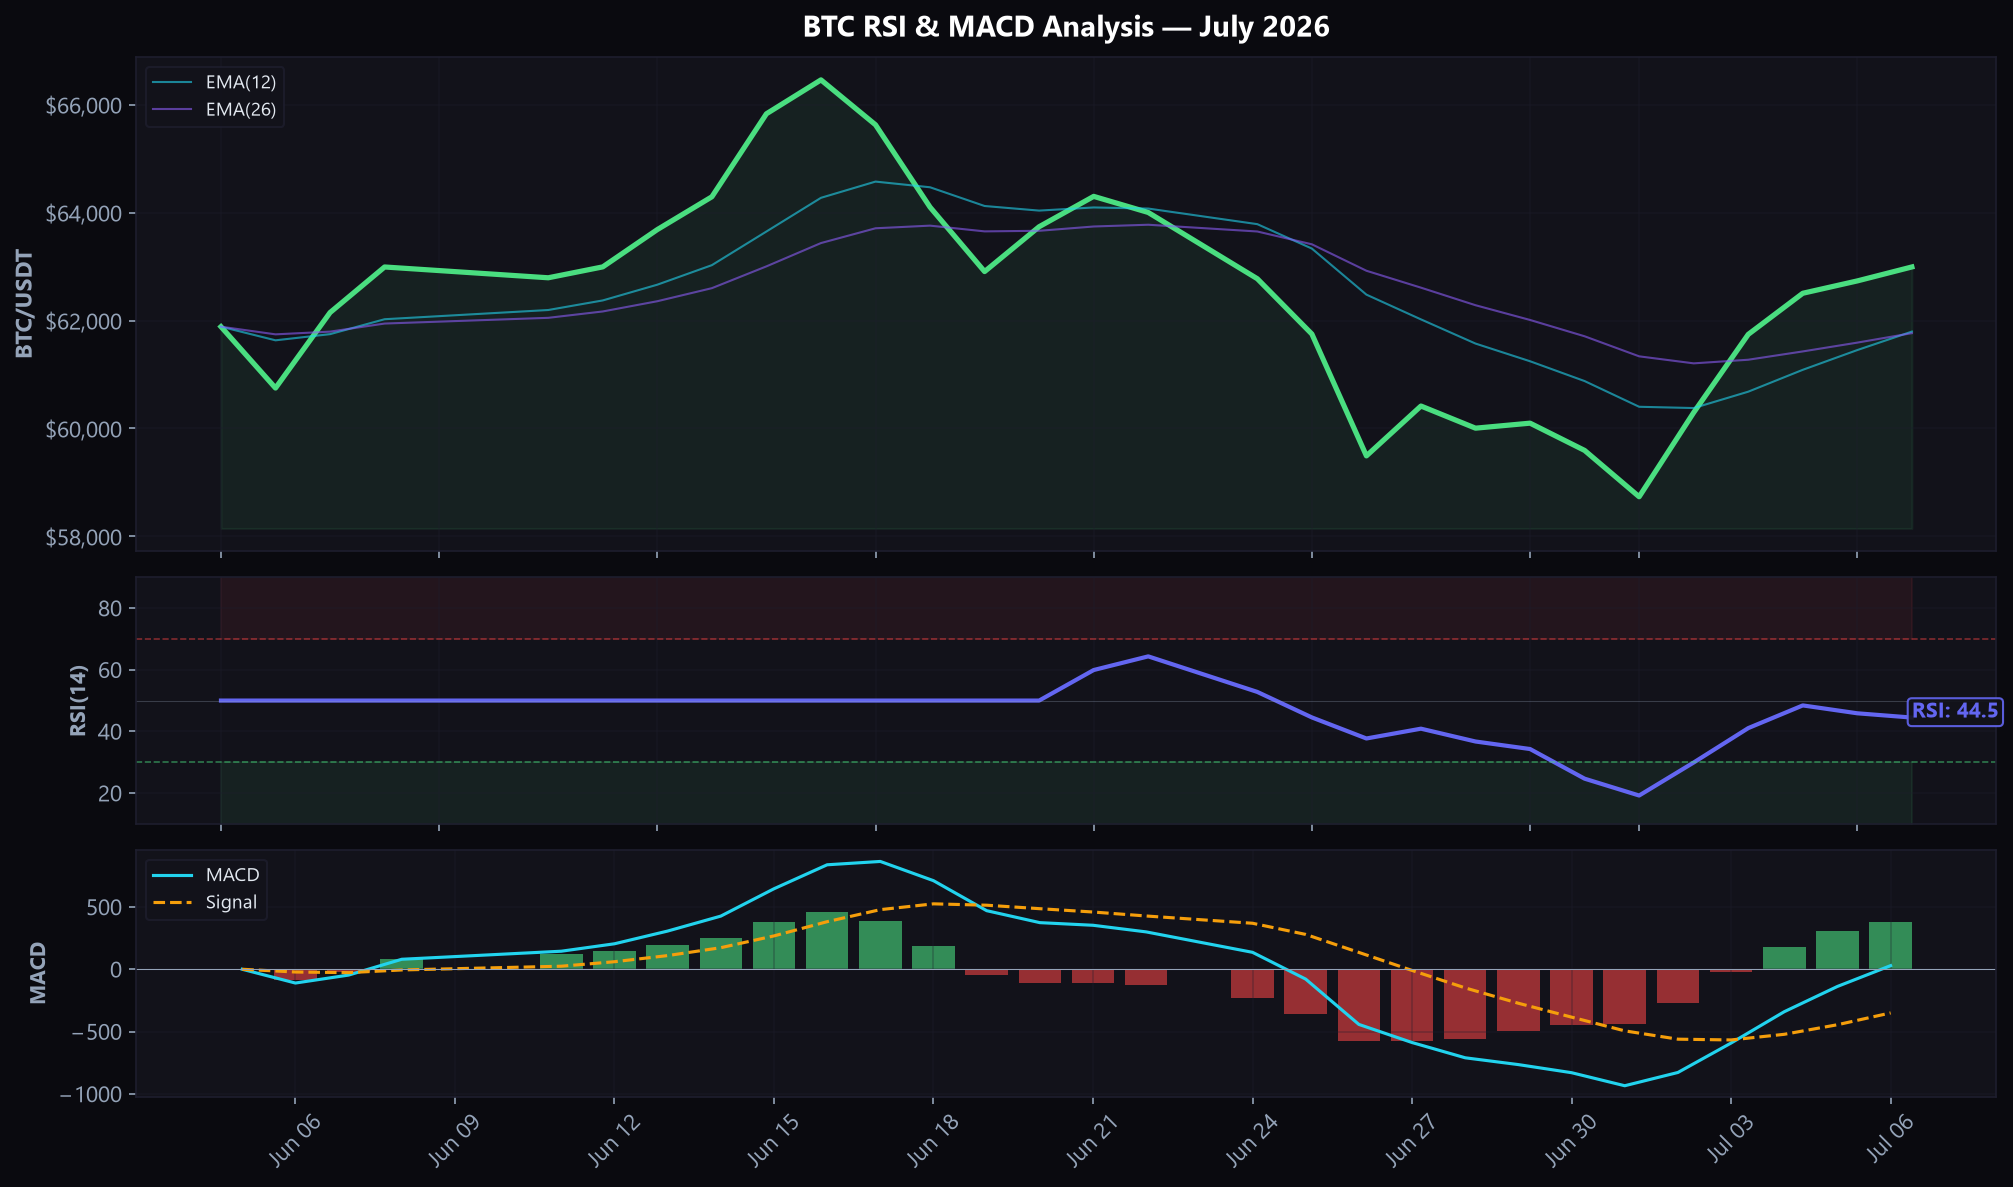
Early July provided a textbook RSI reset. As price dropped to $58,735, the daily RSI dipped into the high 20s, perfectly aligning with the Extreme Fear reading of 11.
Example — BTC RSI Recovery on CoinXSight Deep Alpha (July 13, 2026)
When BTC traded at $62,274, the Deep Alpha module's Alpha Scanner flagged a LONG signal based on a Falling Wedge pattern with 55 confluence. The RSI(14) sat exactly at 50.0 — the neutral equilibrium. The AI reasoning noted: "Volume is declining, indicating weakening selling pressure." Within 10 days, BTC reached $64,430, validating the signal's $65,792 target trajectory.
Current RSI Readings and Divergence
As of August 1, with BTC at $63,006, the daily RSI is hovering around 54. It is in a constructive but vulnerable state.
More importantly, we are observing a Hidden Bearish Divergence on the 4-hour timeframe. While Bitcoin's price has managed to print slightly higher highs throughout the latter half of July, the RSI has been printing lower highs. This indicates that the upward momentum is exhausting, matching our on-chain data regarding massive exchange inflows.
Example: On July 22, Bitcoin pushed toward the top of its range near $64,430, but the RSI peaked lower than it did during the July 13 run-up to $63,500. This subtle exhaustion often precedes a sharp mean reversion.
4. MACD Analysis (Moving Average Convergence Divergence)
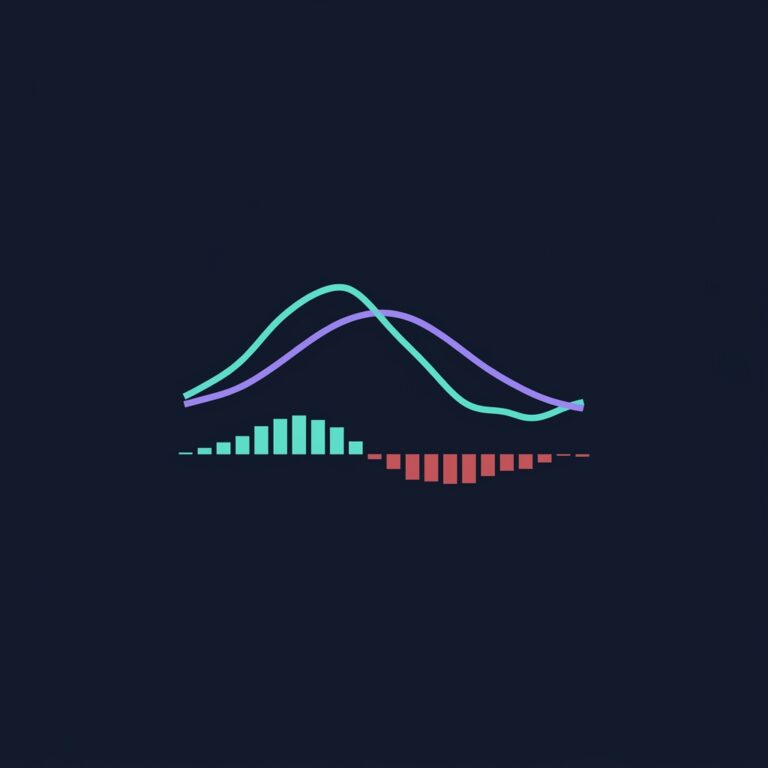
The MACD is a trend-following momentum indicator that shows the relationship between two moving averages of a security's price (typically the 12-period and 26-period EMAs). MACD was created by Gerald Appel in the late 1970s. Traders look for signal line crossovers, zero-line crosses, and histogram expansions to gauge trend strength.
The July MACD Anatomy
In the first week of July, the MACD line was deeply submerged below the signal line and well below the zero-line, confirming the bearish grip on the market. However, as the $58k support held, the MACD histogram began to print lighter red bars, indicating a loss of downward momentum.
By July 10, a bullish crossover occurred (MACD line crossed above the signal line). This mechanical buy signal provided the tailwind for the price to recover above $62,000.
Current Posture: The Fading Histogram
Currently, the MACD remains in bullish territory (above the signal line), but the histogram has begun to flatten and print smaller green bars. We are precariously close to a bearish cross on the daily chart if the price fails to sustain the $63,000 level.
The conflict between a slightly positive MACD and a structurally weak RSI is a classic hallmark of a choppy, range-bound market. The momentum is not decisive enough to fuel a breakout, yet not negative enough to trigger an immediate collapse.
5. Bollinger Bands Analysis
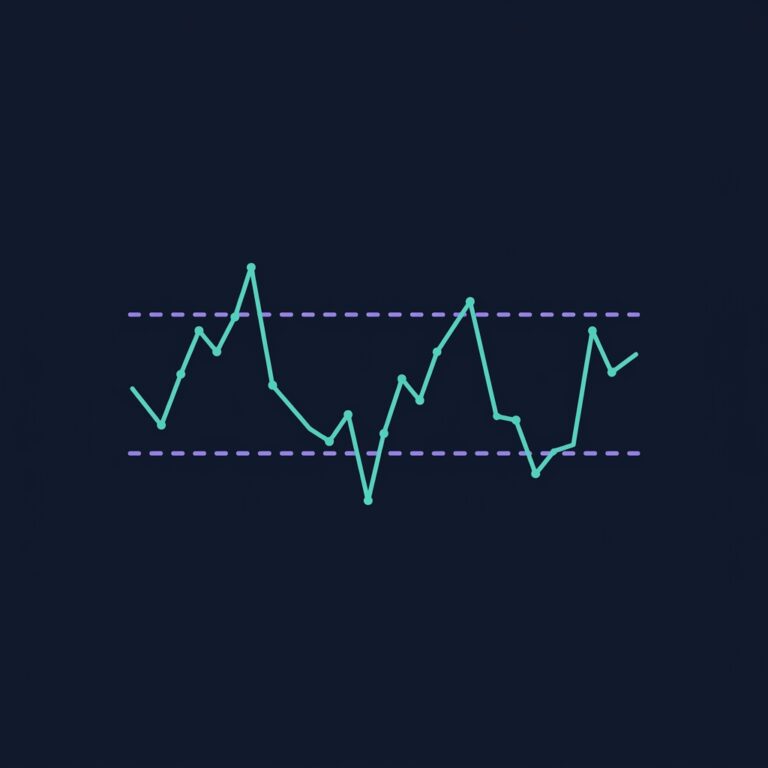
Bollinger Bands consist of a simple moving average (usually 20-period) and two standard deviation bands plotted above and below it. Bollinger Bands were developed by John Bollinger in the 1980s. They are exceptional for measuring volatility and identifying explosive breakout setups (the "squeeze").
The Great July Squeeze
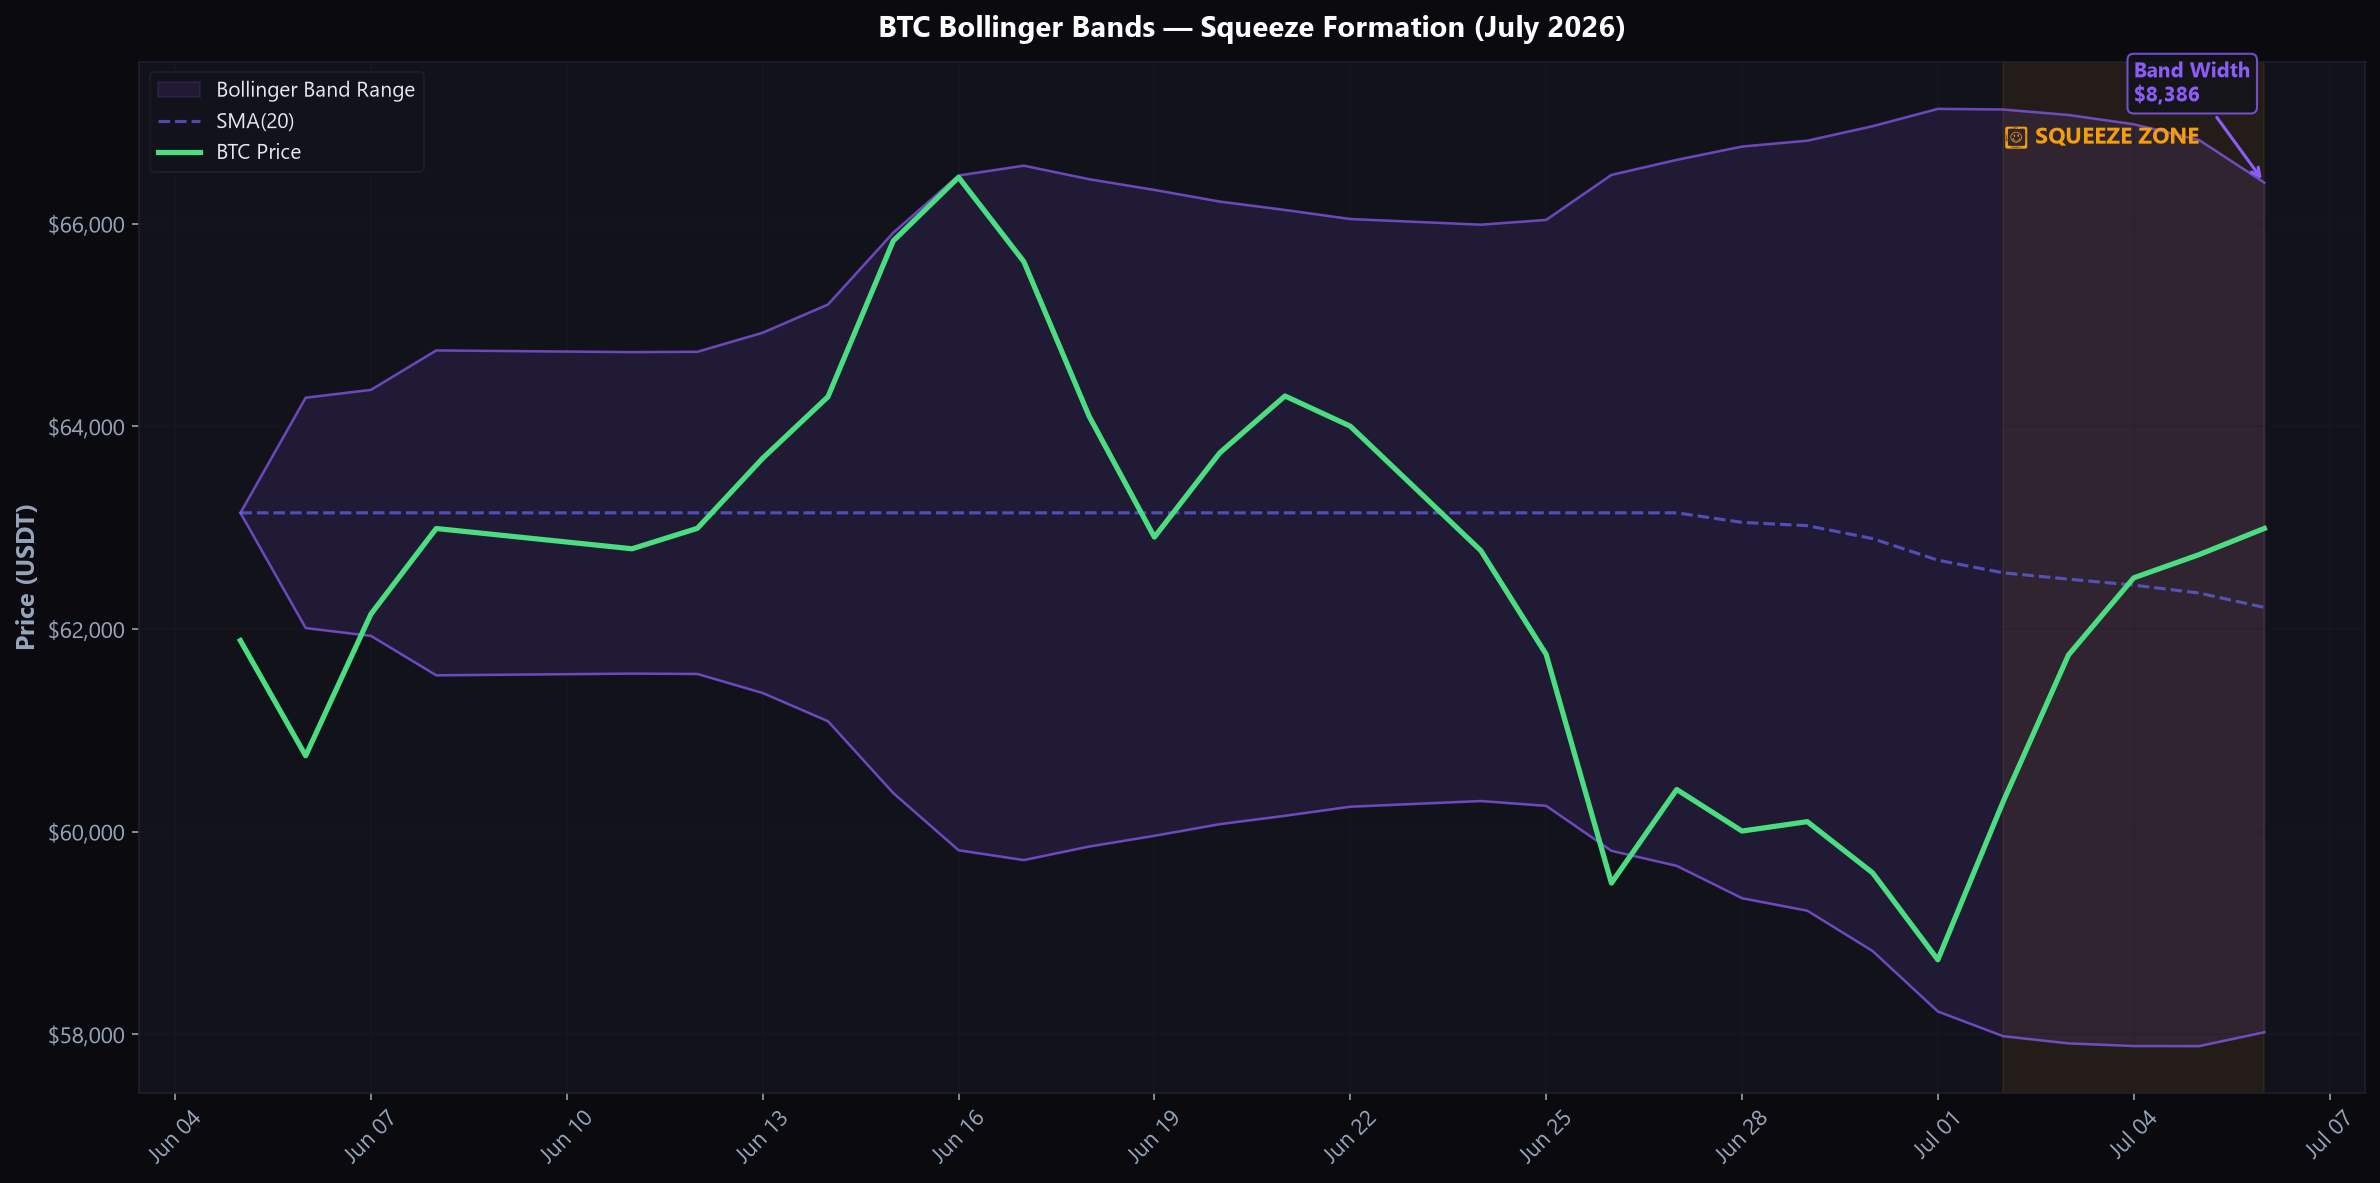
In June and early July, Bitcoin's volatility was relatively high, keeping the bands wide. But as price stabilized between $62,000 and $64,000 in late July, the Bollinger Bands contracted significantly.
We are currently experiencing a Bollinger Band Squeeze on the daily timeframe. The bandwidth is at its narrowest point in three months. Historically, when bands compress to this degree, a massive expansion (explosive move) is imminent.
[!TIP]
Trading the Squeeze: In a Bollinger squeeze, do not anticipate the direction of the breakout based solely on the bands. Wait for a decisive daily candle close outside the bands with above-average volume, and trade the continuation.
Given the heavy whale deposits and the altcoin distribution patterns noted earlier, the probabilistic skew leans toward a downward resolution of this squeeze, targeting the lower band currently sitting around $59,200.
6. Combined Indicator Synthesis
Technical analysis is rarely effective when looking at indicators in isolation. It is the confluence—or contradiction—of these tools that provides true insight.
Right now, our synthesis paints a picture of Tense Equilibrium:
Price Action: Higher lows (Bullish) but struggling at resistance.
RSI: Neutral (54) but showing hidden bearish divergence on lower timeframes.
MACD: Bullish crossover, but histogram momentum is dying.
Bollinger Bands: Extreme squeeze, preparing for a volatility spike.
On-Chain/Alpha: Massive distribution ($1.126B net inflow) and Wyckoff Upthrusts on altcoins (Highly Bearish).
The technicals suggest a market that is structurally intact on the daily timeframe but severely lacking the momentum to break out, while on-chain data suggests smart money is actively offloading bags.
On CoinXSight, these indicators don't work in isolation — they're part of the 4-layer Confluence Scoring system:
Trend Layer: EMA ribbon + Supertrend
SMC Layer: Order Blocks + Fair Value Gaps
Momentum Layer: RSI + MACD + StochRSI + MFI
Volume Layer: Volume ratio + Bollinger Bands
For BTC in late July, the Confluence Score reads 6.3/10 — reflecting the internal conflict between positive price action and weakening momentum signals.
7. Multi-Timeframe Technical View
A robust analysis requires stepping back to view the broader picture before zooming in for execution.
Weekly Chart: The Macro Consolidation
On the weekly timeframe, Bitcoin remains in a massive consolidation structure following its all-time high of $126,080 in October 2025. The current price of $63,006 represents a 50% retracement from the peak, sitting directly on the 50-week EMA. The weekly RSI is completely flat at 48, confirming that the macro trend is currently directionless, awaiting a macroeconomic catalyst.
Daily Chart: The Rising Wedge
While our July 13 Alpha Signal identified a localized Falling Wedge (which played out perfectly for a long entry at $62,274), the broader daily structure since the July 1 bottom resembles a Rising Wedge or Bear Flag. This is a bearish continuation pattern. If price breaks below the ascending trendline at $61,500, it validates the pattern and opens the door to $58,000.
4-Hour Chart: The Distribution Range
The 4-hour chart is characterized by intense chop. We see clear evidence of "liquidity grabs"—price spiking above $64,000 only to be instantly met with heavy selling volume, trapping breakout traders. This aligns perfectly with the whale deposit data from July 22 ($111.7M to Binance), where spikes in price were immediately faded by institutional supply.
8. Key Support & Resistance Levels
Navigating the current environment requires a strict adherence to key levels. Here is how the indicators align with our major price zones:
Level Type
Price Zone
Indicator Confluence
Significance
Major Resistance
$65,800 – $66,200
Upper Bollinger Band, 100-day EMA
Multi-month distribution block; highly unlikely to break without massive volume.
Local Resistance
$64,430 – $64,500
Recent Range High, 4H Overbought RSI
Where local liquidity grabs occur. Short-term scalps fail here.
Current Price
$63,006
20-day SMA, Neutral RSI (54)
The pivot point of the current Bollinger Band squeeze.
Local Support
$61,500 – $61,800
Rising Wedge Support line
First line of defense for bulls. Breaking this invalidates the July uptrend.
Major Support
$58,500 – $59,000
July 1 Capitulation Low, Lower BB
The "line in the sand." If lost, macro structure turns heavily bearish.
9. Probability-Weighted Scenarios for August 2026
Based on our multi-dimensional analysis, we have mapped out three probability-weighted scenarios for how Bitcoin will resolve its current setup.
Scenario 1: The Choppy Distribution Grind (Base Case — 45% Probability)
In our most likely scenario, Bitcoin fails to break the $64,500 resistance but avoids a total collapse. It grinds sideways in a volatile, choppy range between $60,500 and $64,000.
The Trigger: Continued flat MACD histogram and sustained whale deposits that absorb any retail buying pressure.
The Play: Range trading. Long the lower Bollinger Band, short the upper band. Avoid breakout trading entirely.
Invalidation: A daily close above $65,500 or below $59,000 with volume.
Scenario 2: The Bearish Breakdown (Bear Case — 35% Probability)
Given the massive $1.15 Billion in exchange deposits and the Wyckoff Upthrusts across altcoins, a severe breakdown is highly probable. The Bollinger squeeze resolves to the downside as smart money completes their distribution.
The Trigger: A 4-hour candle close below the rising wedge support at $61,500, accompanied by a bearish MACD cross on the daily.
The Play: Enter short on the retest of $61,500 from below, targeting the July lows of $58,700, with a runner targeting the mid-$50k region.
Invalidation: Price reclaims the 20-day SMA ($63,000) quickly after a fake-out drop.
Scenario 3: The Squeeze Breakout (Bull Case — 20% Probability)
Despite the on-chain overhang, if macro tailwinds emerge, the Bollinger squeeze could fire upward, squeezing late shorts.
The Trigger: A daily close above $64,500 with a violent expansion of the upper Bollinger Band and RSI pushing past 65.
The Play: Long the breakout confirmation, targeting the major resistance block at $66,000.
Invalidation: A failure to sustain momentum above $64,500, resulting in a daily wick (a "bull trap").
10. Common Indicator Traps to Avoid
In a highly manipulated and algorithmically driven market, classic indicators often produce false signals specifically designed to trap retail traders. Here are five traps to watch out for this month:
The RSI Oversold Trap: Just because the RSI hits 25 (as it did in early July) does not mean a V-shaped recovery is guaranteed. In strong downtrends, RSI can remain heavily oversold for weeks. Wait for bullish divergence before buying.
The MACD Zero-Line Fakeout: A MACD bullish cross below the zero line is much weaker than one above it. The early July cross was below zero, resulting in a grinding, weak recovery rather than an explosive rally.
The Bollinger Band "Walk": In a high-momentum trend, price will "walk" up or down the outer bands. Amateurs short the upper band assuming it's overbought, only to get liquidated as the band expands.
Volume-less Breakouts: A breakout of a pattern (like the wedge) without a corresponding spike in volume is highly suspect. If price pushes past $64,500 but volume remains below the 20-day average, it is likely a liquidity trap.
Ignoring Multi-Timeframe Context: Buying a 1-hour bullish MACD cross while the daily RSI is showing bearish divergence is a recipe for disaster. Always align your trades with the higher timeframe trend.
11. How to Use this Analysis with AI Bots
For automated traders utilizing platforms like CoinXSight, here is how you can translate this analysis into algorithmic logic for August.
Trend-Following Bots
Given our Base Case (Choppy Distribution) and Bear Case, purely directional trend-following bots on lower timeframes will likely get chopped to pieces (death by a thousand cuts).
Adjustment: If you run trend bots, increase your timeframe to the 4H or Daily. Widen your stop losses to avoid being wicked out by localized liquidity grabs, and reduce your position sizing by 30-50% until the Bollinger Squeeze resolves.
Grid & DCA Bots
A choppy, range-bound market is the ideal environment for Grid trading bots.
Configuration: Set a neutral grid bot with an upper limit of $64,500 and a lower limit of $60,500.
Logic: Let the bot harvest the micro-volatility as price ping-pongs between these levels. However, you MUST set a hard stop-loss below $58,500. If the bearish breakdown scenario triggers, a grid bot without a stop-loss will accumulate massive drawdown.
12. Risk Management Rules for August
We cannot stress enough that the current market structure is fragile. The divergence between positive price action and negative on-chain flows requires strict discipline.
[!IMPORTANT]
The Rule of Capital Preservation: In a distribution regime, preserving your capital for the eventual trend resolution is far more important than trying to catch every 2% swing.
Strict Stop Losses: If you are playing the long side, your absolute maximum pain threshold should be a daily close below $58,500.
Reduce Leverage: The impending Bollinger Squeeze means volatility is coming. High leverage in a low-volatility squeeze often results in liquidation via fake-out wicks before the real move begins. Keep leverage under 3x.
Take Profits Quickly: We are not in a "buy and hold" momentum phase. If you secure a 5-7% gain, scale out. The Wyckoff Upthrusts across the altcoin space suggest that rallies will be heavily sold into.
13. Conclusion & Looking Forward
July 2026 was a stark lesson in market deception. While the surface-level metrics showed a brave recovery from extreme fear and a 7.3% monthly gain (perfect for a crypto portfolio tracker overview), the underlying data—massive $1.15B exchange deposits, fading momentum indicators, and structural shifts in altcoin patterns—paints a picture of institutional distribution.
As the Bollinger Bands squeeze tighter, an explosive move is imminent. By relying on a confluence of RSI divergence, MACD exhaustion, and on-chain intelligence, traders can position themselves defensively.
We will continue to monitor the resolution of this squeeze. Be sure to check back for our mid-week updates, and keep a close eye on the $61,500 wedge support.
How to Track Bitcoin's Technical Setup on CoinXSight
Cross-reference all readings with the Confluence Score for a complete setup evaluation
💡 CoinXSight's Deep Alpha module computes RSI, MACD, and Bollinger Bands automatically across all timeframes. The Alpha Scanner generates signals like the July 13 Falling Wedge that combine pattern recognition with on-chain whale data.
Frequently Asked Questions (FAQ)
Q: What exactly does the $893.7M whale deposit to Binance signify?
A: Large exchange deposits typically signal intent to sell or collateralize short positions. While OTC deals happen, an $893.7M transfer during a market stall heavily suggests institutional de-risking and distribution.
Q: Why are altcoin signals important for Bitcoin's technical analysis?
A: Crypto markets are highly correlated. Simultaneous 'Wyckoff Upthrust SHORT' signals across altcoins indicate a macro shift from accumulation to distribution. Bitcoin rarely sustains uptrends if altcoin market structures break down.
Q: Can a Bollinger Band squeeze tell me which direction the price will go?
A: No. A squeeze only indicates low volatility is ending. The breakout direction must be confirmed by price action, trading volume, and momentum indicators like the RSI and MACD.
Q: What is "Hidden Bearish Divergence" on the RSI?
A: Hidden bearish divergence happens when price makes higher highs while RSI makes lower highs. It signals weakening underlying momentum despite upward price grinds, often preceding sharp trend reversals.
Q: If the Fear and Greed Index is climbing, isn't that bullish?
A: Not always. An FGI rising from 11 to 24 means less panic, but lingering in "Fear" while failing to break resistance indicates weak retail demand, leaving markets vulnerable to selling.
Disclaimer: This article is for educational and informational purposes
only and does not constitute financial, investment, or trading advice.
Cryptocurrency markets are highly volatile and involve substantial risk of
loss. Always conduct your own research (DYOR) and consult a licensed
financial advisor before making any investment decisions. Past performance
does not guarantee future results. CoinXSight provides analytical tools
and data — not investment recommendations. All price projections are speculative and based on technical analysis patterns. Actual results may differ significantly.
AT
Alex Thorne
MACRO // LEAD
Head of Macro & Market Structure·Global Macro Desk
Former institutional FX and macro derivative analyst. Specializes in global liquidity cycles, central bank balance sheets, and crypto market microstructure.
QUANTITATIVE SUITE // DEEP ALPHA ENGINEACTIVE
BTC/USDT // LIVE SCANNER
CONFLUENCE 28
LIVE SPOT PRICE$82,820.01NO_TRADE
TP2
$87,960.97
+7.17%
TP1
$84,431.71
+2.87%
ENTRY
$82,078.87
ZONE
SL
$80,902.44
-1.43%
Auto-detect Order Blocks, Fair Value Gaps and risk-adjusted DCA ladders in < 5s.