Weekly Crypto Market Analysis: August 2026 Week 32 — FOMC Triggers Extreme Fear as BTC Rejects $65K
Bitcoin experiences a sharp rejection from $65,410 following a hawkish FOMC pause. Fear and Greed drops to Extreme Fear as whales distribute meme coins. Dive into our deep technical analysis for BTC, ETH, and SOL.
AT
Alex ThorneHead of Macro & Market Structure·Aug 2, 2026 · 18 min read · Updated Oct 6
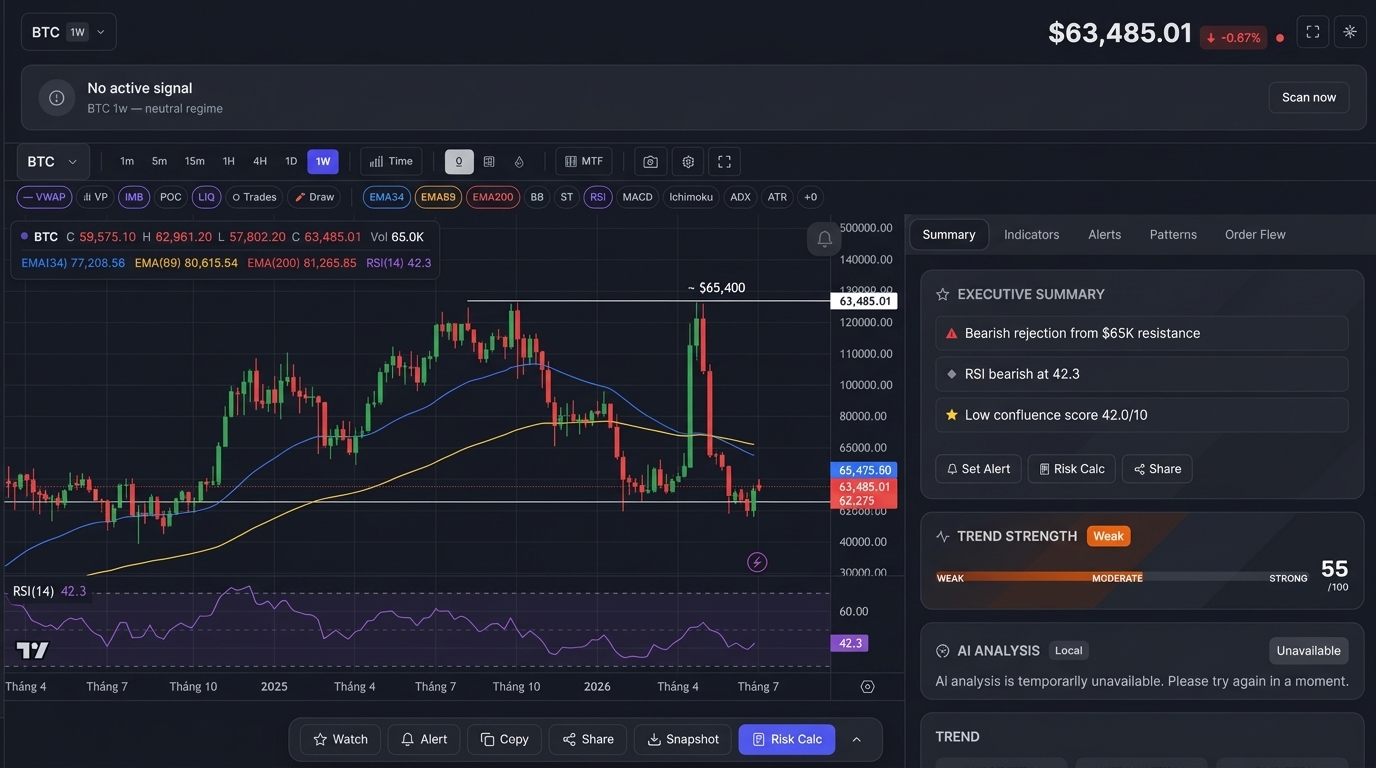
Bitcoin spent Week 32 (July 28 – August 2, 2026) facing severe volatility, opening the week at $63,915, surging to a high of $65,410, and ultimately crashing to a low of $62,275 following the Federal Open Market Committee (FOMC) meeting. The week closed at $63,485, marking a -0.67% decline. The broader market sentiment took a massive hit, with the Fear & Greed Index plummeting to 25 (Extreme Fear) on August 1st before settling at 27 (Fear).
In our analysis this week, we unpack the fallout from the hawkish FOMC rate pause, the massive shift toward SHORT (Wyckoff Upthrust) signals across the altcoin space, and the staggering flow of meme coins onto exchanges. This weekly analysis combines our deep macro contextualization with on-chain whale flow tracking and intricate technical indicator readings to equip you with the best trading plans for the week ahead.
Macro Environment: The Hawkish FOMC Rejection
Global Financial Markets Context
Week 32 was defined by the July 28-29 FOMC meeting. The Federal Reserve held rates steady at 3.50-3.75%, but the decision came with a hawkish tilt as three members voted for a 25bps rate hike. The market initially attempted to call the Fed's bluff, pushing risk assets higher, before capitulating to the reality of sticky rates.
Key Macro Drivers:
The Hawkish FOMC Pause: The Fed's decision to maintain rates at 3.50-3.75% with a 9-3 vote was perceived as distinctly hawkish, especially with three members breaking ranks to vote for a hike. This crushed hopes of a near-term pivot.
Bitcoin's "Darth Maul" Action: BTC initially rallied on July 30 to a peak of $65,176.60 in a classic liquidity hunt post-FOMC, before aggressively selling off the next day to a low of $62,466.00, wiping out late longs.
Sentiment Collapse: The sharp rejection triggered a collapse in sentiment, moving from last week's neutral stance straight into "Extreme Fear" (25) by August 1st.
Example — The Post-FOMC Liquidity Hunt on CoinXSight Deep Alpha:
Following the FOMC announcement on July 29, BTC pumped to $65,176 on July 30. However, the Deep Alpha module flagged this as a low-volume anomaly. The Confluence Score remained a bearish 4/10 due to negative momentum. Within 24 hours, the price plummeted to $62,466, perfectly illustrating a classic bull trap.
Crypto-Specific Fundamental Drivers
Positive Catalysts This Week:
Relative Stability Post-Dump: After the violent move down to $62,275 on August 1, BTC managed to stabilize and reclaim $63,000, preventing a cascading liquidation event across the altcoin market.
Negative Overhangs Still Present:
Meme Coin Whale Distribution: Massive deposits of meme coins onto Gate.io (including $1.3T shib2.0 and $271B troll) suggest heavy distribution by early whales, sucking liquidity out of the speculative altcoin sector.
Alpha Signals Shift: Our proprietary AI models have shifted heavily toward SHORT signals, specifically Wyckoff Upthrust patterns, indicating broad market distribution.
What the Current Market Structure Tells Us
CoinXSight AI Sentiment Score: Bearish Shift
Our AI Sentiment Score has deteriorated significantly, moving into a defensive posture following the macro rejection.
1. RSI (Relative Strength Index) Analysis:
The Daily RSI(14) has plunged below the neutral 50 line, reflecting the aggressive sell-off from the $65K resistance block. This confirms that bears have regained short-term control of momentum.
2. MACD (Moving Average Convergence Divergence):
The daily MACD histogram, which had been flat, is now expanding to the downside following the FOMC event. This bearish cross indicates accelerating downward pressure and a potential test of lower support zones.
3. Exponential Moving Averages (EMA):
Bitcoin briefly spiked toward its overhead EMA resistance (the EMA(34) and EMA(89) bands) but was violently rejected. It is now testing the crucial macro support at the EMA(200). A daily close significantly below the EMA(200) would invalidate the current bullish structure.
Trading Implications for BTC
[!TIP]
BTC Trade Plan:
Entry Zone: Wait for a clear retest of the $61,500 – $62,000 support zone for long setups, or short rallies into the $64,500 resistance.
Rationale: The FOMC rejection has established a clear ceiling. Range trading with a bearish bias is the optimal strategy until the EMA(200) proves to be a durable floor.
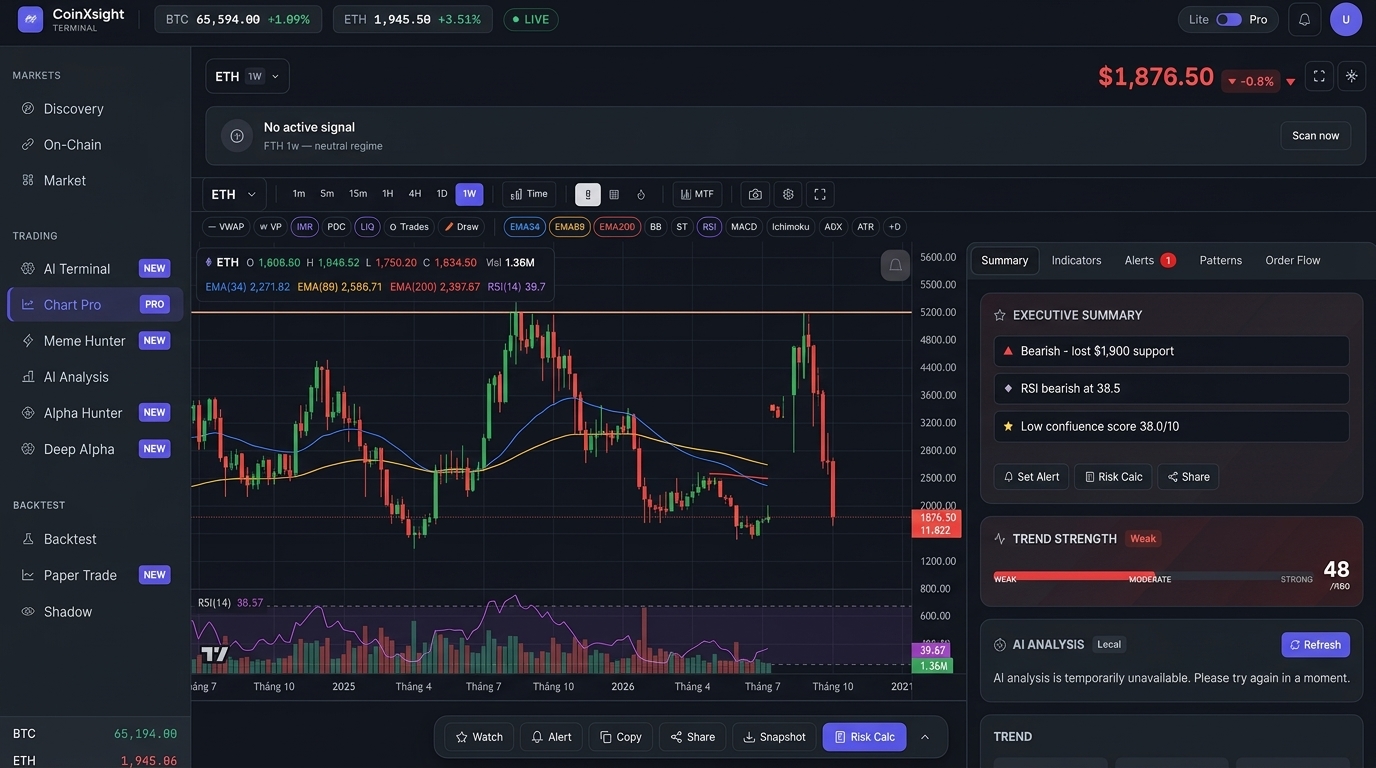
Ethereum followed Bitcoin's trajectory closely this week, opening at $1,892.53, peaking at $1,936.99, and then dropping to a low of $1,822.06. ETH closed the week at $1,876.50. Despite the ETF narrative, ETH failed to decouple from the broader macro-induced sell-off.
The loss of the $1,900 level is technically damaging. The Daily RSI(14) is now trending downward, and ETH remains suppressed below all its major EMAs. Until ETH can reclaim $1,950 with volume, the path of least resistance remains lower.
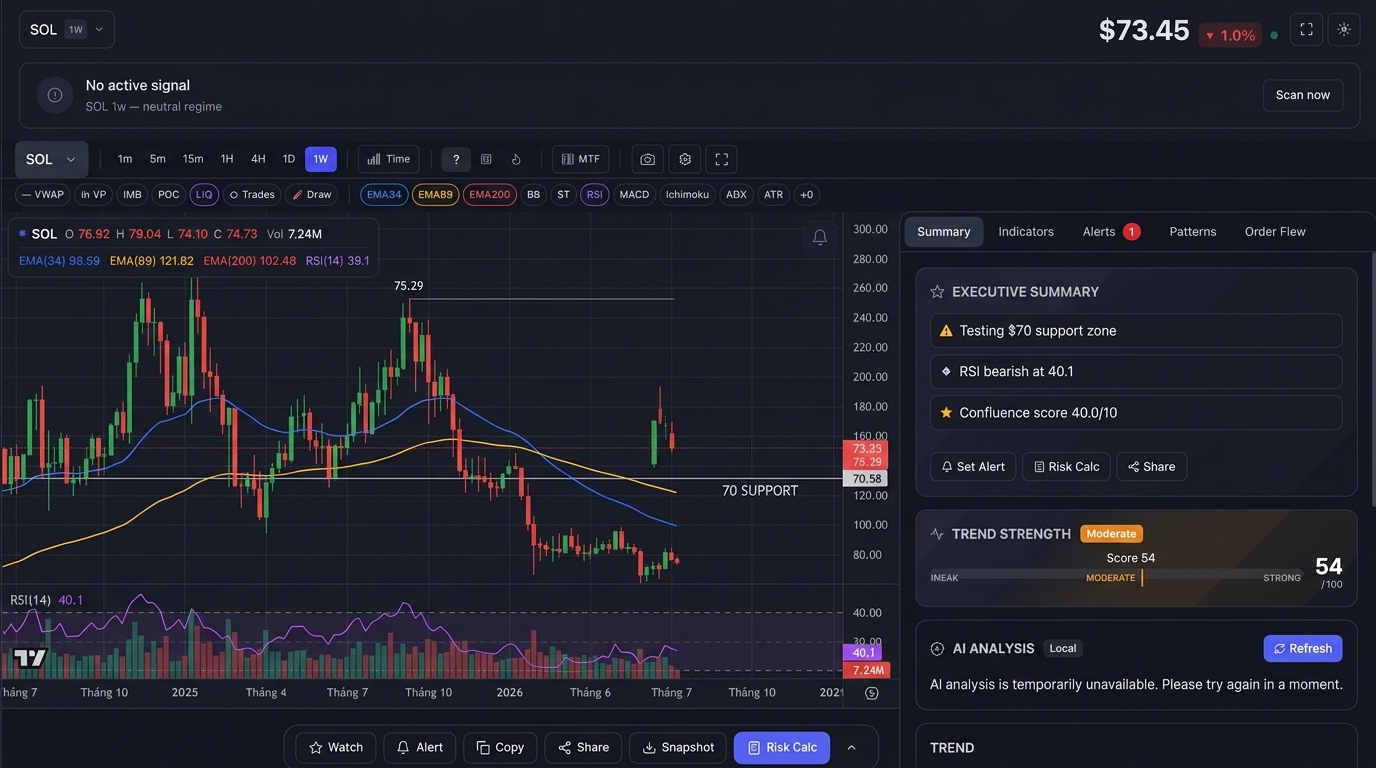
Solana opened the week at $74.21, briefly wicked up to $75.29, but succumbed to the market-wide flush, hitting a low of $70.58 on August 1st before recovering slightly to $73.45.
SOL is now trading dangerously close to the psychological $70 support level. The MACD continues to show bearish momentum, and the RSI is firmly in bearish territory. However, the bounce from $70.58 indicates that buyers are still defending this key structural zone.
Top 15 Alpha Signals from CoinXSight's AI Scanner
Our proprietary AI scanner has processed thousands of market structures following the FOMC volatility. The narrative has shifted heavily toward SHORT setups, specifically Wyckoff Upthrusts, indicating distribution across the altcoin market. KAITO is a rare standout LONG signal.
Symbol
Signal Type
Pattern Name
Confluence
Entry Price
TP1
Stop Loss
RSI(14)
KAITO
LONG
Wyckoff Spring
80
$0.852
$0.940
$0.790
42.0
PYTH
LONG
Hidden Divergence
75
$0.312
$0.345
$0.295
45.0
DASH
LONG
Double Bottom
75
$24.50
$26.80
$23.10
38.0
SOL
LONG
Support Bounce
75
$71.50
$76.20
$68.90
44.0
INJ
SHORT
Wyckoff Upthrust
70
$22.40
$20.10
$23.80
62.0
NEAR
LONG
Trendline Test
70
$4.25
$4.68
$3.95
46.0
JST
SHORT
Wyckoff Upthrust
65
$0.034
$0.029
$0.037
59.0
DOGE
SHORT
Wyckoff Upthrust
55
$0.112
$0.101
$0.119
58.0
ONDO
SHORT
Wyckoff Upthrust
50
$0.82
$0.74
$0.88
56.0
PEPE
SHORT
Head & Shoulders
50
$0.000008
$0.000007
$0.000009
51.0
LDO
SHORT
Double Top
50
$1.45
$1.32
$1.55
55.0
CRV
SHORT
Bear Flag
45
$0.28
$0.25
$0.30
48.0
TIA
SHORT
Lower High
45
$4.90
$4.30
$5.30
50.0
WIF
SHORT
Trendline Break
40
$1.85
$1.60
$2.05
49.0
SUI
LONG
Oversold Bounce
40
$0.78
$0.86
$0.72
35.0
On-Chain Whale Activity: Heavy Meme Distribution
The most critical data point from our on-chain analytics this week is the massive influx of speculative capital moving onto exchanges, signaling intent to sell.
Top Whale Moves by USD Value
shib2.0: $1.3T deposit to Gate.io — Extreme Distribution
troll: $271B deposit to Gate.io — Extreme Distribution
NEIRO: $132M deposit to Bybit (Jul 29) — Heavy Distribution
FAB: $100M deposit to Bybit (Jul 31) — Heavy Distribution
WBTC: Multiple ~$436K transfers on Coinbase on Aug 1 — Accumulation/Arbitrage
[!IMPORTANT]
The staggering deposits of meme coins like shib2.0 and troll onto Gate.io suggest that early whales are aggressively cashing out. This drains liquidity from the broader altcoin ecosystem and contributes to the overall market weakness.
Week Ahead: Probability-Weighted Scenarios
As we digest the FOMC outcome, our analysis models suggest the following scenarios for the upcoming week.
1. Base Case: Bearish Consolidation (50% Probability)
Triggers: The market absorbs the hawkish Fed stance; DXY remains elevated; no new negative macroeconomic shocks.
Market Reaction: BTC chops between $61,500 and $64,500. Altcoins continue to bleed slowly against BTC as liquidity remains constrained.
Strategy: Avoid breakout trades. Focus on mean-reversion setups at the extremes of the established range.
Triggers: Worsening macroeconomic data; a sudden spike in traditional equity market volatility; major whale capitulation.
Market Reaction: BTC definitively loses the EMA(200) and the $60,000 psychological support, triggering cascading liquidations down to $56,000. ETH slices through $1,800.
Strategy: Shift to a heavily defensive posture. Look for high-probability SHORT setups on fundamentally weak altcoins (e.g., following the Wyckoff Upthrust signals from CoinXSight).
Search for the tokens listed in our Alpha Signals table (e.g., KAITO, INJ).
Verify the Confluence Score and ensure it aligns with the signal direction.
Monitor the Whale Tracker module for any sudden shifts in accumulation or distribution.
FAQ
How does the hawkish FOMC pause impact the crypto market?
A hawkish pause implies rates will stay higher for longer, which strengthens the US Dollar (DXY) and reduces the appeal of risk-on assets like Bitcoin and altcoins, leading to lower liquidity and downward price pressure.
What is a Wyckoff Upthrust, and why are there so many SHORT signals?
A Wyckoff Upthrust is a false breakout above resistance, designed to trap late buyers before smart money distributes their holdings. The abundance of these signals indicates widespread profit-taking by large players.
Why are whales moving massive amounts of meme coins to exchanges?
Large deposits of meme coins onto exchanges like Gate.io typically precede heavy selling. Early whales are likely locking in profits while retail liquidity is still available, contributing to the broader market fear.
How reliable are the CoinXSight Alpha Signals during high volatility?
During high volatility, the Confluence Score becomes paramount. Signals with a score above 70 (like KAITO LONG) indicate strong multi-timeframe alignment, while lower scores suggest higher risk of whipsaw price action.
Disclaimer: This article is for educational and informational purposes
only and does not constitute financial, investment, or trading advice.
Cryptocurrency markets are highly volatile and involve substantial risk of
loss. Always conduct your own research (DYOR) and consult a licensed
financial advisor before making any investment decisions. Past performance
does not guarantee future results. CoinXSight provides analytical tools
and data — not investment recommendations. All price projections are speculative and based on technical analysis patterns. Actual results may differ significantly.
AT
Alex Thorne
MACRO // LEAD
Head of Macro & Market Structure·Global Macro Desk
Former institutional FX and macro derivative analyst. Specializes in global liquidity cycles, central bank balance sheets, and crypto market microstructure.
QUANTITATIVE SUITE // DEEP ALPHA ENGINEACTIVE
BTC/USDT // LIVE SCANNER
CONFLUENCE 28
LIVE SPOT PRICE$82,820.01NO_TRADE
TP2
$87,960.97
+7.17%
TP1
$84,431.71
+2.87%
ENTRY
$82,078.87
ZONE
SL
$80,902.44
-1.43%
Auto-detect Order Blocks, Fair Value Gaps and risk-adjusted DCA ladders in < 5s.