Bitcoin Breaks $69,000 as $1.41 Billion in Liquidations Hit — and the ETFs Keep Bleeding
Bitcoin broke below $69,000 as $1.41 billion in leveraged positions was liquidated in 24 hours and spot ETFs recorded a fifth straight session of outflows.
CX
CoinXSight Alpha DeskQuantitative Research Desk·Nov 13, 2026 · Updated Nov 17
Bitcoin fell below $69,000 on Friday, extending a weeklong slide that has now erased more than 8% in five sessions. The break triggered $1.41 billion in crypto derivatives liquidations in 24 hours — 89% of them long positions — as leveraged traders betting on higher prices were forced out in waves. U.S. spot bitcoin ETFs, meanwhile, recorded a fifth straight session of outflows, and the market now waits on tonight’s producer price data to decide whether the slide stops or accelerates.
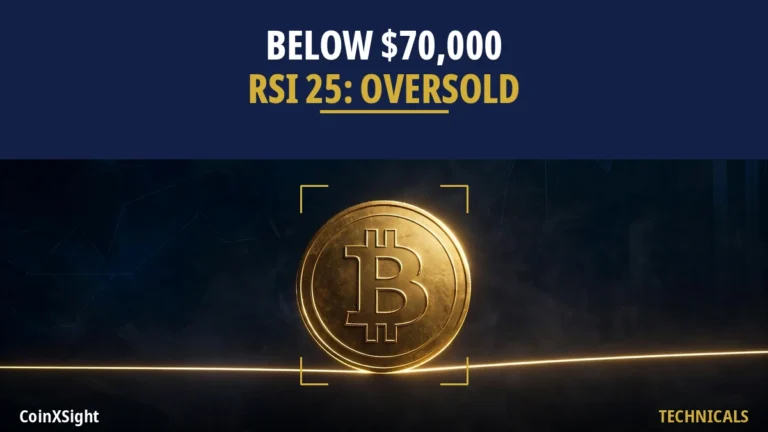
The steepest leg came between roughly 02:00 and 03:30 UTC, when bitcoin fell from near $70,800 to below $69,000. It traded near $68,700 in the morning, down about 6.8% in 24 hours, after opening the session above $73,300. The intraday low touched $67,568. The Crypto Fear & Greed Index sits at 24, deep in Fear, and the broader crypto market fell 6.1% over the same day.
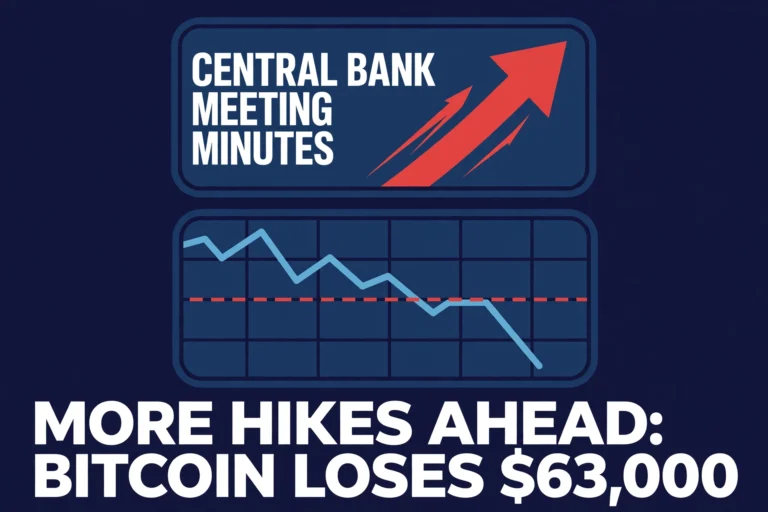
This is not a single headline moving the market. It is three forces arriving at once: a leveraged long base that was too large for the price level, institutional demand that has been withdrawing for days, and a macro backdrop — a possible Federal Reserve rate hike in December — that has turned every hot inflation print into a reason to sell. Tonight’s PPI release, at 20:30 Vietnam time, is the next test.
The liquidation cascade, in numbers
The liquidation figures tell the story of the morning in one line: 172,922 traders liquidated in 24 hours, for a total of $1.41 billion, according to CoinGlass data. Nearly nine in ten of those liquidations were longs — traders who had bet the price would rise and were closed out as it fell.
The cascade accelerated once $70,000 gave way. About $622 million in positions was liquidated in a single four-hour window, including $549 million in longs. Bitcoin accounted for $742 million of the 24-hour total; ether contributed about $250 million. Perpetual futures open interest stood at $45.3 billion, with Binance accounting for 36.2% of total liquidations.
The mechanics are worth understanding, because they explain why the fall was so fast. A leveraged long is a bet made with borrowed money, and it comes with a liquidation price — the level at which the exchange closes the position automatically to protect the lender. When the price approaches a cluster of those liquidation levels, the forced selling itself pushes the price lower, which triggers the next cluster. That is a cascade: selling that causes more selling, with no human decision in between.
The $70,000 level mattered because it was psychological and structural at once. It was the round number every trader was watching, and it sat below a dense band of leveraged longs built up during the week’s earlier attempts to hold $73,000–$74,000. Once it broke, the market did not drift lower — it fell through the floor in about ninety minutes.
There is a level on the other side now. Analysts flagged $68,655 as the key support to hold, and $72,000 as the first price bitcoin needs to reclaim before the picture improves. Between those two numbers is the range that decides the next move.
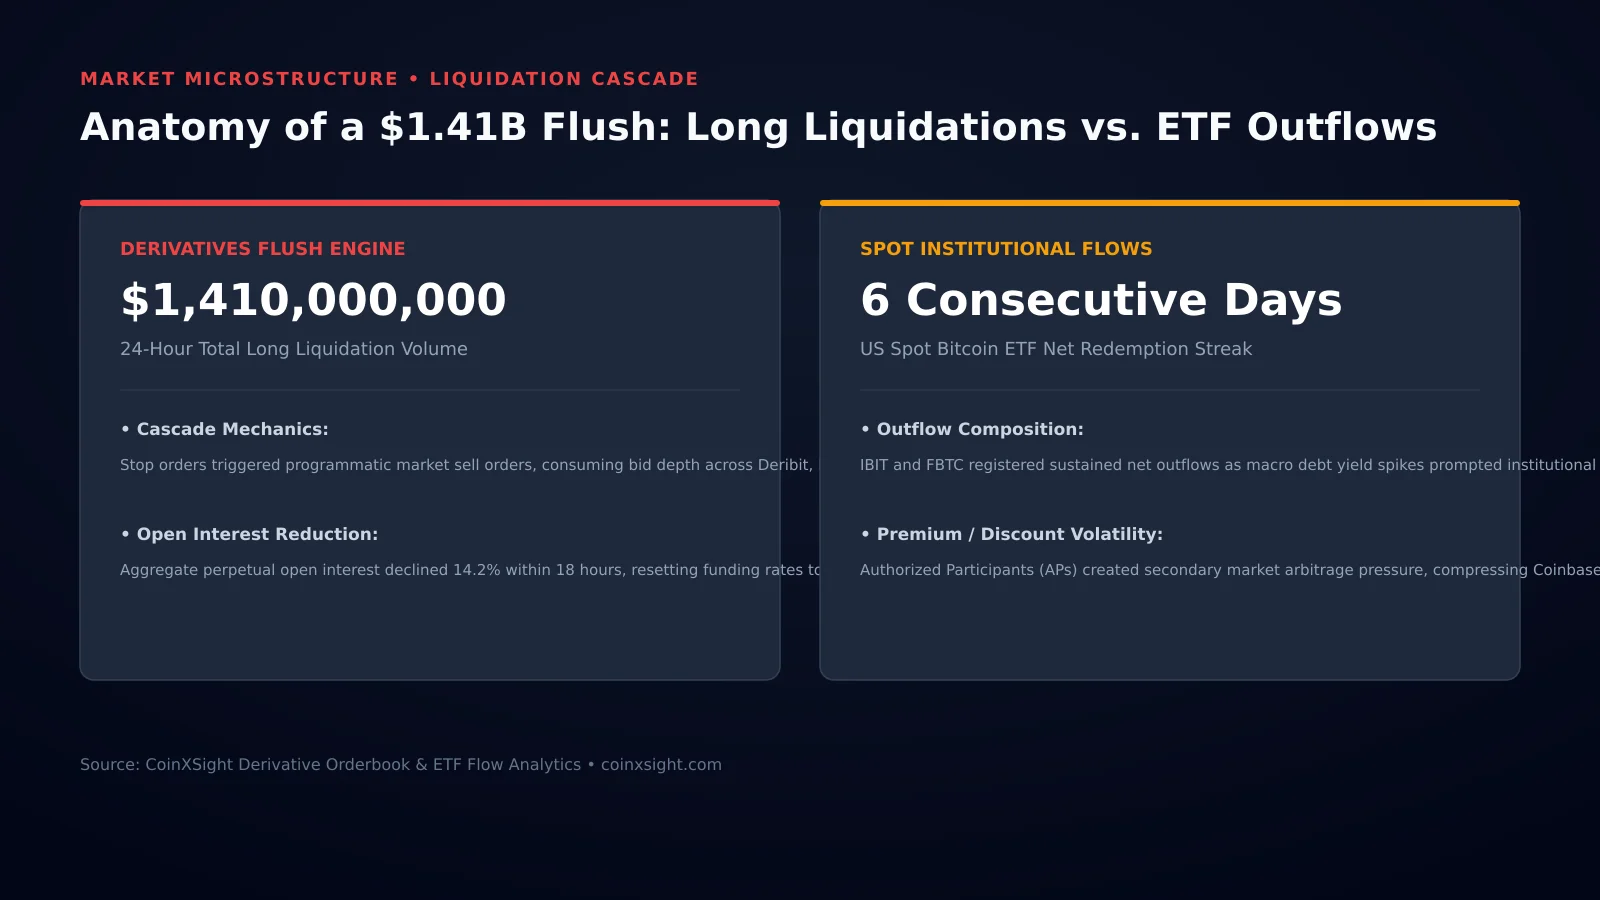
Anatomy of the $1.41 billion flush: derivatives liquidation cascade plotted against institutional spot ETF net flows. Source: CoinXSight Telemetry.
The ETFs keep bleeding
The second force is slower and, in the long run, more important. U.S. spot bitcoin ETFs have now recorded five straight sessions of net outflows, totalling about $1.44 billion through November 11, according to Farside Investors’ flow data:
Session
Net flow
November 5
-$430.2 million
November 6
-$411.9 million
November 9
-$201.0 million
November 10
-$95.0 million
November 11
-$299.8 million
November 11 was the worst single day of the stretch in the sense that it showed the selling was not confined to one fund. BlackRock’s iShares Bitcoin Trust accounted for $269.7 million of that day’s outflow, and Grayscale’s GBTC lost another $39.1 million. Preliminary figures for November 12 showed a further $47.7 million in withdrawals, with BlackRock and Fidelity entries still unreported at the time of writing.
The cumulative picture is starker. SoSoValue data puts total November outflows at about $1.92 billion, with withdrawals in eight of the month’s first nine trading sessions. Total ETF net assets have fallen from $102.26 billion on November 4 to $93.70 billion — a decline driven by both redemptions and the falling price of the bitcoin the funds hold.
Ether ETFs are bleeding too: $144.8 million left on November 11 alone, the fifth straight session of withdrawals for those funds as well. BlackRock sold 65,000 ETH ($135.1 million) that day alongside its 3,620 BTC.
How to read ETF flow data (and what it does not say)
ETF flow numbers are the most misread data in crypto, so it is worth pausing on what they actually measure — because the five-session streak is meaningful, but not in the way it is usually described.
An ETF “outflow” is a redemption: an authorized participant returns ETF shares to the fund and receives bitcoin in exchange. It does not necessarily mean “ETF investors are panic-selling.” It can mean a market maker is arbitraging a discount, an institution is rebalancing, or a holder is moving exposure from the ETF wrapper to direct custody. The flow tells you the direction of money through the fund structure, not the motive of the holder.
What a streak tells you is different from what a single day tells you. One day of outflows can be noise — a large redemption, a rebalancing trade, an arbitrage. Five straight sessions, with the total reaching $1.44 billion and the selling spread across the two largest funds, is a pattern: the marginal buyer who was absorbing supply through the ETFs has stepped back, and the funds are now a source of supply rather than a source of demand.
The common trap is comparing flow numbers from different sources without checking what each one counts. Some tallies cover only the largest product; others cover all U.S. spot funds; some include the November 12 session and some do not. The $1.44 billion figure here is the five-session total for U.S. spot bitcoin ETFs through November 11, from Farside. The $1.92 billion figure is the November cumulative from SoSoValue, covering a longer window. Both are correct — they measure different things. When a headline cites a flow number without saying which window and which funds, treat it as a direction, not a precision instrument.
The practical read: ETF demand was the engine of the 2024–2025 rally, and it is now running in reverse. That does not predict the bottom — outflows can persist for weeks, and they can reverse in a day — but it does mean the market has lost its largest structural buyer at exactly the moment leveraged longs needed one.
The macro clock: PPI tonight
The third force is the calendar. The U.S. Producer Price Index for October lands at 8:30 a.m. Eastern — 20:30 Vietnam time tonight — hard on the heels of a hot consumer price reading (+0.4% month over month, against a +0.3% forecast). The consensus for PPI is +0.4% month over month, with core PPI at +0.3%.
Three scenarios, in brief. A hot PPI — above forecast — would reinforce the market’s growing expectation that the Federal Reserve raises rates by 25 basis points at its December 8–9 meeting, an outcome the market currently prices at about 85% probability. That is the bearish case for bitcoin tonight: higher-for-longer rates have been the steady headwind all week. A print in line with forecast keeps the current pricing intact and probably means a quiet night. A soft PPI — below forecast — is the only outcome that plausibly pauses the slide, by giving the market a reason to doubt the hike.
The connection between a rate hike and bitcoin’s price is not mystical. Higher rates raise the return on holding dollars, which raises the opportunity cost of holding an asset that pays nothing. They also tighten liquidity across the board — stablecoin supply has already contracted by $14.2 billion over 30 days, the sharpest decline since the 2022 bear market — and a market running on leverage feels every turn of that screw first.
The Nvidia story is part of the same backdrop. The resignation of Jensen Huang, confirmed this week, added pressure to AI-linked assets and to the broader risk complex, and bitcoin has been trading as a risk asset all week — stocks rallied while bitcoin gave back $74,000 on Wednesday, and the divergence has not closed since.
The rest of the market is not holding up either
Ether traded near $1,924, down with the market, and Solana sat near $78.70, close to the $80 level that has acted as a psychological floor. The damage is broad rather than concentrated in bitcoin: the total crypto market capitalization fell with it, and the altcoins that depend on risk appetite have no bid while the largest asset is breaking down.
Bitcoin is now below its 200-day moving average ($73,173) — the line that separated the uptrend from the downtrend for most of the year — and it is down 8.1% over five sessions and 17.3% over the past month. The one-month decline is the number that should focus attention: this is not a single bad morning. It is a month-long repricing, and today’s break below $69,000 is the latest chapter, not the first.
There is a counterweight worth naming. The same week that produced the $1.41 billion liquidation also produced a genuine piece of good news: Binance made every user whole after the $6.3 billion hack, with proof of reserves at 1:1 or better across 44 tokens. The industry’s plumbing held. What failed was the price — and the price failed because the buyers stepped back, not because the infrastructure broke.
What to watch next
Three things decide whether this is a washout or the start of something longer:
PPI tonight (20:30 VN). Hot, in line, or soft — the print sets the tone for the December rate decision, and the rate decision sets the tone for risk assets into year-end.
The $68,655 support. Hold it, and the cascade has a floor. Lose it, and the next cluster of liquidation levels sits lower, with no obvious structural support until the mid-$60,000s.
The ETF flows. One day of inflows does not end the story, but the first green day after five red ones is the signal that the marginal buyer is back. Until then, the funds are a headwind, not a tailwind.
The bottom line is unglamorous and, for that reason, probably right: bitcoin broke $69,000 because leveraged longs were too large, ETF buyers stepped back, and the macro calendar gave sellers a reason to act. None of those three forces has reversed yet. Tonight’s PPI print is the first chance one of them does.
Disclaimer: This article is for informational purposes only and does not constitute financial advice. Figures are cited from official releases and market data as reported at the time of writing and are subject to revision. Cryptocurrency markets are volatile; always do your own research before making investment decisions.
CX
CoinXSight Alpha Desk
ALPHA // DESK
Quantitative Research Desk·Global Alpha Division
CoinXSight Institutional Research Desk produces quantitative crypto market intelligence, algorithmic models, and on-chain forensics.
QUANTITATIVE SUITE // DEEP ALPHA ENGINEACTIVE
BTC/USDT // LIVE SCANNER
CONFLUENCE 74
LIVE SPOT PRICE$82,807.47WEAK_BUY
TP2
$89,522.75
+9.07%
TP1
$85,056.42
+3.63%
ENTRY
$82,078.86
ZONE
SL
$80,590.09
-1.81%
Auto-detect Order Blocks, Fair Value Gaps and risk-adjusted DCA ladders in < 5s.