The crypto market opens Week 21 under significant bearish pressure, with total market capitalization at $2.65 trillion — a modest +0.05% change over the past 24 hours but masking a deeper weekly drawdown. Bitcoin dominance remains elevated at 58.28%, signaling continued flight to safety within crypto, while the overall Fear & Greed Index sits at 27 (Fear).
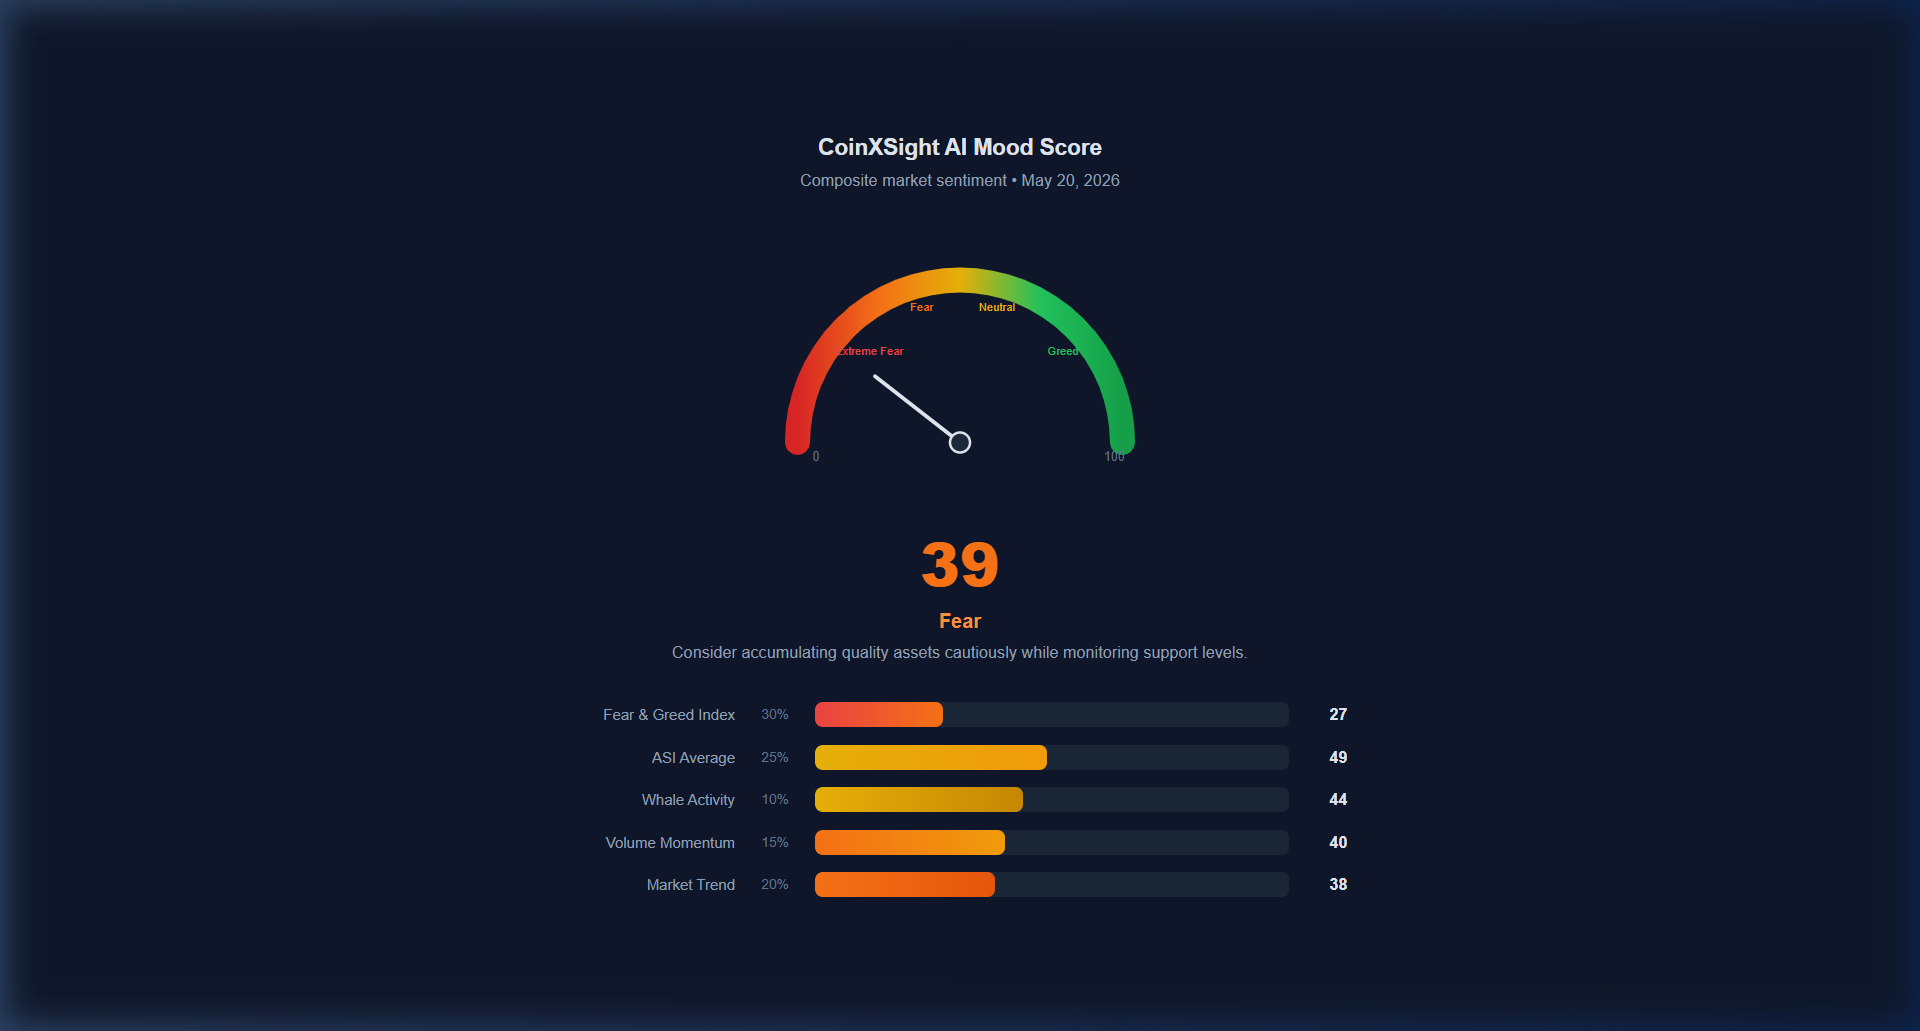
CoinXSight's proprietary AI Mood Score registers 39/100 (Fear) — combining Fear & Greed (27), ASI Average (49), Market Trend (38), Volume Momentum (40), and Whale Activity (44) into a single composite reading that confirms cautious sentiment across all dimensions.
Metric
Value
Signal
Total Market Cap
$2.651T
Flat 24h, -5% weekly
24h Trading Volume
$71.69B
Below-average activity
BTC Dominance
58.28%
Risk-off flight to BTC
ETH Dominance
9.67%
Declining, underperforming
Fear & Greed Index
27
Fear zone
AI Mood Score
39
Fear — cautious accumulation
Active Cryptocurrencies
17,412
Market breadth stable
Macro Context: What's Moving the Market
Geopolitical Headwinds
The dominant macro narrative this week centers on escalating Middle East tensions involving the U.S. and Israel's confrontation with Iran. The blocking of the Strait of Hormuz has disrupted global energy shipments, pushing oil prices toward $100/barrel — a critical inflationary catalyst that reverberates through all risk assets, crypto included.
The United Nations has downgraded its 2026 global growth forecast to 2.5% (from 2.7% in January), with developing economies facing inflation acceleration from 4.2% to 5.2%. In an adverse scenario, growth could fall as low as 2.1% — one of the weakest rates this century outside of pandemic and financial crisis periods.
Federal Reserve Uncertainty
The federal funds rate remains at 3.50% – 3.75%, but the market narrative has shifted decisively from "when will the Fed cut?" to "will the Fed hike again?" Following hot inflation prints and energy-driven price pressures, bond markets are pricing in approximately 64.6% probability that the Fed holds rates steady, with growing speculation about a quarter-point hike under new Chair Kevin Warsh.
For crypto, this translates to sustained pressure on risk appetite. Higher-for-longer rates reduce the relative attractiveness of non-yielding assets like Bitcoin, while increasing the opportunity cost of speculative altcoin positioning.
US-China Trade Détente
On a more constructive note, President Trump's mid-May state visit to China produced an agreement to reduce tariffs on goods valued at $30 billion+ on each side, alongside the establishment of a new Trade Council to manage ongoing friction. While structural tensions remain (technology export controls, supply chain competition), this represents a marginal positive that could support risk sentiment if the ceasefire holds.
Bitcoin (BTC) — $77,200
Price Action Summary
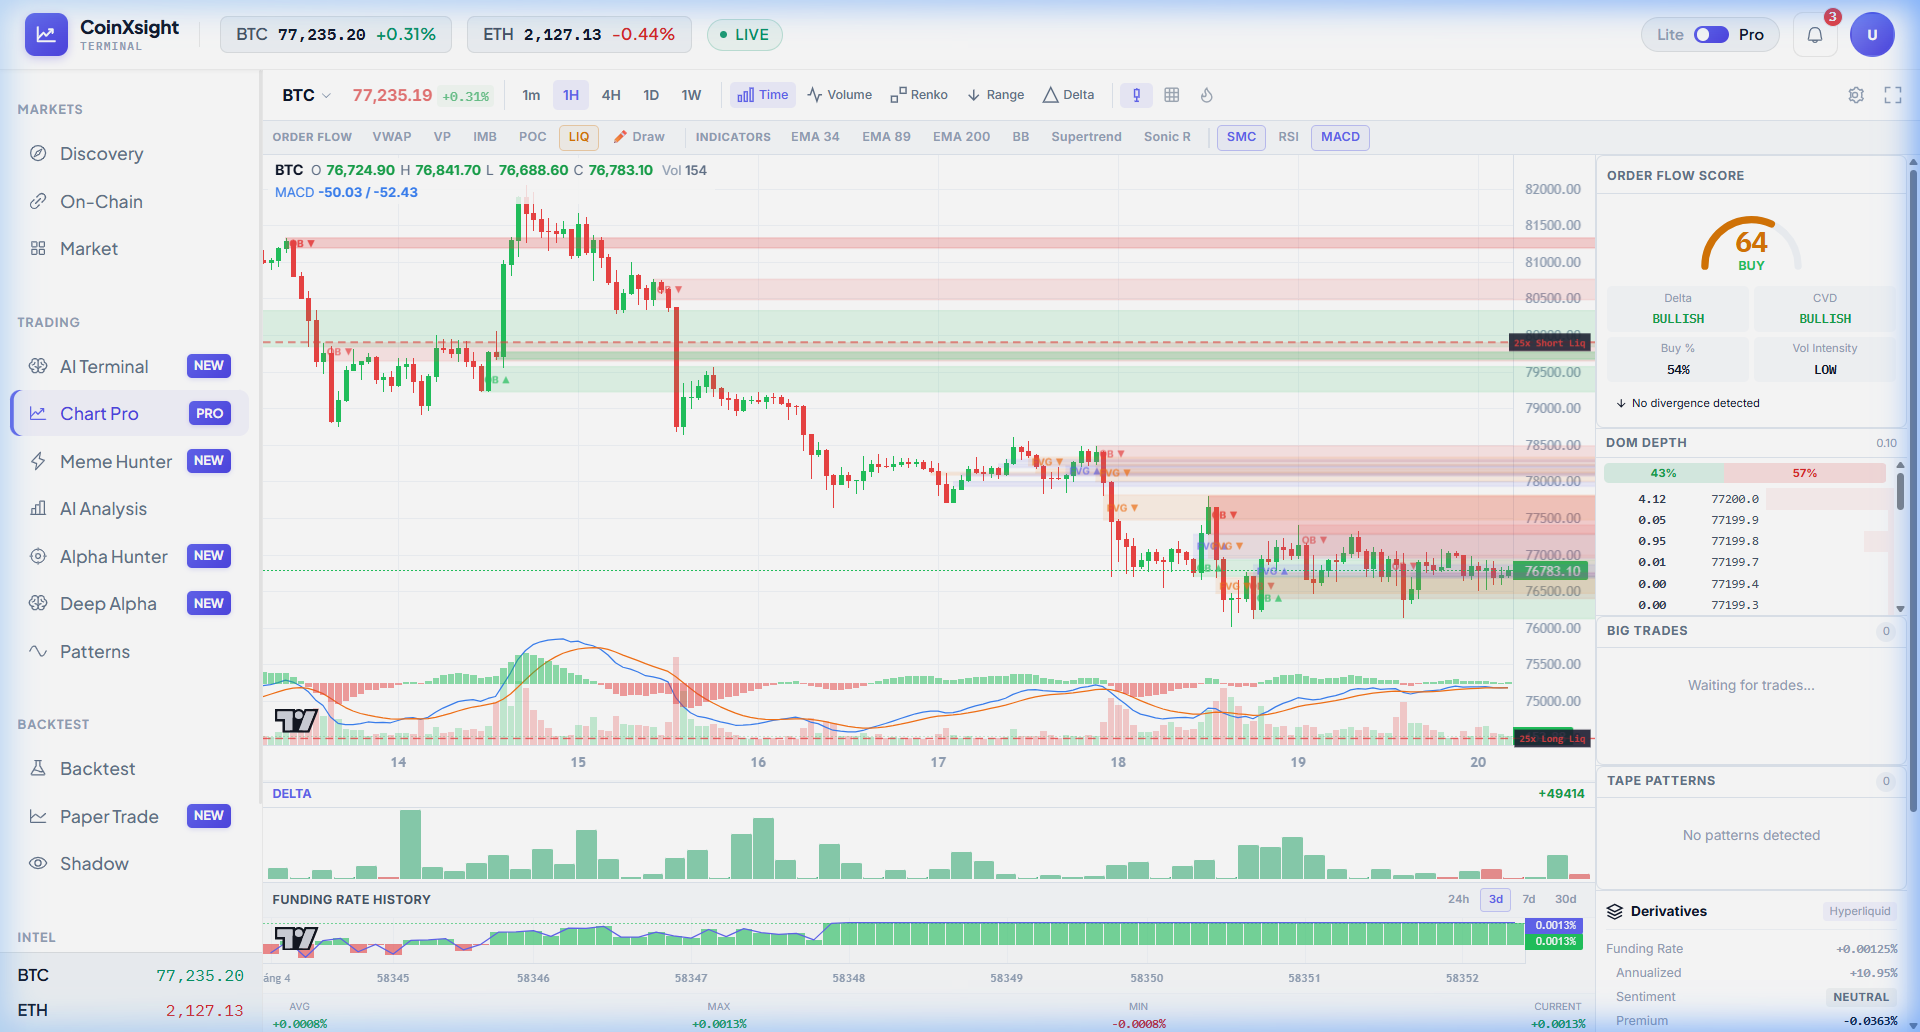
Bitcoin is trading at $77,200, posting a marginal +0.33% on the day but nursing a -5.07% weekly loss. The asset has been rejected from the $80,000 psychological resistance and is now consolidating in a narrowing range between $76,000 and $77,450.
CoinXSight Deep Alpha Intelligence
Our Deep Alpha engine reports a Bullish Lean for BTC, though with critical caveats:
Dimension
Score
Reading
Trend
70/100
Established trend
Momentum
17/100
⚠️ Weak — move lacks conviction
Volume
25/100
⚠️ Low — quiet market
Fear
63.9/100
Elevated — cautious sentiment
Distribution
71.4/100
Moderate distribution present
Accumulation
28.6/100
Distribution outweighing
Volatility
55/100
Normal range
Key Insight: The trend remains structurally bullish (70/100), but momentum is critically weak at 17/100 — the lowest dimension reading. Volume at 25/100 confirms that the market lacks conviction. The Deep Alpha verdict: "No consensus — wait for clearer signals." Trade readiness score: 100/100 (paradoxically high due to clear NO_TRADE signal).
Technical Levels
Level
Price Zone
Significance
Resistance 1
$77,200 – $77,450
Immediate overhead; bearish trend line
Resistance 2
$79,000 – $80,000
Psychological barrier — must clear for reversal
Support 1
$76,000 – $76,400
Immediate floor; stabilization critical
Support 2
$74,000 – $75,000
Major downside barrier; breakdown target
BTC Verdict
NEUTRAL-CAUTIOUS. The bullish trend structure is intact but under siege from weak momentum and low volume. The current reading suggests a distribution phase (71.4 distribution vs. 28.6 accumulation). We advise waiting for either:
A decisive close above $79,000 with volume confirmation, OR
A flush to $74,000–$75,000 support for a higher-risk accumulation entry.
Ethereum (ETH) — $2,126
Price Action Summary
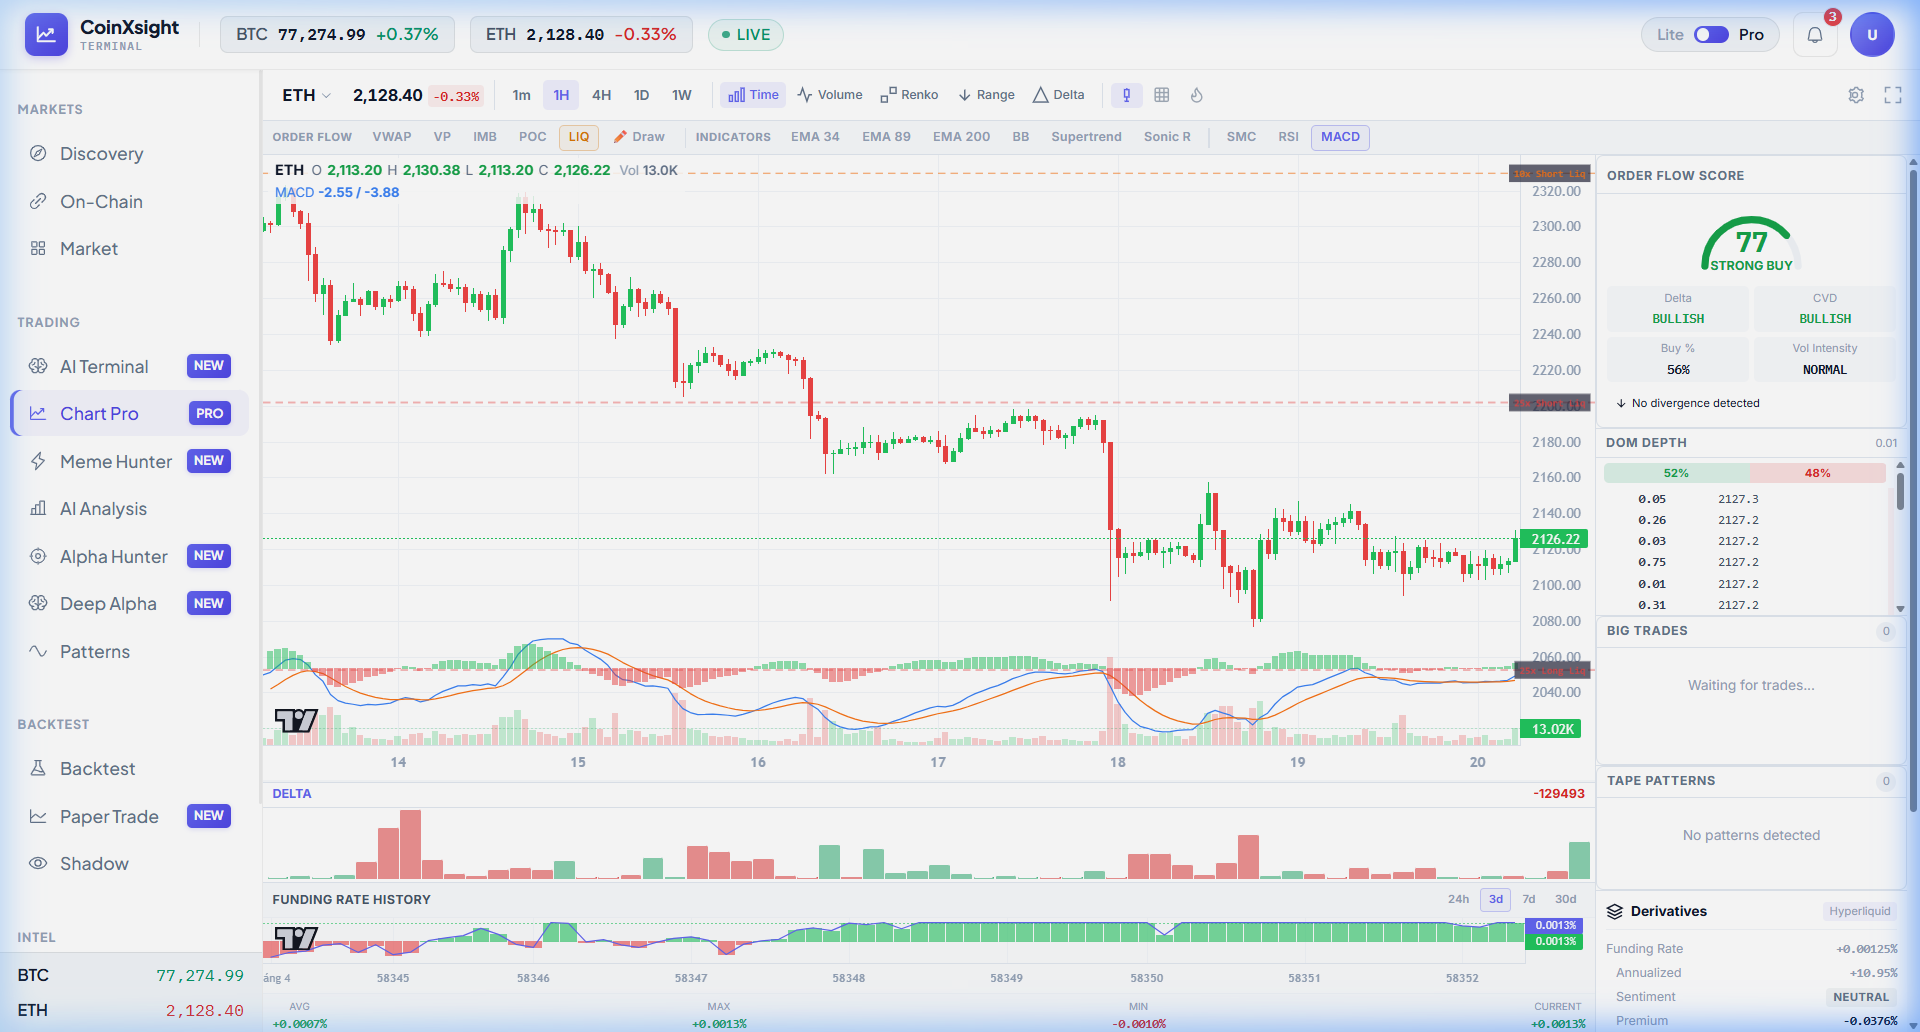
Ethereum trades at $2,126, down -0.47% on the day and carrying a significant -7.91% weekly drawdown. ETH dominance has slipped to 9.67% — a multi-month low that reflects capital rotation away from the Ethereum ecosystem toward Bitcoin and stablecoins.
CoinXSight Deep Alpha Intelligence
The Deep Alpha engine delivers a more nuanced reading for ETH — a Strong Bullish Setup on the Mood Map despite the bearish price action:
Dimension
Score
Reading
Trend
95/100
🔥 Very strong trend
Momentum
70/100
Good — move has strength
Volume
25/100
⚠️ Low — quiet market
Fear
70.6/100
Elevated fear
Distribution
71.4/100
Moderate distribution
Volatility
70/100
⚠️ Elevated
Correlation
65/100
Moderate BTC correlation
Key Insight: ETH shows a 95/100 trend score — the highest of any asset this week. Combined with solid 70/100 momentum, the technical picture is paradoxically strong despite bearish price action. The Deep Alpha engine notes: "Trend is very strong. Multiple indicators confirm the bearish direction." This means the downtrend is well-established, and countertrend longs carry elevated risk.
The bullish count (6) significantly outweighs the bearish count (3), but the primary trade signal remains NO_TRADE due to contradicting signals between trend direction (bearish) and momentum dimensions (bullish).
Recent Alpha Signal Performance
CoinXSight's Alpha Hunter pipeline generated a successful ETH LONG signal on May 18 at $2,104.30, which hit TP1 at $2,136 for a +1.51% gain. The signal used a Wyckoff Spring + No Supply pattern — demonstrating that short-term reversals are tradeable within the broader downtrend.
ETH Verdict
BEARISH WITH OPPORTUNITY. The strong downtrend (95/100) combined with elevated volatility (70/100) creates a dangerous environment for directional bets. However, the successful Wyckoff reversal signals suggest that swing traders can find profitable setups within the trend. Wait for volume confirmation above 50/100 before committing to any medium-term position.
Solana (SOL) — $84.80
Price Action Summary
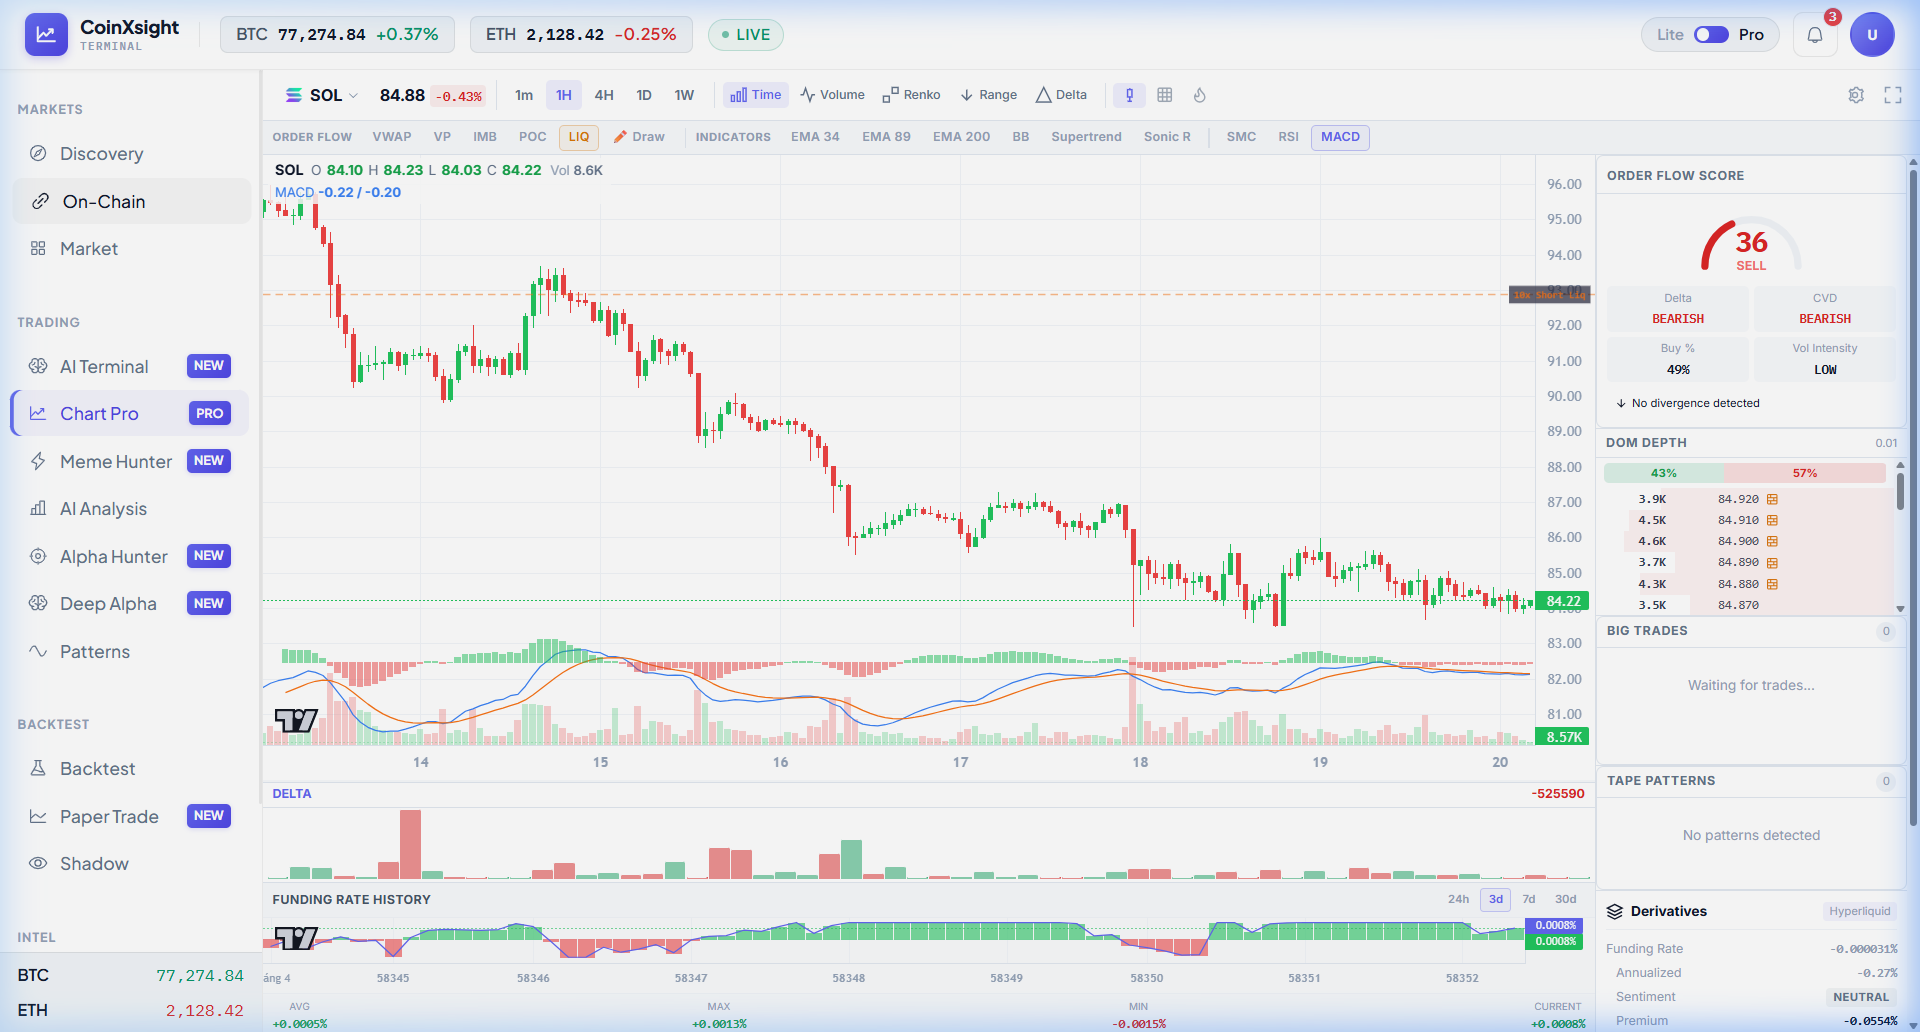
Solana has been the hardest-hit major asset this week, trading at $84.80 with a -11.30% weekly decline — the steepest drawdown among top-10 assets by market cap ($48.92B). The 24h volume of $1.94B reflects diminished trader interest.
CoinXSight Deep Alpha Intelligence
SOL's Mood Map shows a Bullish Lean driven by exceptional momentum:
Dimension
Score
Reading
Momentum
91/100
🔥 Exceptional — strong directional push
Trend
60/100
Established (bearish) trend
Fear
60.5/100
Elevated fear
Accumulation
50/100
Neutral
Distribution
50/100
Limited
Volatility
70/100
Elevated
Key Insight: SOL's 91/100 momentum is the highest reading across BTC, ETH, and SOL this week — but it's aligned with the bearish direction. The Deep Alpha engine notes: "Momentum is strongly bearish. RSI and MACD confirm direction." The balanced accumulation/distribution ratio (50/50) suggests neither whales nor retail are aggressively positioned yet.
SOL Verdict
BEARISH — WAIT FOR BOTTOM. Despite exceptional momentum scores, the direction is firmly bearish. The 50/50 accumulation/distribution split suggests we haven't seen capitulation yet. Key levels to watch: $80 psychological support and $75 as a potential accumulation zone. SOL historically shows the sharpest V-recoveries, so when the bottom is confirmed, the entry could be lucrative.
Alpha Hunter Pipeline Highlights
CoinXSight's Alpha Hunter has been actively generating signals across the market. Here are the most notable setups from the past 48 hours:
Asset
Pattern
Direction
Entry
TP1
Confluence
Status
LINK
Wyckoff Spring + No Supply
LONG
$9.47
$9.61
60
✅ Active
TON
Double Bottom
LONG
$1.979
$2.42
50
✅ Active
WLD
Wyckoff Spring + No Supply
LONG
$0.2393
$0.2423
50
✅ Active
XLM
Wyckoff Spring + No Supply
LONG
$0.1425
$0.1471
50
✅ Active
DOGE
Wyckoff Spring + No Supply
LONG
$0.1024
$0.1063
45
✅ Active
Notable Win: The KITE signal generated on May 18 delivered a +7.74% gain at TP1 via a Wyckoff Spring + No Supply pattern — one of the strongest performers this period.
Key Observation: The dominance of Wyckoff Spring + No Supply patterns (5 out of 6 active signals) suggests the market is probing for bottom formation across multiple altcoins. This is consistent with a late-stage distribution/early accumulation market regime.
Top 10 Market Performance
Asset
Price
24h Change
7d Change
Market Cap
BTC
$77,200
+0.33%
-5.07%
$1,544.5B
ETH
$2,126
-0.47%
-7.91%
$256.3B
USDT
$0.999
-0.03%
-0.08%
$189.7B
BNB
$642.68
-0.20%
-5.72%
$86.5B
XRP
$1.37
-1.38%
-6.41%
$84.5B
USDC
$1.001
-0.01%
-0.05%
$76.8B
SOL
$84.80
-0.56%
-11.30%
$48.9B
TRX
$0.3555
-0.40%
+1.68%
$33.7B
Standout: TRX is the only green asset on a 7-day basis (+1.68%), reflecting TRON's defensive profile during risk-off periods.
Week 21 Outlook & Key Levels
Scenarios
Bullish Scenario (30% probability):
A US-China trade breakthrough, combined with a softer-than-expected CPI print, could spark risk-on rotation. BTC targets $80,000, ETH targets $2,300.
Base Case (50% probability):
Continued consolidation within current ranges. BTC oscillates $75,000–$78,000. ETH holds $2,000–$2,200. Low volume persists.
Bearish Scenario (20% probability):
Strait of Hormuz crisis escalates, oil spikes above $110, Fed signals hawkish pivot. BTC tests $74,000, ETH approaches $1,900, SOL risks sub-$75.
What to Watch
Fed Chair Warsh's speech (May 22) — any hawkish language could accelerate the sell-off
US-China tariff reduction timeline — concrete dates would boost sentiment
BTC ETF flow data — continued outflows confirm institutional risk-off
$76,000 BTC support — a breakdown here opens the door to $74K
SOL $80 level — psychological floor for the Solana ecosystem
This analysis is powered by CoinXSight's AI intelligence engine, combining Deep Alpha multi-factor analysis, Alpha Hunter signal pipeline, and real-time market data. All data sourced live at the time of publication. This is not financial advice — always conduct your own research.
Head of Macro & Market Structure·Global Macro Desk
Former institutional FX and macro derivative analyst. Specializes in global liquidity cycles, central bank balance sheets, and crypto market microstructure.
QUANTITATIVE SUITE // DEEP ALPHA ENGINEACTIVE
BTC/USDT // LIVE SCANNER
CONFLUENCE 93
LIVE SPOT PRICE$83,908.89STRONG_BUY
TP2
$89,725.68
+6.94%
TP1
$86,233.44
+2.77%
ENTRY
$83,905.28
ZONE
SL
$82,741.19
-1.39%
Auto-detect Order Blocks, Fair Value Gaps and risk-adjusted DCA ladders in < 5s.
Comprehensive monthly cryptocurrency market review for May 2026. Total market cap trends, BTC/ETH/SOL performance breakdown, Alpha Hunter pipeline metrics, macro…