PPI Runs Hot at 6.3% — Core Doubles Its Forecast. Bitcoin Holds $82K on Growth Shock Fears.
US September PPI printed at 6.3% YoY vs 5.3% expected, but markets price growth shock over rate shock. Quantitative breakdown of Bitcoin's $80K line in the sand.
CX
cxs_adminInstitutional Analyst·Oct 16, 2026 · Updated Oct 16
Producer prices just posted their hottest reading in over four years. And the market’s reaction tells a story that should worry Bitcoin bulls more than any rate hike.
September PPI rose 1.3% month-over-month — nearly triple the 0.5% consensus — and 6.3% year-over-year against expectations of 5.5%. Core PPI doubled its forecast at 0.7% MoM. Energy costs surged 10.8%, with gasoline up a staggering 20.3% in a single month.
But here’s what matters for crypto: Treasury yields fell. Gold hit new records at $4,155. Fed hike odds for October dropped to just ~30%. The market isn’t pricing a rate shock — it’s pricing a growth shock.
And growth shocks are worse for Bitcoin than rate hikes.
The Numbers: PPI Hotter Than Anyone Expected
The Bureau of Labor Statistics data, released Thursday evening:
Headline PPI MoM: +1.3% (consensus +0.5%, prior +0.4%)
Headline PPI YoY: +6.3% (consensus +5.5%, prior revised to 5.6%)
Core PPI MoM: +0.7% (consensus +0.3%, prior +0.2%)
Core PPI YoY: +5.0%
Energy: +10.8% MoM
Gasoline: +20.3% MoM
This is the hottest PPI print since March 2022 — the month Russia invaded Ukraine and energy markets went haywire. The August annual figure was also revised upward to 5.6%, meaning the inflation trend was already worse than reported.
Combined with Wednesday’s CPI (3.7% headline, 2.6% core — see our CPI deep-dive), the picture is clear: inflation is reaccelerating across both consumer and producer prices. This isn’t a one-off energy spike. It’s broad-based.
Growth Shock vs Rate Shock: Why the Distinction Matters
After Wednesday’s hot CPI, the market priced a 55% chance of a Fed hike on October 28. After Thursday’s even hotter PPI, that number dropped to ~30%.
This seems paradoxical. Hotter inflation should mean more hikes, not fewer. But the bond market is telling a different story:
10-year Treasury yield: fell 8 basis points
Gold: +1% to $4,155, new all-time high
Dollar: softening against major currencies
The market’s logic: if producer prices are surging this fast, corporate margins are about to get crushed. Companies can’t pass 6.3% cost increases to consumers indefinitely — not when retail sales, while beating expectations at +0.8% ($745B), show consumers are already stretching.
When margins compress, earnings fall. When earnings fall, the Fed can’t hike — they’d be tightening into a slowdown. That’s a growth shock: inflation rising while growth decelerates. Stagflation-lite.
Why this is worse for Bitcoin than a rate hike:
A rate hike is a known quantity. Markets can price it, position for it, and move on. A growth shock is open-ended — nobody knows how deep the slowdown goes or how long it lasts. Uncertainty is the enemy of risk assets, and Bitcoin, with its 0.7+ correlation to equities, gets no safe-haven bid.
Gold is getting the safe-haven flow ($4,155 proves it). Bitcoin is not.
Bitcoin at $82K: The $80K Line in the Sand
Bitcoin’s reaction to the PPI print was telling. In the three minutes after release, BTC dropped from $80,925 to $80,582 — a $343 slide on the headline. The 24-hour low printed at $80,443.
By Friday morning, Bitcoin had recovered to around $82,200. But the $80,000 level was tested, and the market noticed.
Options max pain: ~$80,000 for the October 30 expiry. Market makers have incentive to pin price here.
Psychological round number: A clean break below $80K triggers stop-losses and algorithmic selling.
Strategy’s cost basis: Michael Saylor’s average is ~$75,440. A drop toward $78K puts the largest corporate holder underwater on recent purchases.
Liquidation cluster: CoinGlass data shows concentrated long liquidations between $79,500–$80,500 (see our liquidation heatmap guide for how to read these clusters).
Bitcoin holding $82K on Friday is constructive, but it’s a dead-cat bounce until $83,500 breaks. That’s the level where the short-liquidation cluster sits ($82,800–$83,500). A break above triggers short covering that could run to $85,000+.
Below $80,000, the next major support is $78,000, then the $75,000–$76,000 zone (options max pain + Strategy’s basis + 200-day moving average confluence).
ETF Flows: The Institutional Verdict
Spot Bitcoin ETF flows tell the institutional story:
October 14: -$261.4 million (heavy outflows on CPI day)
October 15: +$5.06 million (essentially flat on PPI day)
The $261M outflow on CPI day was the dominant flow event (detailed in our ETF outflow analysis). Institutions sold the CPI news aggressively. On PPI day — despite an even hotter print — they barely reacted. Net flat.
Interpretation: Institutions are not panic-selling on inflation data anymore. They’ve already de-risked. The $5M net inflow on PPI day, while tiny, suggests the selling pressure may be exhausting.
But don’t mistake stabilization for accumulation. For a real reversal, we need to see consecutive days of $100M+ inflows. Until then, ETF flows are neutral at best.
The Fed’s Impossible Position
Chairman Warsh speaks Friday. The FOMC meets October 27–28. Here’s the Fed’s dilemma:
Case for hiking: CPI at 3.7% and PPI at 6.3% are both well above the 2% target. Core PPI doubling its forecast (0.7% vs 0.3%) shows underlying price pressures are accelerating, not fading. If the Fed doesn’t act, inflation expectations could de-anchor.
Case for holding: The bond market is already doing the Fed’s job. Yields falling on hot inflation data means the market expects growth to slow — which will cool inflation naturally. Hiking into a growth shock risks tipping the economy into recession.
Most likely outcome: The Fed holds in October but signals a December hike is firmly on the table. This is the “hawkish hold” — don’t shock the market now, but keep pressure on.
For Bitcoin, a hawkish hold is mildly bearish. It keeps the “higher for longer” narrative alive without providing the clarity of an actual decision. Markets hate limbo.
US Session Game Plan: What to Watch
As US markets open Friday afternoon (VN time), here’s the playbook:
Bullish triggers:
Warsh sounds dovish (“looking through” energy inflation, emphasizes growth risks)
Bitcoin reclaims $82,500 and holds into the US close
ETF inflows turn positive (>$50M)
S&P 500 rallies on “bad news is good news” (weak data = no hike)
Bearish triggers:
Warsh sounds hawkish (emphasizes core PPI, “more work to do”)
Bitcoin loses $81,000 and tests $80,000 into the weekend
ETF outflows resume (>$100M)
10-year yield reverses higher (growth shock morphs back into rate shock)
The key level for the US session is $82,500. Above it, shorts get squeezed. Below $81,000, longs get nervous. Between those levels, it’s chop.
Weekend risk: Crypto trades 24/7. If Warsh is hawkish Friday and there’s no bid over the weekend, Monday’s Asia open could gap down. The $80,000 test would likely come Sunday night (VN time).
Historical Context: When PPI Last Ran This Hot
March 2022: PPI hit 6.3% YoY (the same level as today). What happened next?
Bitcoin fell from ~$47,000 to ~$35,000 over the next two months (-25%)
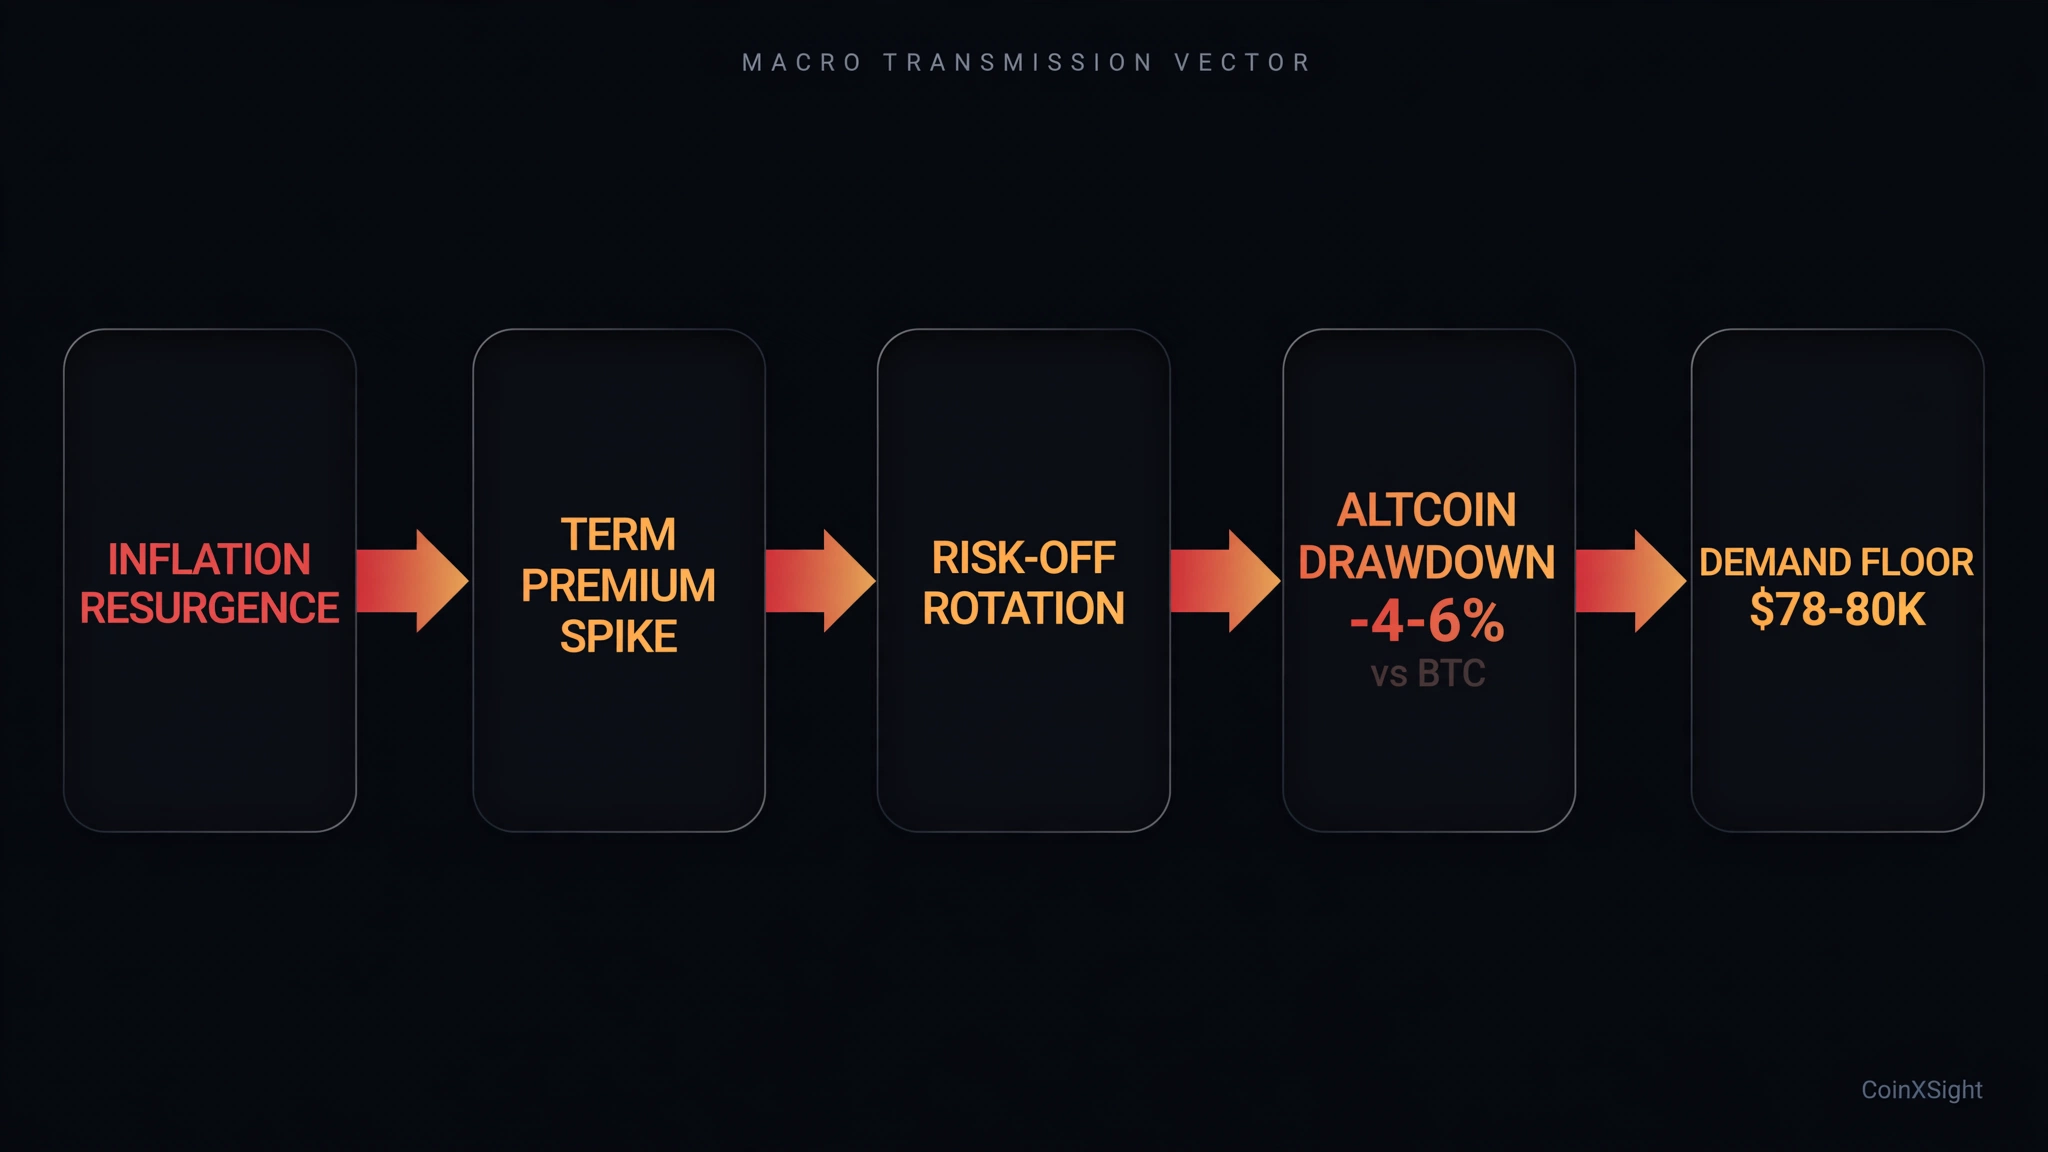
Macro transmission vector: from wholesale inflation to crypto liquidity.
The Fed hiked 50bps in May, then 75bps in June, July, and September
Crypto entered a brutal bear market (Luna collapsed in May, FTX in November)
But 2026 is not 2022. Key differences:
Starting point: Bitcoin at $82K with institutional infrastructure vs $47K in a retail-driven market
Fed posture: Already at 3.75–4.00%, debating one more hike vs starting from zero in 2022
Market structure: ETF flows provide a bid that didn’t exist in 2022
Inflation composition: Energy-driven (supply shock) vs demand-driven in 2022
The 2022 analog suggests caution, not panic. A 10–15% drawdown to $70K–$75K is possible if the growth shock deepens. A 2022-style 50%+ crash would require a systemic event (exchange failure, sovereign default) that isn’t on the radar.
Who’s Buying? On-Chain Signals
Despite the macro headwinds, on-chain data shows accumulation:
Exchange balances: Declining. Bitcoin leaving exchanges = holders moving to cold storage, not preparing to sell.
Long-term holder supply: At all-time highs. The “diamond hands” cohort isn’t flinching.
$80K–$82K zone: On-chain data shows significant buying in this range over the past 48 hours.
The buyers are patient, not aggressive. They’re accumulating on dips, not chasing. This is healthy — it builds a floor — but it doesn’t create the momentum needed for a breakout.
For a real rally, we need new buyers, not just existing holders adding. That means ETF inflows, corporate treasury announcements, or a macro catalyst (dovish Fed pivot, inflation rolling over).
Positioning: How Smart Money Is Playing This
The smart money isn’t guessing — it’s hedging. Here’s how sophisticated players are positioned:
Options market: Put/call ratios for October expiry are elevated but not extreme. The $75,000 puts have seen the most volume increase since the PPI print — suggesting hedging, not panic. Call buying at $85,000–$90,000 hasn’t collapsed, meaning bulls haven’t capitulated.
Futures basis: The CME Bitcoin futures premium over spot has compressed to ~2% annualized, down from ~5% last month. A compressing basis means less leveraged bullishness — the “carry trade” crowd is reducing exposure. This is healthy deleveraging, not forced selling.
Funding rates: Perpetual funding is slightly negative (-0.001% to -0.003%), indicating more shorts than longs. In a contrarian framework, this is bullish — crowded shorts are fuel for a squeeze if any positive catalyst emerges.
Stablecoin flows: USDT and USDC inflows to exchanges ticked up 12% in the 24 hours after PPI. This is “dry powder” — capital sitting on exchanges ready to buy dips. It’s not yet deployed, but it’s positioned.
The composite picture: defensive but not bearish. Smart money is hedged, de-levered, and holding cash — waiting for clarity from the Fed before committing.
The Asian Session Preview: What Monday Brings
Friday’s US session sets the tone, but Monday’s Asian session often determines the week’s direction. Here’s what to expect:
If Friday closes strong (BTC >$82,500): Asian buyers — particularly Korean and Japanese retail — tend to chase momentum. Weekend social media buzz amplifies. Monday could see a push toward $84,000–$85,000 as FOMO builds ahead of the FOMC.
If Friday closes weak (BTC <$81,000): Asian markets open to a fragile tape. The $80,000 test likely comes during thin Sunday-night liquidity. Korean exchanges (Upbit, Bithumb) often see panic selling that exaggerates moves by 1–2%.
The wild card is China. Despite the trading ban, Chinese OTC desks remain significant. If the PBOC signals any easing (they’ve been quiet), it could spark a bid. Conversely, any regulatory noise from Beijing would accelerate selling.
$80,000: The line that must hold through the weekend
$78,500: Sunday-night wick target if $80K breaks on low volume
For traders: reduce leverage into the weekend. The combination of Warsh’s speech Friday, thin weekend liquidity, and the FOMC looming means volatility will be elevated. Spot holders can ride it out. Leveraged longs above 3x are asking for trouble.
The Bottom Line: $80K Is the Line
PPI at 6.3% is the hottest in four years. But the market isn’t afraid of rate hikes — it’s afraid of a growth shock. That’s worse for Bitcoin.
The $80,000 level is the line in the sand. Hold it, and Bitcoin consolidates before the FOMC. Lose it, and $75,000–$78,000 comes fast.
Friday’s US session is the proving ground. Watch Warsh’s speech, watch $82,500, and watch ETF flows. The answers will determine whether Bitcoin enters the FOMC meeting from a position of strength or desperation.
One final note for long-term holders: macro noise is loudest at turning points. The investors who bought Bitcoin at $16,000 in late 2022 did so when CPI was at 7%+ and the Fed was hiking 75bps per meeting. They weren’t timing the macro — they were buying the fear. Today’s fear is real, but so is the opportunity for those with a multi-year horizon. The $80K line matters for traders. For investors, the only line that matters is whether you believe Bitcoin outlives this cycle’s macro headwinds. History says it does.
Disclaimer: This article is for educational and informational purposes only and does not constitute financial, investment, or trading advice. Digital asset markets involve significant volatility and capital risk. Always conduct independent research before making financial decisions. Data sources: U.S. Bureau of Labor Statistics (PPI September 2026), CoinGlass (liquidation data), CME FedWatch / Kalshi (rate probabilities).
CX
cxs_admin
ANALYST // RESEARCH
Institutional Analyst·CoinXSight Alpha Desk
CoinXSight Institutional Research Desk produces quantitative crypto market intelligence, algorithmic models, and on-chain forensics.
QUANTITATIVE SUITE // DEEP ALPHA ENGINEACTIVE
BTC/USDT // LIVE SCANNER
CONFLUENCE 100
LIVE SPOT PRICE$82,606.01STRONG_BUY
TP2
$90,642.48
+9.94%
TP1
$85,726.41
+3.98%
ENTRY
$82,449.02
ZONE
SL
$80,810.33
-1.99%
Auto-detect Order Blocks, Fair Value Gaps and risk-adjusted DCA ladders in < 5s.