Reading the Liquidation Heatmap: How to Avoid Getting Swept Before CPI
A quantitative guide to reading Bitcoin liquidation heatmaps ahead of US September CPI: leverage clusters, funding signals, and five rules to avoid getting swept.
CX
cxs_adminInstitutional Analyst·Oct 14, 2026 · Updated Oct 14
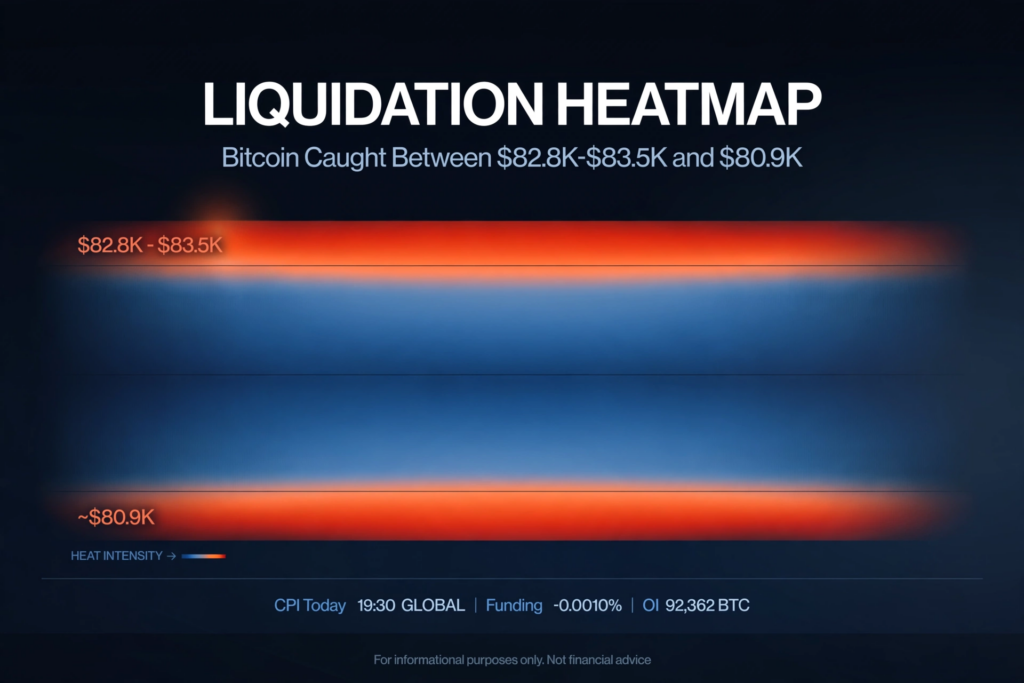
Tonight at 19:30 Vietnam time (8:30 AM ET), the US releases September CPI. On Bitcoin’s liquidation heatmap, two leverage clusters are waiting on either side: $82,800–$83,500 above, ~$80,900 below. Funding just flipped negative to -0.0010%. Open interest: 92,362 BTC.
If you’re holding leveraged positions tonight, this is how you avoid becoming someone else’s liquidity. We’ll read the heatmap like a professional: what it is, what the current map says, and which CPI scenario triggers which sweep.
What Is a Liquidation Heatmap?
Imagine every leveraged futures position in the market has a “death point” — the price at which margin runs out and the exchange auto-closes the position. Plot all those death points across every price level and you get a heat map: the more positions that would be liquidated at a given price, the “hotter” it glows.
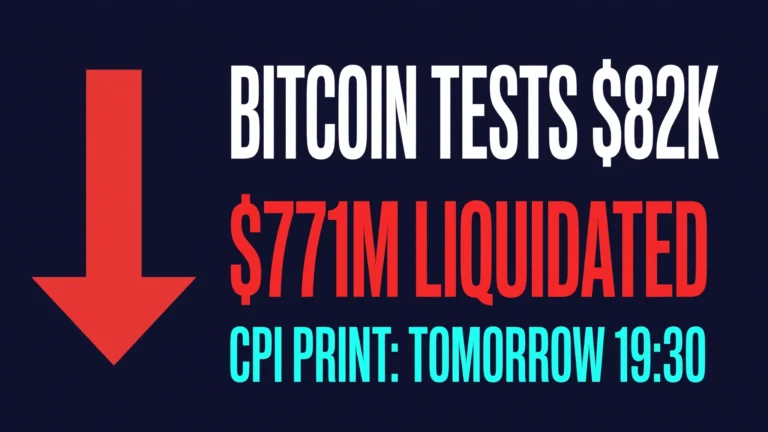
Market makers and large funds read this map daily. Not to predict where price goes — but to know where price can be pulled. When a large liquidation cluster forms, it creates gravitational pull: as price approaches, more stop-losses trigger, more positions get force-closed, pushing price further in the same direction. That’s a cascade — exactly what happened yesterday with $771 million wiped out in 24 hours.
Understanding the heatmap doesn’t help you guess direction correctly. It helps you know where the danger zones are so you don’t place orders there — or so you can fade the crowd when everyone’s piled to one side.
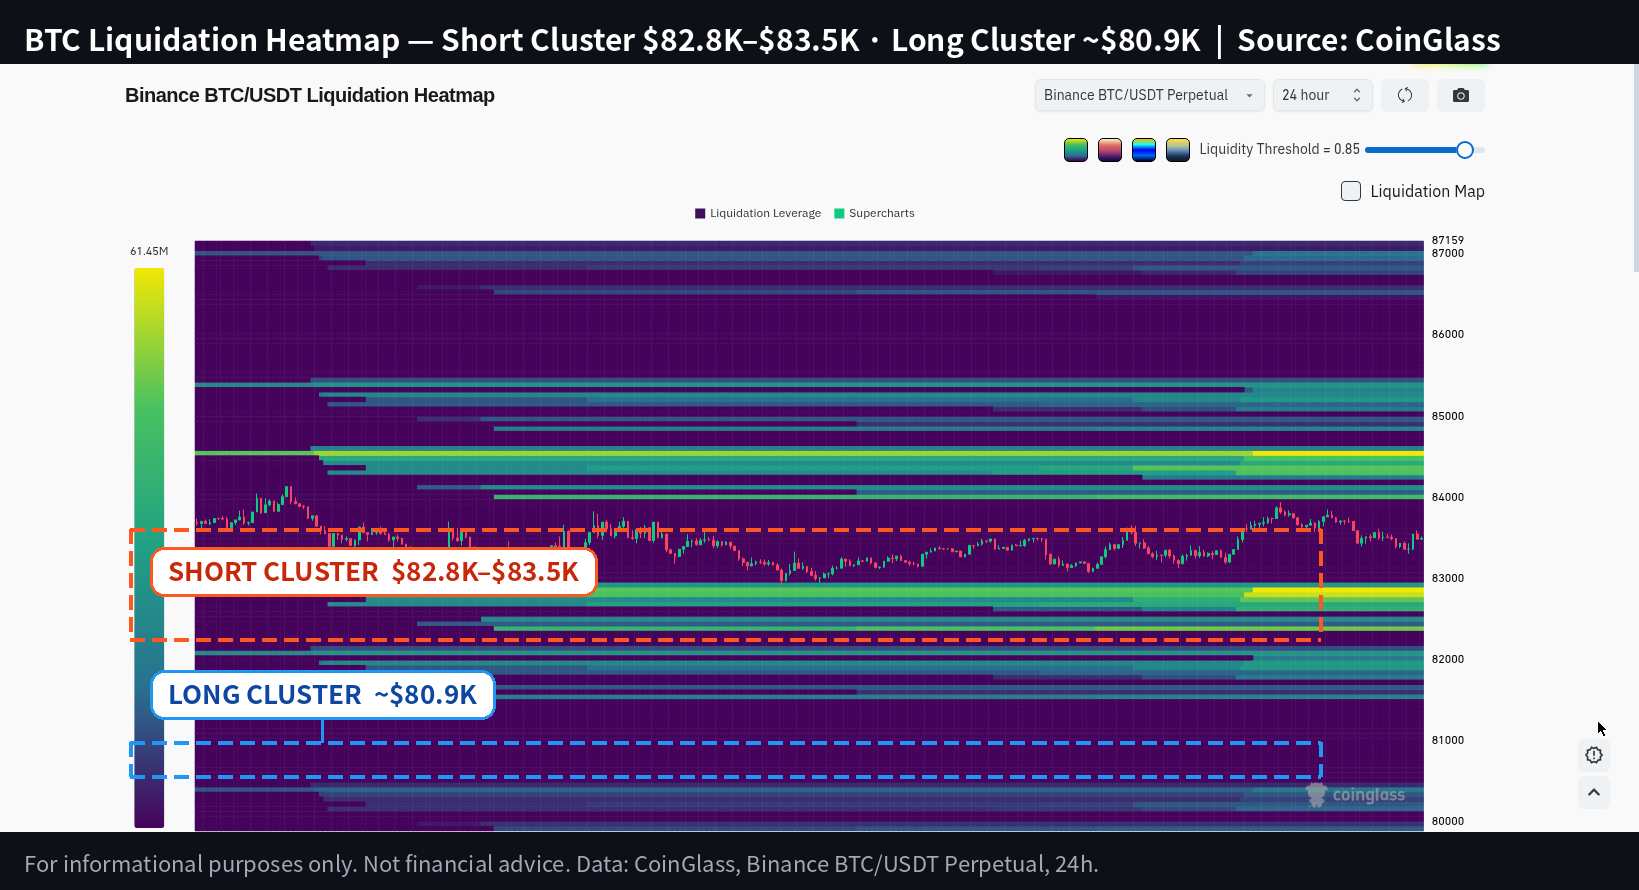
Understanding color density bands and liquidation thresholds on CoinGlass.
The Current Map: Bitcoin Squeezed Between Two Clusters
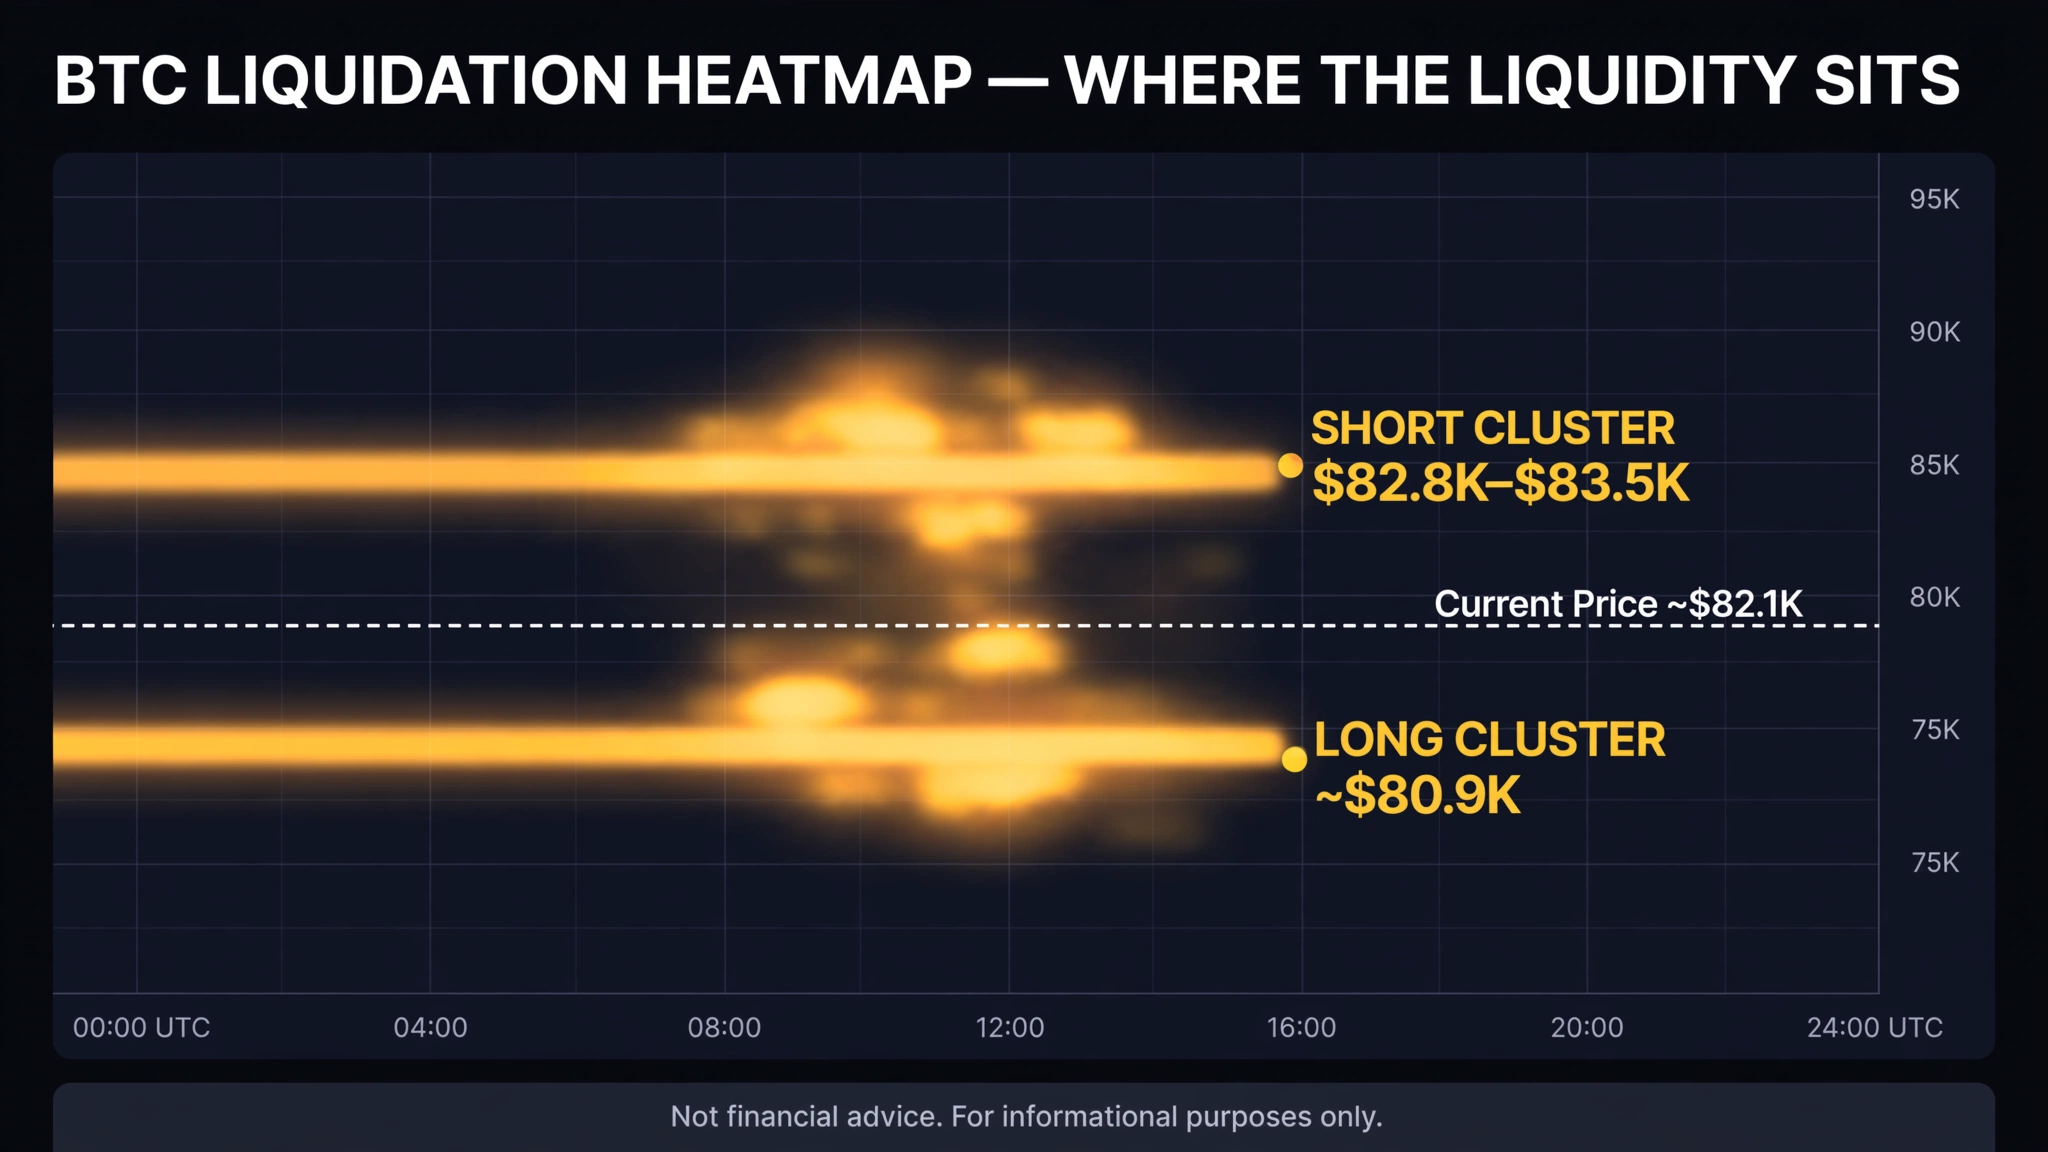
Bitcoin Liquidation Heatmap Telemetry: Key short liquidity clusters at $82.8K–$83.5K vs long cascade support at ~$80.9K ahead of US CPI.
The latest Data Hub numbers paint a clear picture:
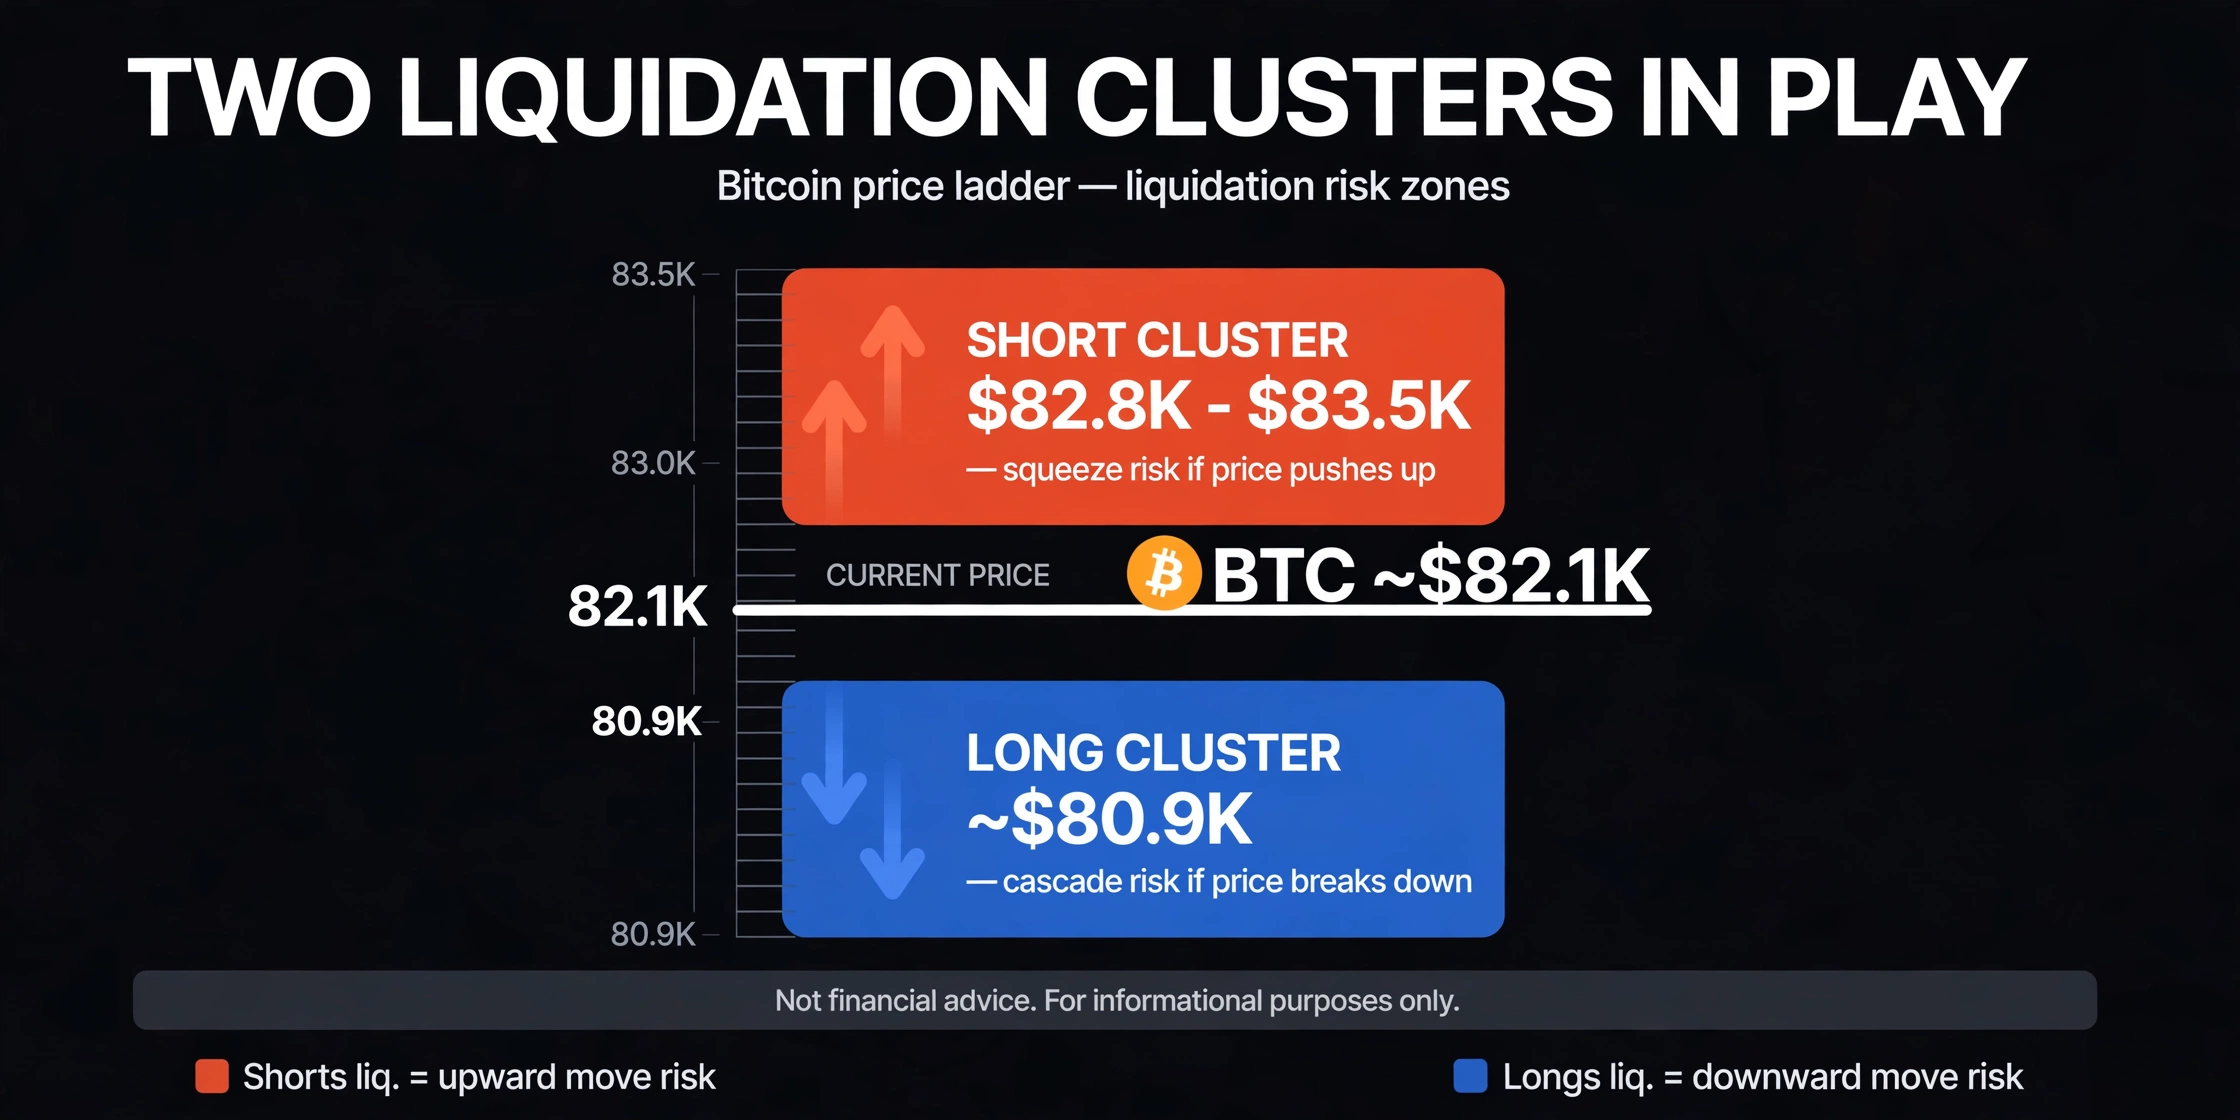
Upper cluster: $82,800–$83,500. This is where leveraged shorts are concentrated. If price breaks above $83,500, a short-covering wave ignites — shorts get squeezed into buying back, pushing price higher. This is the fuel for a squeeze scenario.
Lower cluster: ~$80,900. This is where leveraged longs are stacked. If price breaks below $80,900, the long cascade repeats yesterday’s pattern: forced selling → lower prices → more liquidations. Max pain for this week’s options expiry sits at $80,000, right below this cluster — meaning if $80,900 breaks, $80,000 becomes the next magnet.
Bitcoin is currently trading around $82,000–$83,000 — between the two clusters, closer to the upper one. This is an extremely sensitive position ahead of a binary event like CPI: a strong enough push in either direction detonates the corresponding cluster.
The asymmetry matters. The upper cluster ($82,800–$83,500) covers a range where Bitcoin traded for most of last week — meaning shorts accumulated there during the sideways chop. The lower cluster ($80,900) was already “tested” yesterday when the 24-hour low printed $80,942 — some weak longs were flushed, but enough remain to fuel a second cascade if price returns.
Key liquidation clusters: $83.5K short liquidity pool vs $80.9K long cascade floor.
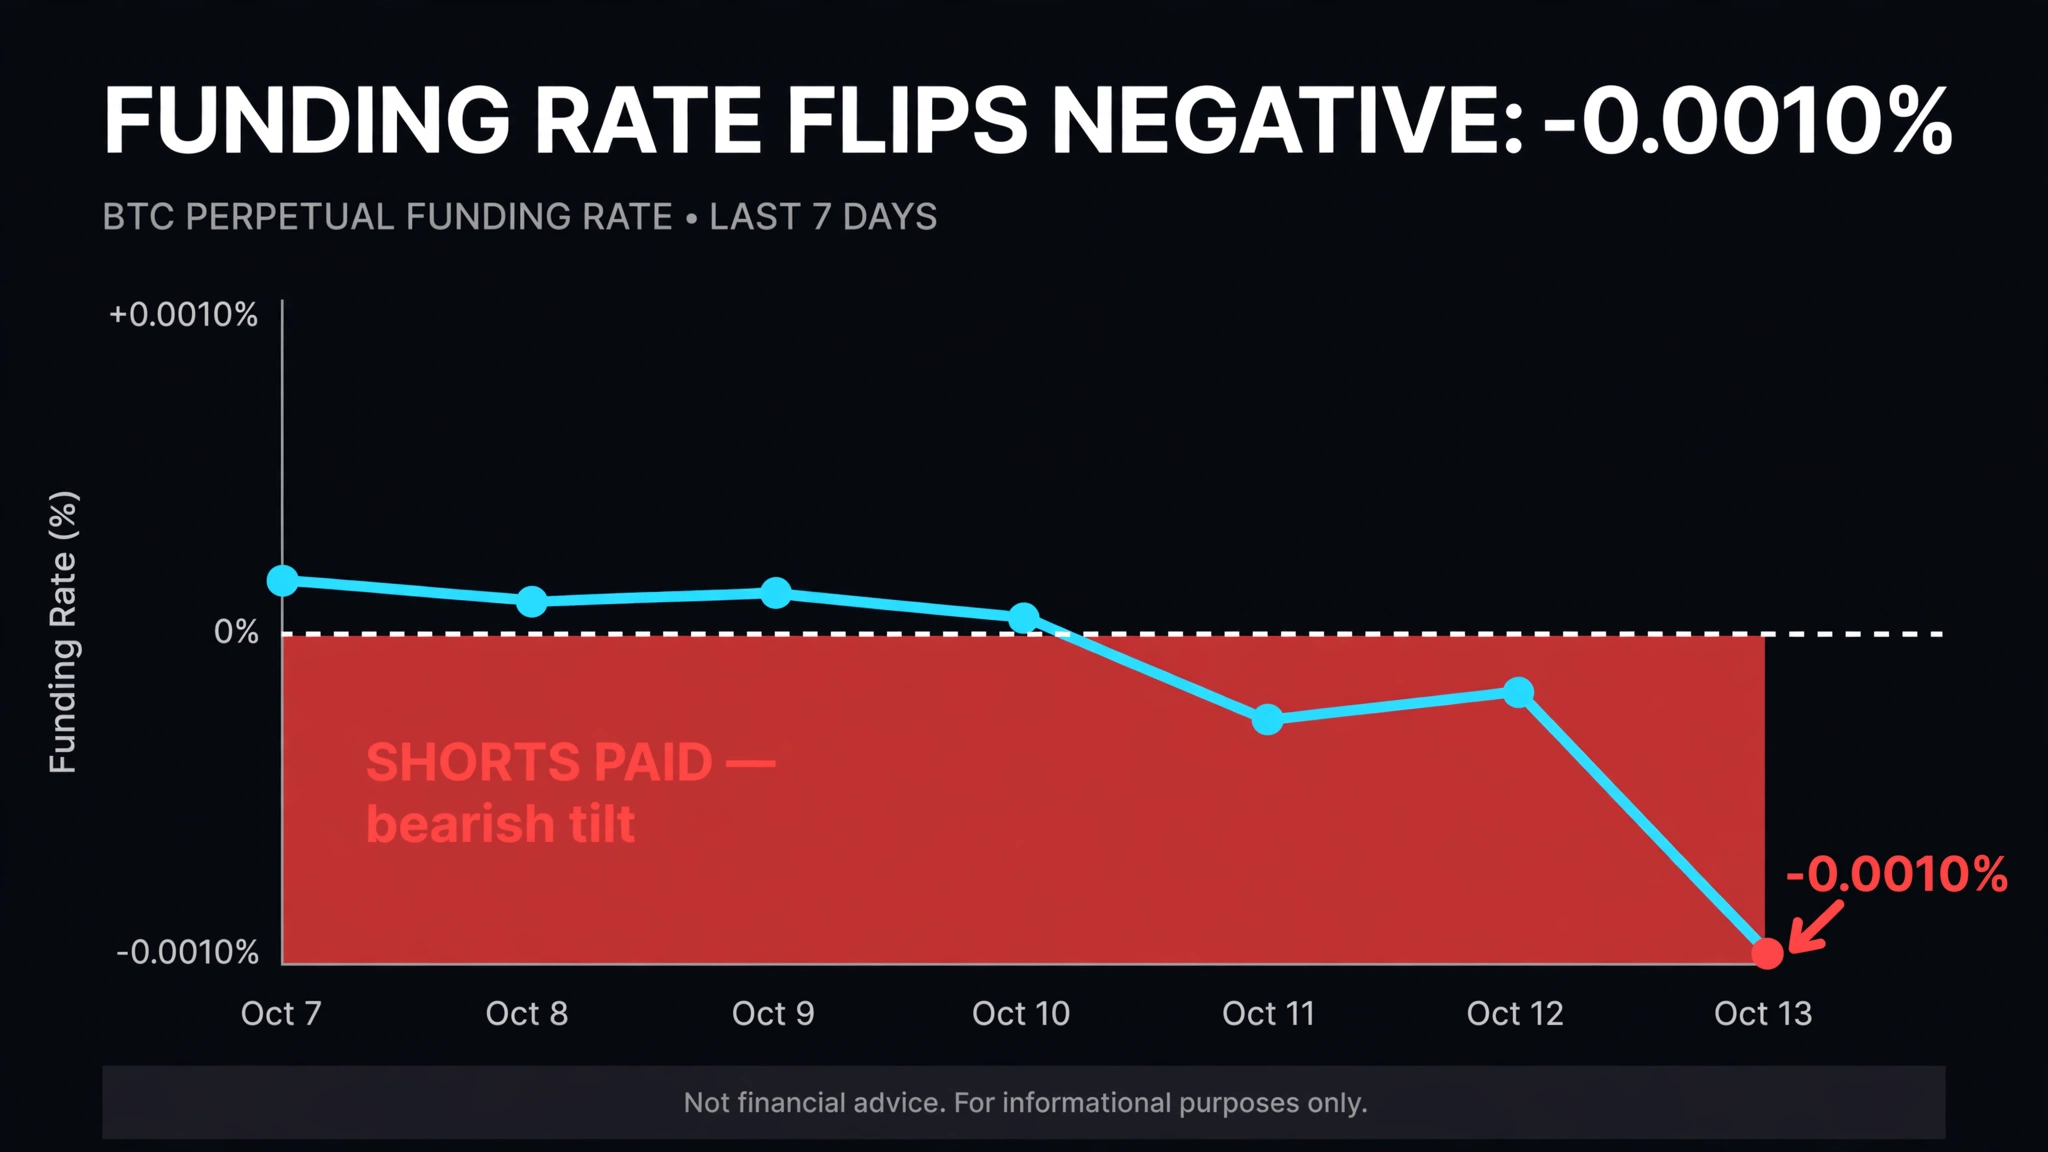
Funding Rate -0.0010%: Shorts Are Paying
Funding rate shifts from positive to negative: reading sentiment imbalances.
The funding rate is the periodic payment between longs and shorts in perpetual futures markets. When funding is positive, longs pay shorts (longs are crowded). When negative, shorts pay longs (shorts are crowded).
Current reading: -0.0010%. Negative. Shorts are paying.
This is a notable shift from yesterday, when funding sat at +0.0067% (neutral). After the yesterday’s $771 million liquidation cascade flushed leveraged longs, the balance has tilted: shorts are now the crowded side, paying to hold their positions.
From a contrarian perspective, this cuts both ways. Bullish read: when shorts are overcrowded, any positive surprise can trigger a short squeeze — and the $82,800–$83,500 cluster is exactly where that squeeze would detonate. Bearish read: the market is pricing a hot CPI. If CPI actually prints hot (>3.8%), the shorts are correctly positioned and the long cascade at $80,900 claims its next victims.
The rule for reading funding: never stand with the side paying high fees. Current fees are low (-0.0010% is near neutral), but the direction — positive to negative — shows sentiment turning bearish into the print.
Open Interest at 92,362 BTC: How Much Ammunition Remains?
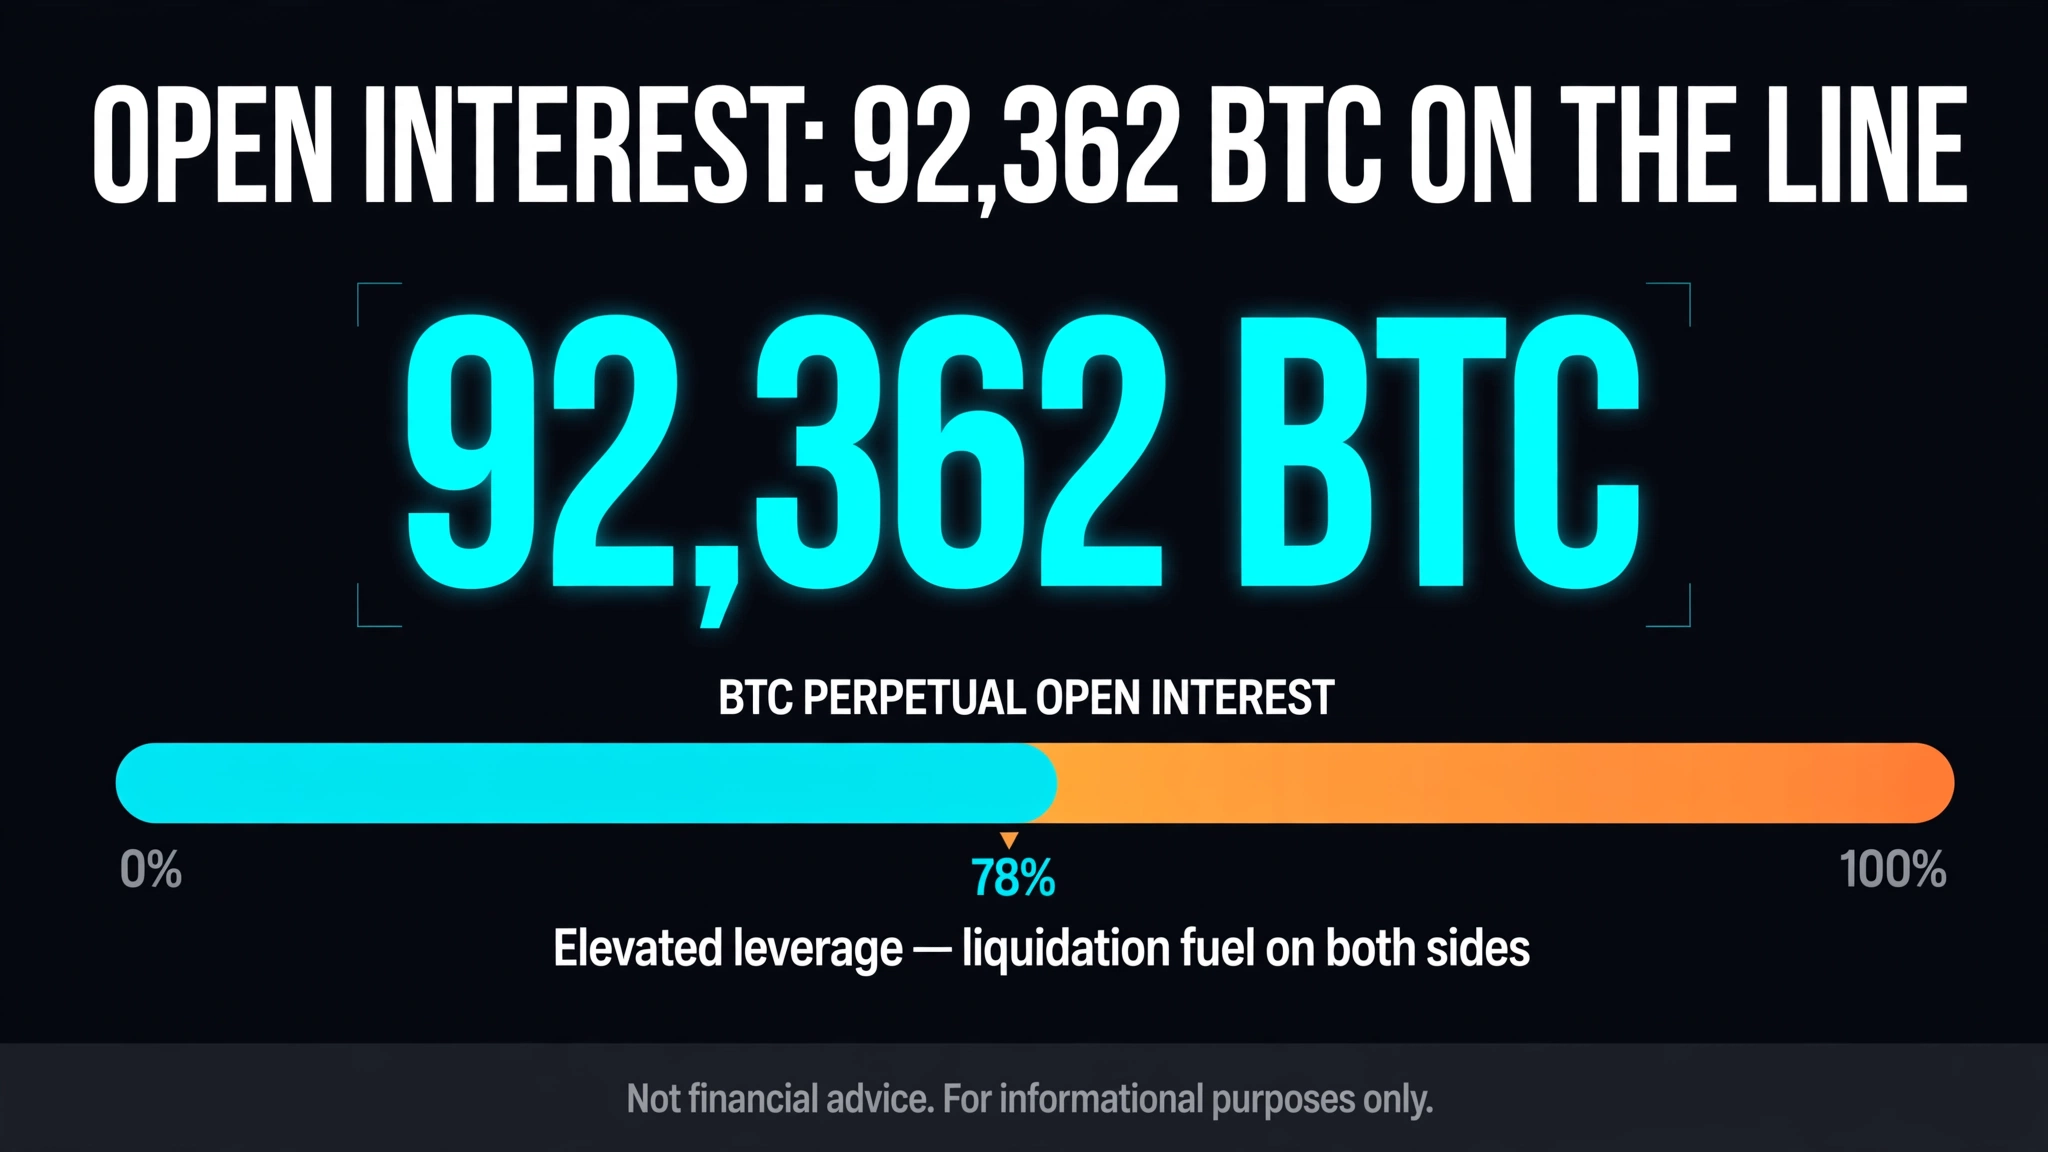
Aggregated Bitcoin Open Interest reaching record density before major prints.
Open interest measures the total value of outstanding futures contracts. Current: 92,362 BTC — roughly $7.6 billion at current prices.
Compared to yesterday (93,192 BTC before the 8.5% flush), OI has declined slightly — meaning some leverage was removed and hasn’t fully rebuilt. This is healthy: the market enters the CPI event with less leverage, reducing the risk of an extreme cascade.
But 92,362 BTC is still a large number. With average crypto leverage around 10–20x, the actual margin behind this OI is only $380–$760 million — while the notional value is $7.6 billion. A 5% price move could erase $380 million in margin, triggering hundreds of millions in follow-on liquidations.
The key question: where is OI concentrated? Based on the heatmap, most of it appears clustered around $82,800–$83,500 and $80,900. This means current OI isn’t neutral “ammunition” — it’s two timed charges on either side, waiting for CPI to detonate one of them.
Lessons From Yesterday’s $771 Million Cascade
Yesterday was a masterclass in how heatmaps work in practice.
It started when Bitcoin slipped below $83,000. Within 15 minutes, $120 million in longs was liquidated — the epicenter, the initial blast. But the cascade didn’t stop there. As price kept falling, more stop-losses were hit, more positions force-closed. Twenty-four-hour total: $771 million, 89% longs ($686 million), across 172,662 traders.
The critical point: yesterday’s cascade started from a liquidation cluster the heatmap had already “telegraphed.” Traders who read the heatmap knew the $82,800–$83,000 zone was dangerous for longs. Those with stop-losses below that zone escaped in time. Those holding high-leverage longs through it became cascade fuel.
Second lesson: speed. $120 million gone in 15 minutes — nobody reacts manually to that. In leveraged markets, you don’t “cut losses” when the cascade hits; you must have already cut them before, or have automated stop-losses in safe positions.
Third lesson: after a cascade, the market is usually “cleaner.” Funding reset to neutral (yesterday), OI dropped 8.5%. Those who survived yesterday’s flush are in better shape today — as long as they didn’t re-leverage too quickly.
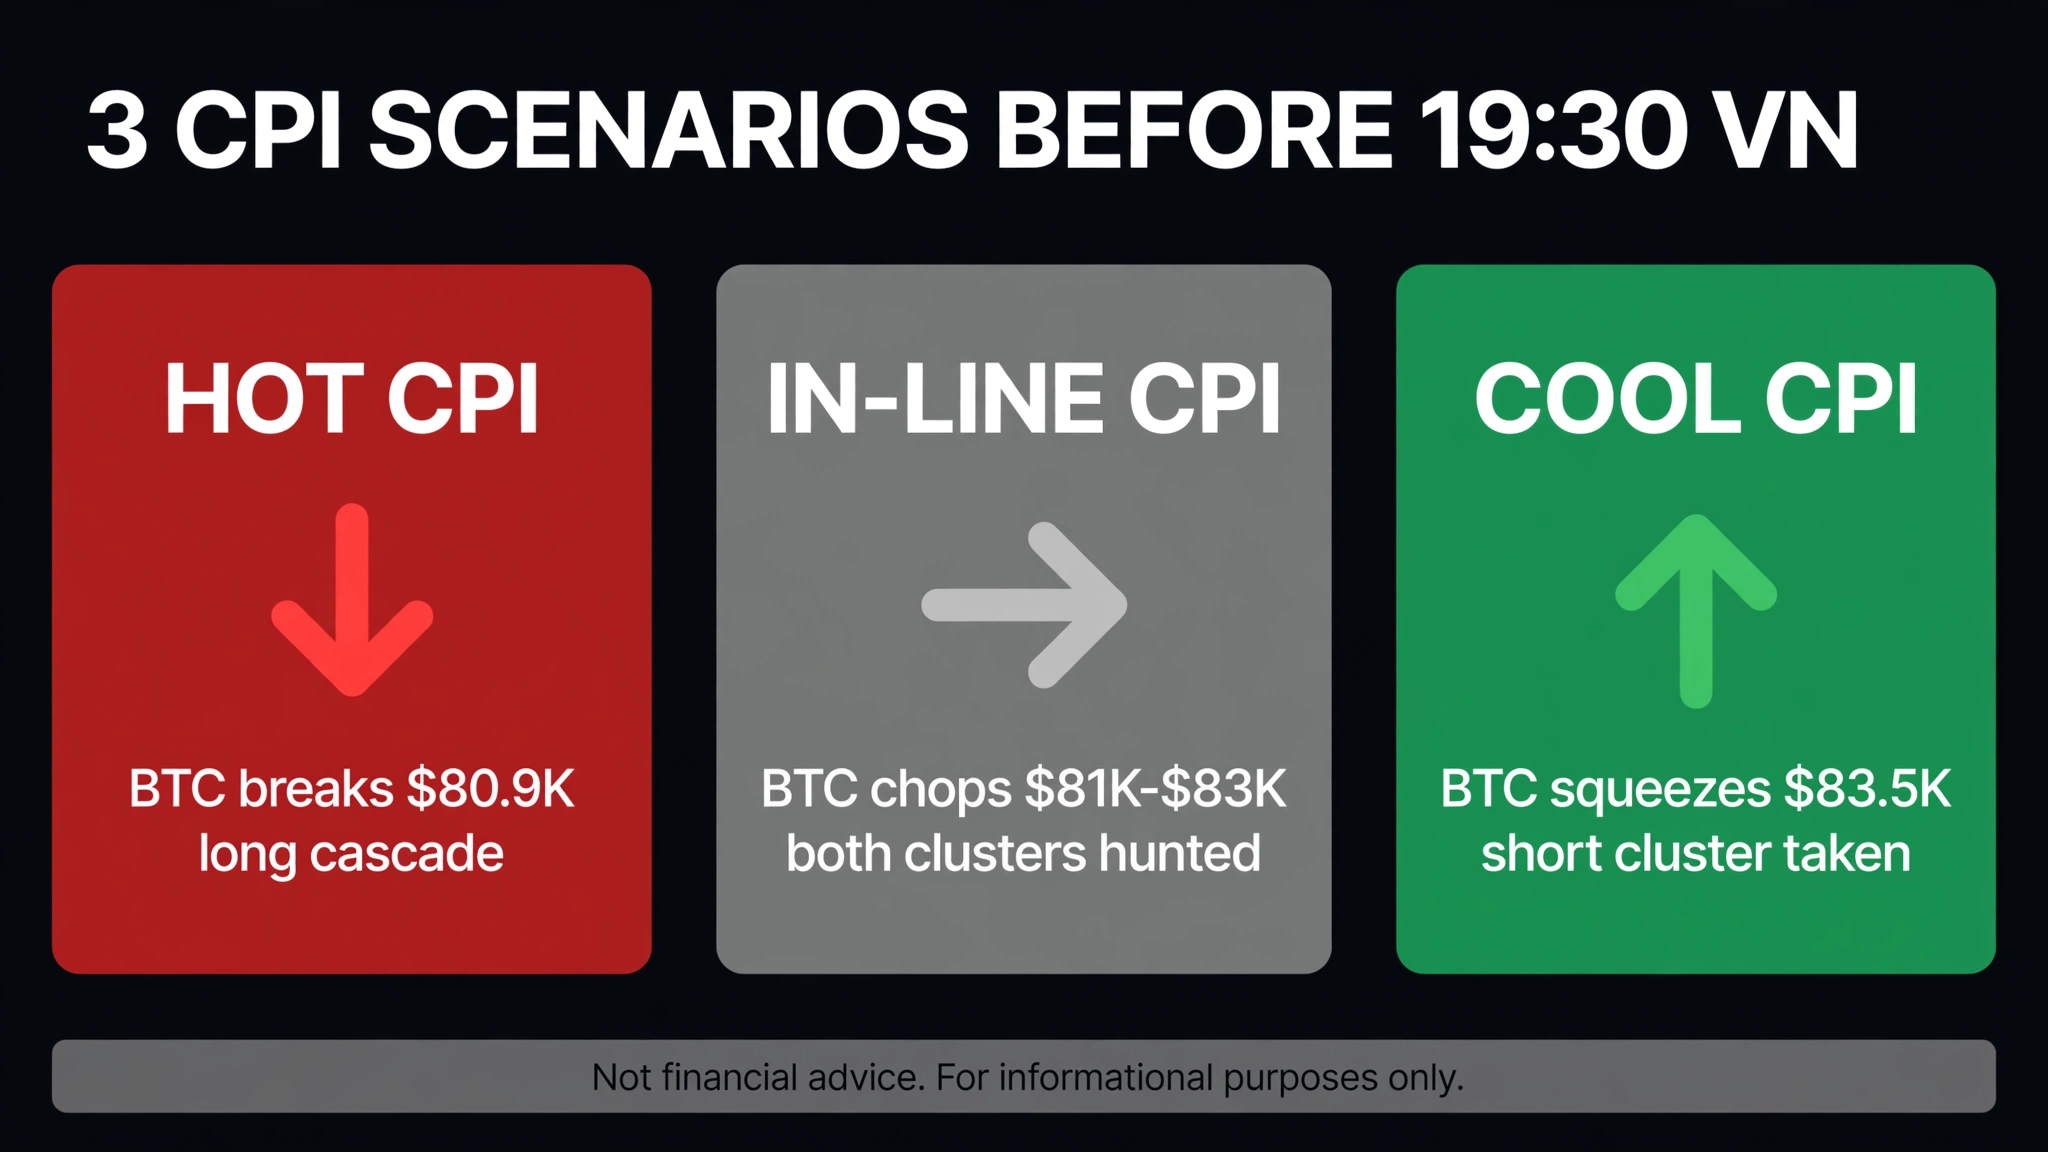
Macro scenario framework mapping expected volatility against liquidation zones.
Three CPI Scenarios Through the Heatmap Lens
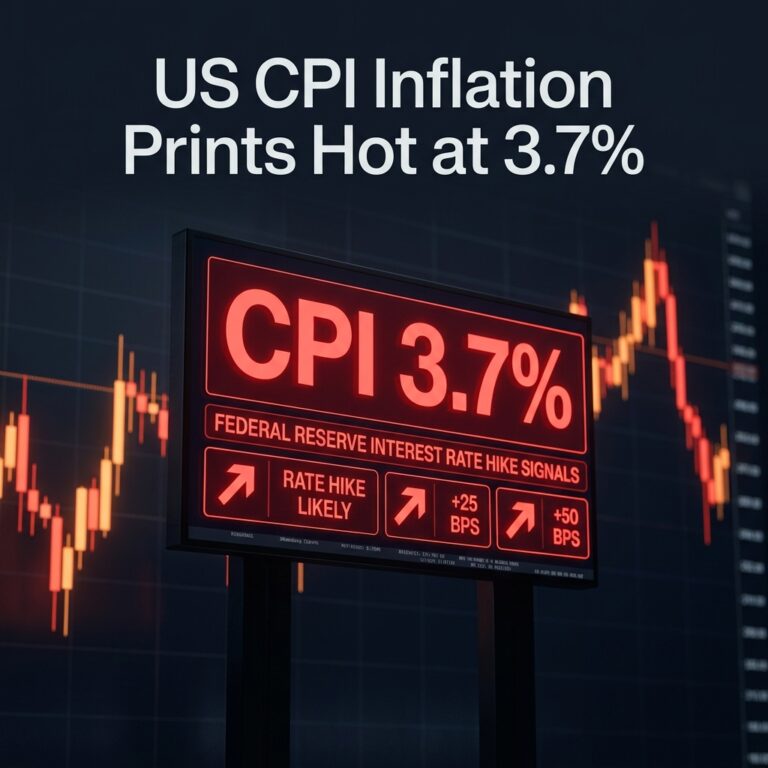
September CPI prints tonight at 19:30 Vietnam time. Consensus: headline 3.7% YoY / +0.6% MoM; core 2.5% YoY / +0.2% MoM. Here’s how each scenario interacts with the current heatmap:
Scenario 1: Cool CPI (<3.6%) — Detonates the upper cluster.
A genuine surprise against the 3.7% consensus. Immediate reaction: dollar weakens, bond yields drop, risk-on returns. Bitcoin breaks above $83,500, triggering the short squeeze. Shorts in the $82,800–$83,500 cluster get force-covered, pushing price higher. Next target: the $86,800–$87,700 short-liquidation zone, then $90,000 (call wall). Current negative funding amplifies the squeeze — crowded shorts will panic-cover. Probability: ~20–25%.
Scenario 2: Hot CPI (>3.8%) — Detonates the lower cluster.
Rate-hike expectations explode. The 10-year Treasury (already at a 24-year high) pushes higher. Every risk asset sells off. Bitcoin breaks $80,900, the long cascade repeats — potentially deeper, since some “cushion” was already eroded yesterday. Max pain at $80,000 is the first target. If $80,000 breaks too, watch $78,000–$78,500 (options model). Shorts collecting funding get rewarded. Probability: ~25–30%.
Scenario 3: In line (3.6–3.8%) — Neither cluster detonates.
The market sighs with relief that it wasn’t worse, but there’s no catalyst for a directional break. Bitcoin likely chops between $81,000 and $84,000 into the October 28 FOMC meeting (where pause is the base case, hike odds under 20%). Both heatmap clusters remain loaded but lack a strong enough trigger. Highest probability (~50%) — and the most “boring” outcome, but the healthiest after two volatile days. December is the truly important meeting (~70% hike odds), and tonight’s CPI is the data that decides it.
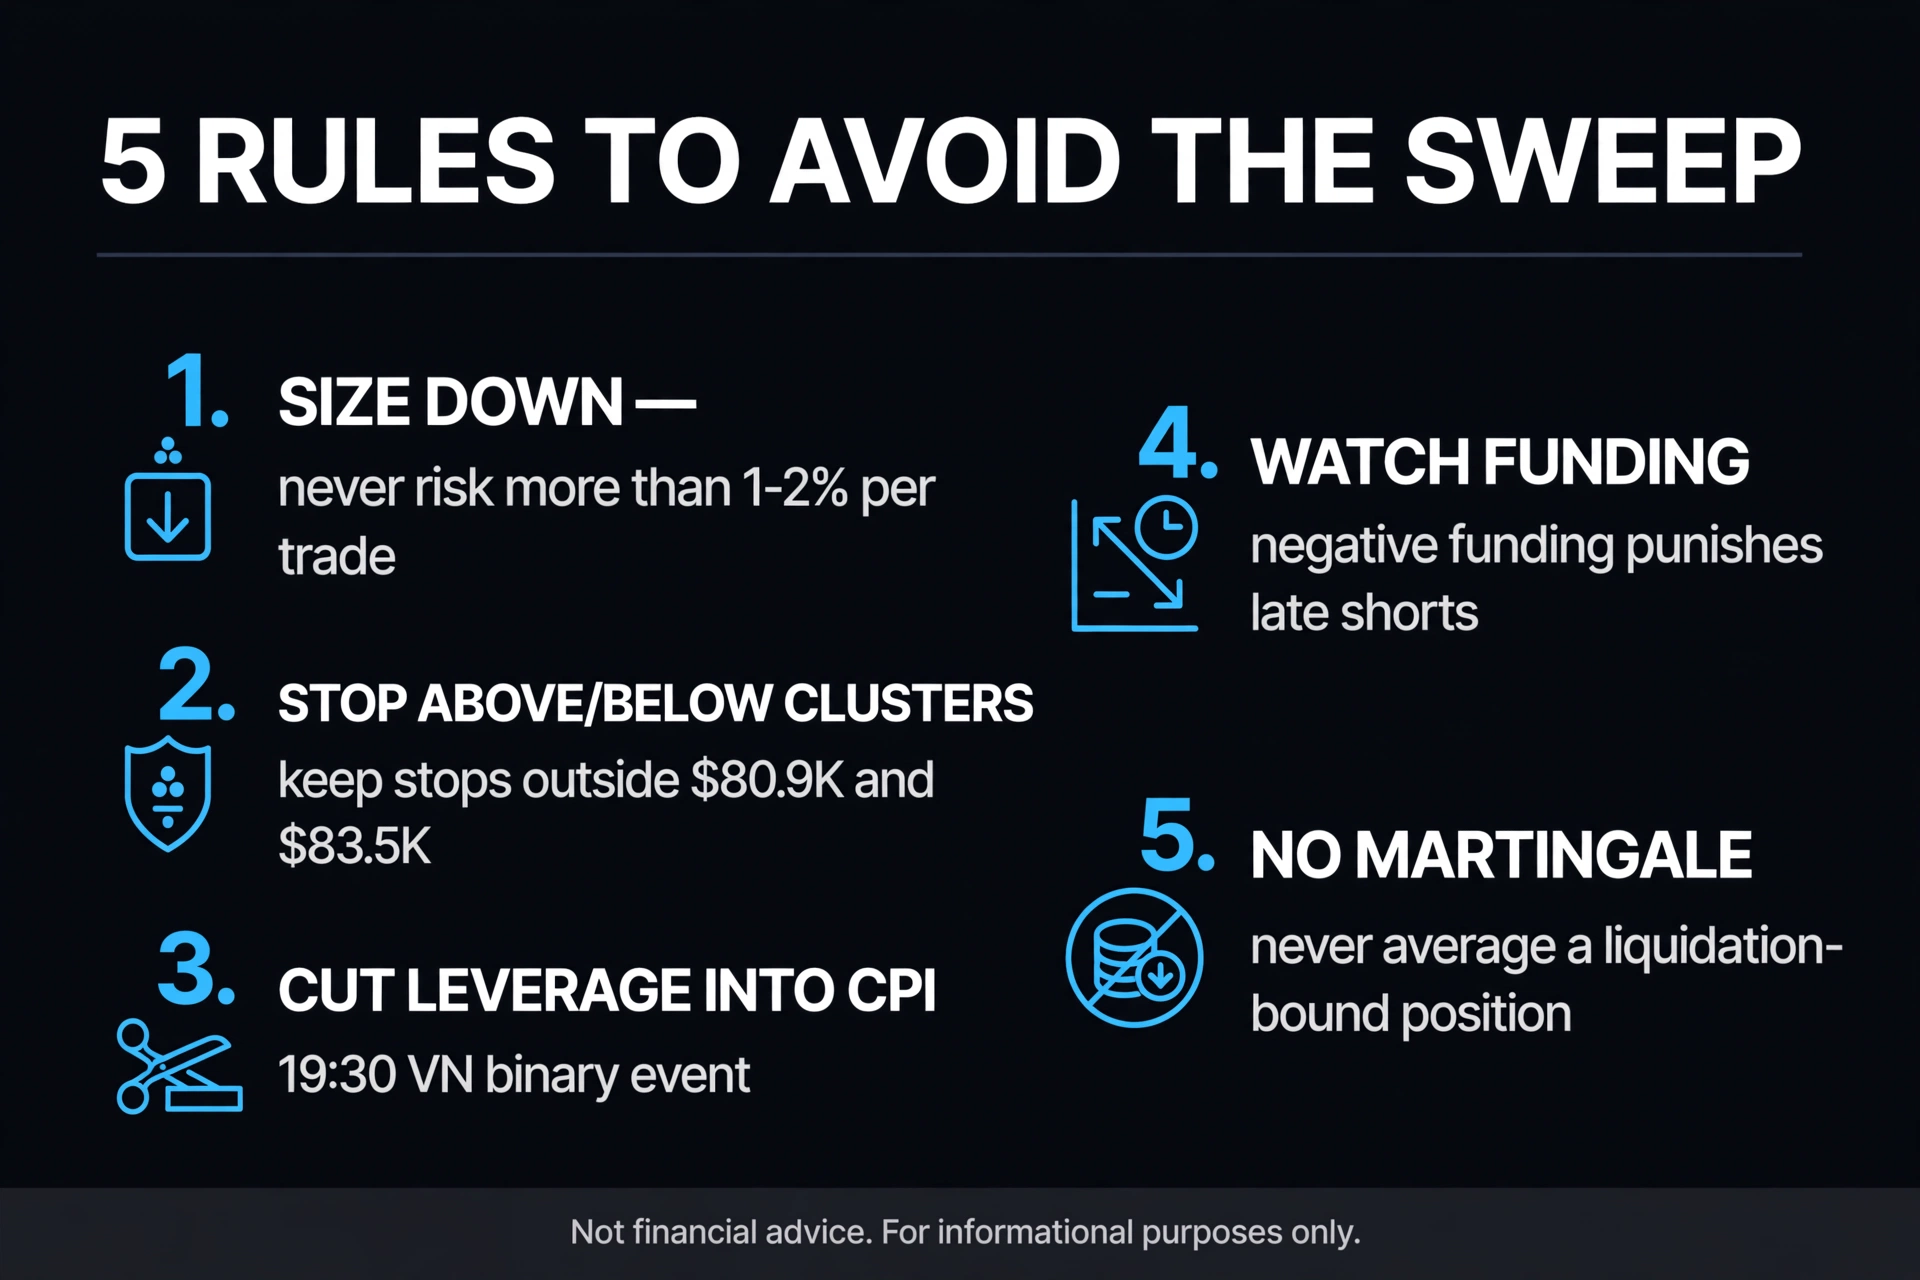
Five execution rules to avoid getting swept in sudden liquidation cascades.
Five Rules to Avoid Getting Swept
From all of the above, here are the practical rules:
1. Never hold high leverage through a binary event. CPI, FOMC, Nonfarm Payrolls — events that can move price 3–5% in minutes are “no-go zones” for leverage above 5x. If you want directional exposure, use spot or options instead of leveraged futures.
2. Place stop-losses OUTSIDE heatmap clusters, not inside. If the long liquidation cluster is at $80,900, don’t set your stop at $80,850 — you’ll get swept with the crowd. Set it at $80,500 or lower (if you accept the risk), or exit entirely before the event.
3. Read funding before entering. If funding is highly positive (+0.05%+), longs are overcrowded — don’t add longs. If deeply negative, shorts are overcrowded — beware the squeeze. Current -0.0010% is near neutral, but the negative drift shows shorts accumulating.
4. Reduce size when OI is abnormally high. OI at 92,362 BTC is elevated. High OI + major event incoming = cascade formula. Kelly criterion: if you normally risk 2% per trade, cut to 0.5–1% before CPI.
5. After a cascade, don’t rush to “buy the dip” with leverage. Yesterday $771 million was wiped. Those who dip-bought with leverage right after the cascade often get swept in the second wave. Wait for funding to reset, OI to stabilize, and price structure to confirm a bottom — usually hours, sometimes days.
Conclusion: Heatmaps Don’t Predict Price, They Predict Pain
A liquidation heatmap is not a price prediction tool. It won’t tell you whether Bitcoin goes up or down. It tells you where it will hurt most if price moves that way — and where the crowd is piled up.
Tonight at 19:30, CPI picks the direction. The $82,800–$83,500 cluster and the $80,900 cluster are waiting. Negative funding shows shorts are betting on hot. OI at 92,362 BTC shows there’s still enough “fuel” for another cascade — in either direction.
The trader who reads the heatmap isn’t the one who guesses right. It’s the one who’s not standing where the sweep hits. Tonight, make sure that’s you — or better yet, stand aside and watch.
⚡ Track Real-Time Liquidation Telemetry on CoinXSight
Monitor real-time liquidation clusters, dynamic funding rates, and spot orderbook absorption depth directly on the CoinXSight Quant Terminal.
Disclaimer: This article is for informational and educational purposes only and does not constitute financial, investment, or trading advice. Digital asset markets carry high volatility and capital risk. Always conduct your own research (DYOR) before making financial decisions.
CX
cxs_admin
ANALYST // RESEARCH
Institutional Analyst·CoinXSight Alpha Desk
CoinXSight Institutional Research Desk produces quantitative crypto market intelligence, algorithmic models, and on-chain forensics.
QUANTITATIVE SUITE // DEEP ALPHA ENGINEACTIVE
BTC/USDT // LIVE SCANNER
CONFLUENCE 100
LIVE SPOT PRICE$82,606.01STRONG_BUY
TP2
$90,642.48
+9.94%
TP1
$85,726.41
+3.98%
ENTRY
$82,449.02
ZONE
SL
$80,810.33
-1.99%
Auto-detect Order Blocks, Fair Value Gaps and risk-adjusted DCA ladders in < 5s.
Comprehensive institutional valuation model for XRP (2026–2030): RLUSD stablecoin utility, ETF adoption catalysts, and multi-tier price scenarios from .40 to…