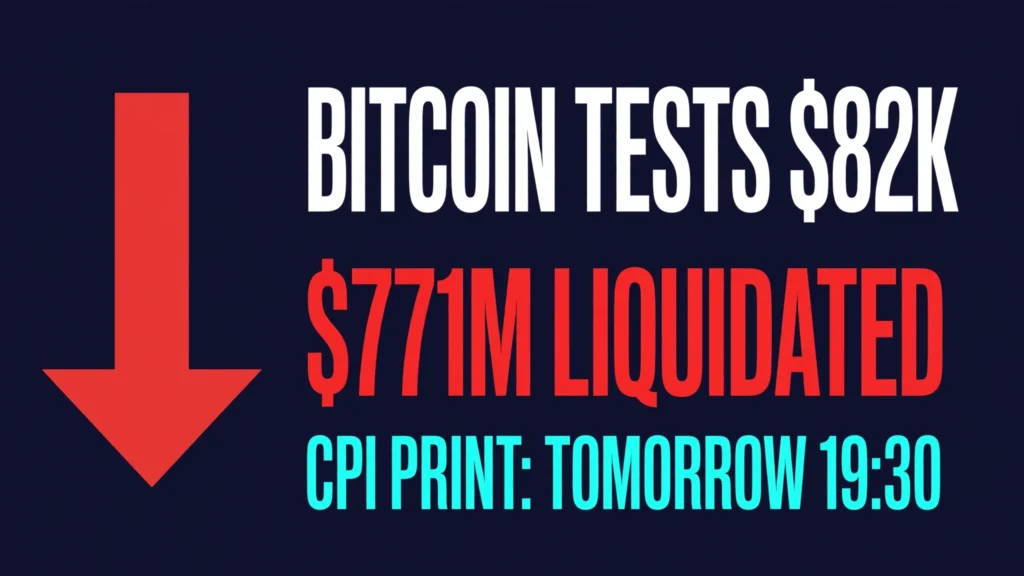
Bitcoin is trading around $82,000 on Tuesday, caught between a $771 million liquidation cascade and Wednesday’s CPI print. But the headline number hides a more interesting story: a violent $120 million flush that happened in just 15 minutes, inside a broader 24-hour unwind that wiped out leveraged longs across the entire crypto market.
Both numbers are real. They measure different things. And understanding the difference tells you exactly where this market stands — and what tomorrow’s inflation data will decide.
The Two Numbers That Tell One Story
Let’s clear up the confusion first, because it matters.
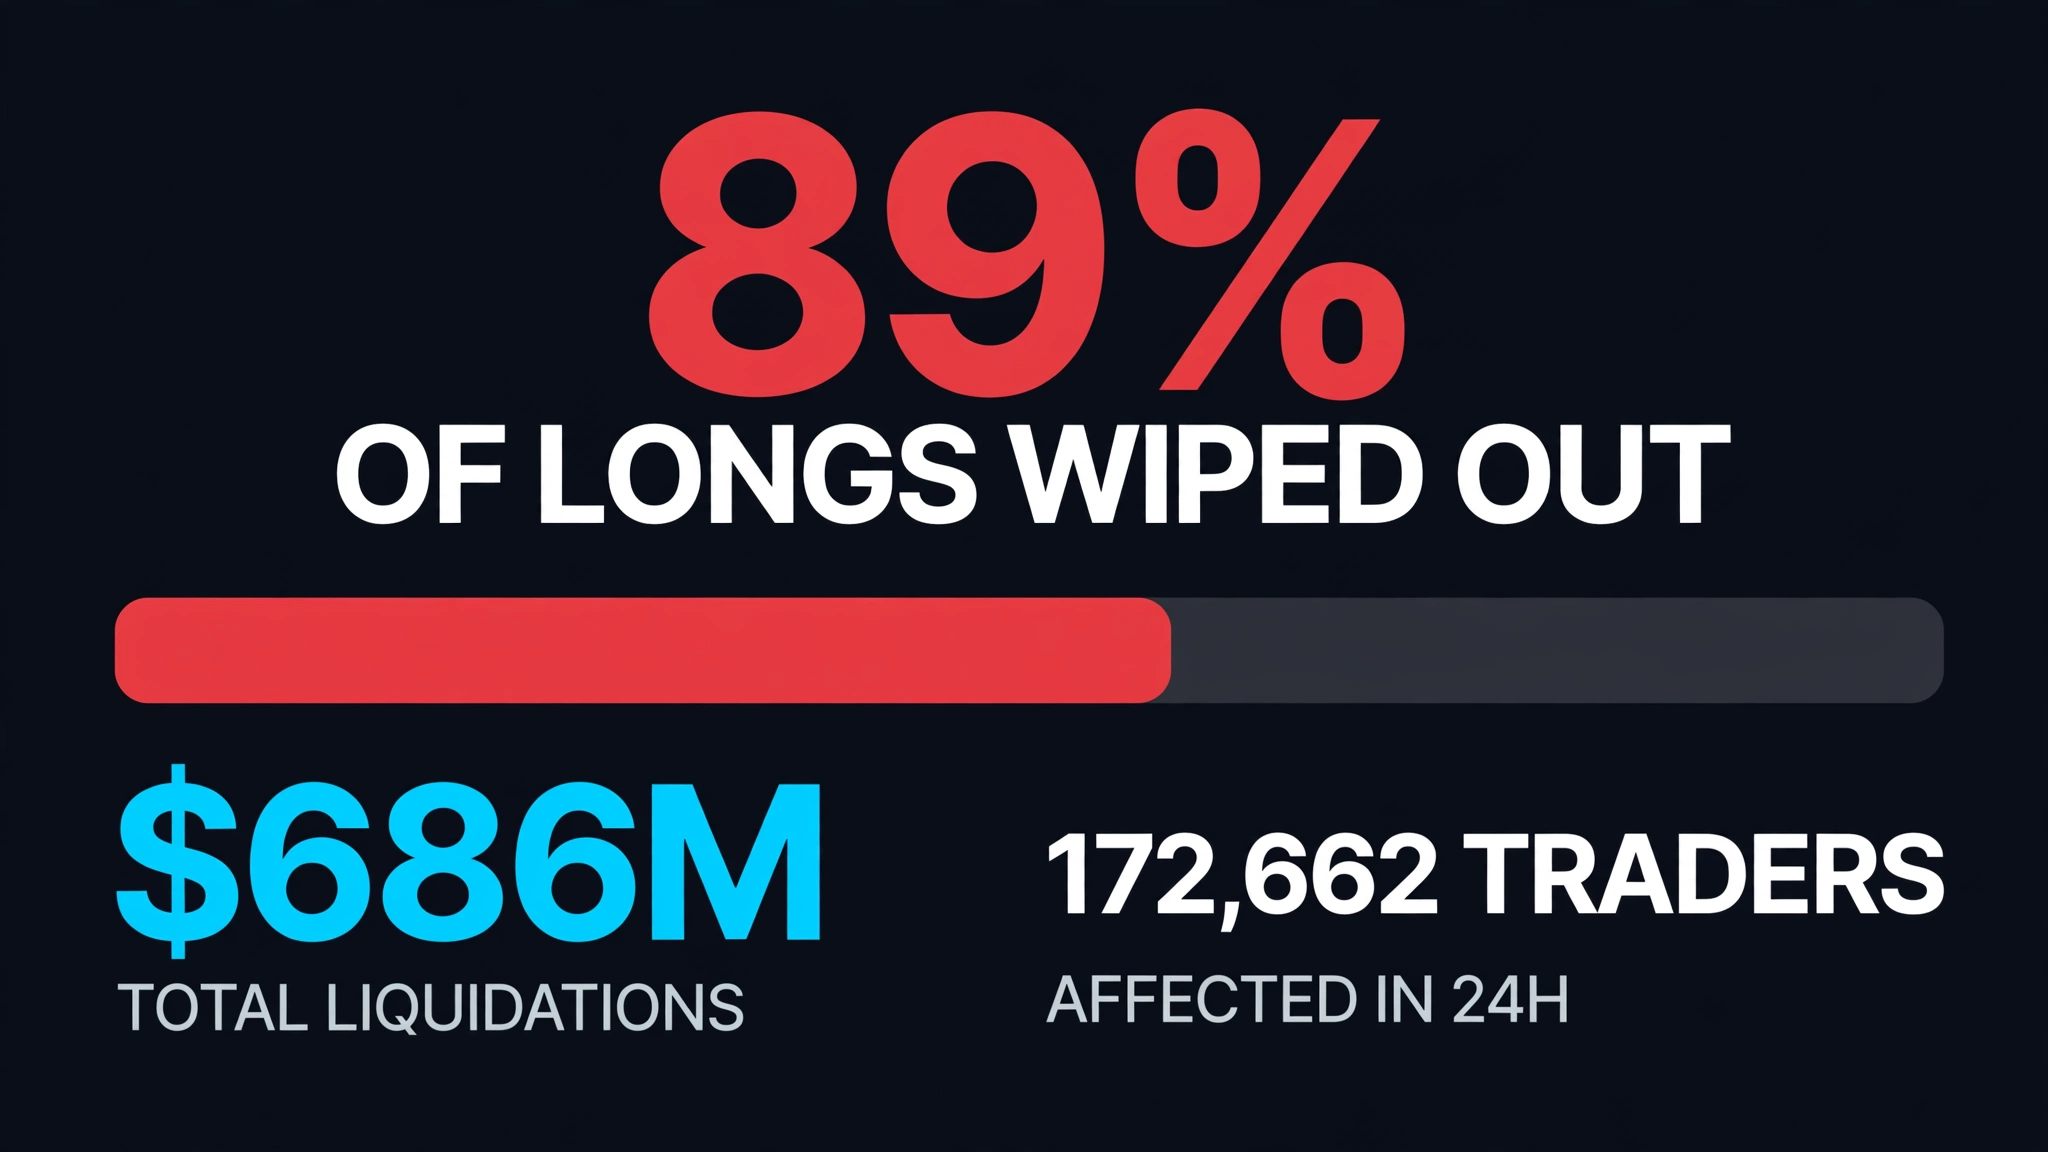
$771 million is the total crypto liquidation figure over the past 24 hours, per CoinGlass data via The Block. Longs absorbed $686 million of it — 89% — across 172,662 traders. Bitcoin-only liquidations hit $160.5 million. Ethereum added $169.2 million. Solana contributed $60.4 million. The single largest casualty was a $9.65 million BTC long on Binance, closed out at $81,772.
$120 million was the 15-minute long cascade — a concentrated burst of forced selling that hit when Bitcoin broke below a key intraday level. Think of it as the epicenter of the earthquake, while $771 million measures the total damage across the full day.
This distinction isn’t academic. A 15-minute $120M cascade means the market’s leverage was stacked so tightly that a single break triggered an avalanche. That’s a positioning story, not just a price story. The $771M 24-hour figure tells you the avalanche kept rolling as Asia woke up to the KOSPI chip selloff and macro headwinds piled on.
Anatomy of the Cascade
CoinGlass Telemetry: $771M in liquidations across derivatives markets in the past 24 hours ($120M in 15-minute epicenter).
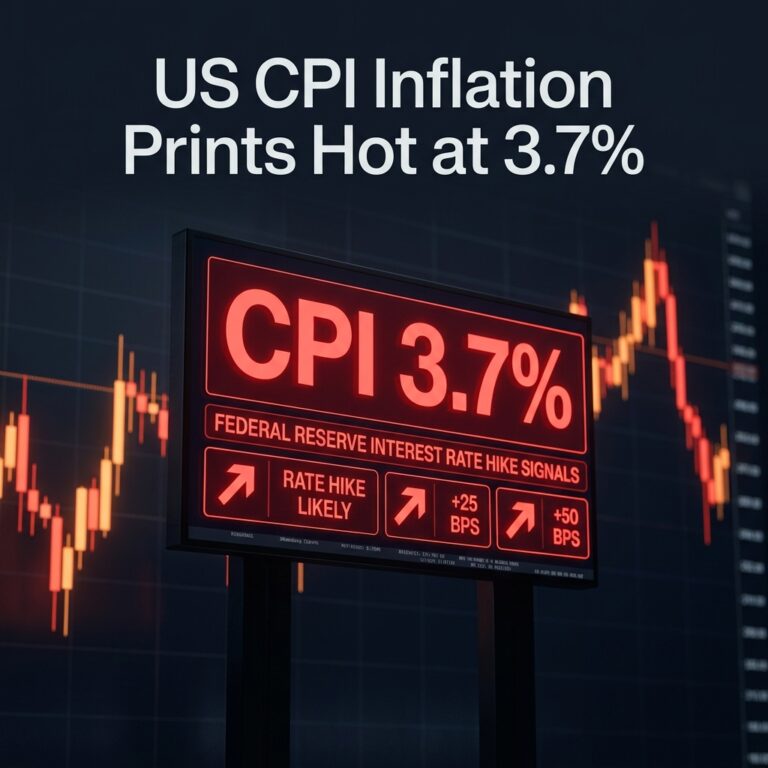
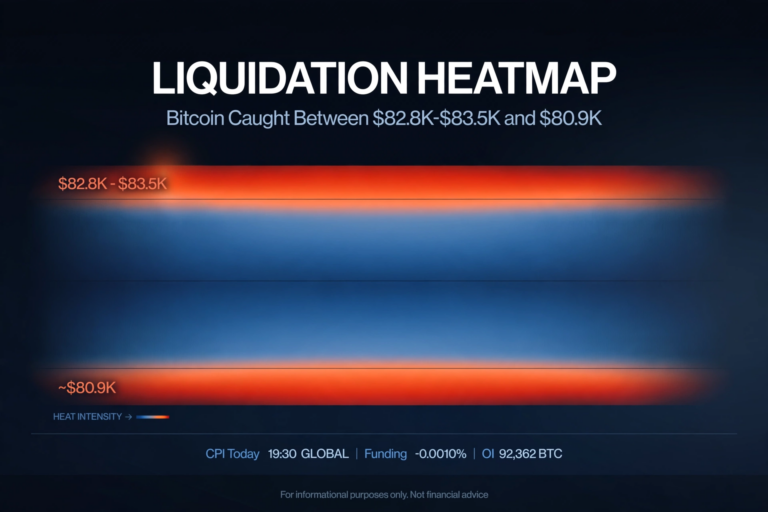
The liquidation heatmap tells the story in sequence. Bitcoin opened the day around $84,200 — already below the $82,800–$85,500 base-case band from last week’s outlook, but holding. The first cracks appeared as US traders digested two things: September CPI consensus firming at 3.7% (hotter than the 3.6% priced last week), and spot Bitcoin ETF outflows of $681 million last week — the worst since June.
When BTC slipped under $83,000, the 15-minute cascade fired. $120 million in longs liquidated in a quarter-hour. That’s not normal market selling — that’s stop-loss orders and margin calls triggering each other in a feedback loop. Each forced sale pushed price lower, which triggered the next batch of liquidations.
The 24-hour low printed $80,942.80 — landing inside the long-liquidation cluster at $80,900–$80,100 that quant models had flagged as the danger zone. Max pain for this week’s options expiry sits at $80,000. The market essentially traded itself into its own warning level, then bounced.
Binance handled 51.9% of all liquidations, confirming this was a retail-leverage event more than an institutional one. The pros were de-risking ahead of CPI; the retail longs were the ones caught.
Funding Reset: The Leverage Wash
Here’s the silver lining in the wreckage: funding rates have reset to +0.0067%.
For the uninitiated, funding rates are the periodic payments between longs and shorts in perpetual futures markets. When funding is high and positive, it means longs are crowded — everyone’s betting on higher prices, paying shorts to hold their positions. It’s a contrarian indicator: extreme positive funding often precedes corrections.
Coming into this week, funding was neutral-to-positive. Not extreme, but enough to indicate that longs kept adding even as spot stalled below $84,200 resistance. The cascade flushed that positioning. At +0.0067%, funding is now essentially neutral — the market isn’t crowded long anymore.
This matters for what comes next. A neutral funding rate means there’s no structural headwind from overleveraged longs. If CPI surprises to the dovish side, there’s actually room for fresh longs to pile in without immediately hitting the kind of positioning extreme that causes cascades. The wash created space.
Open Interest: 8.5% of Leverage Flushed
Open interest — the total value of outstanding futures contracts — now sits around 93,192 BTC. The cascade flushed approximately 8.5% of leveraged positioning.
An 8.5% OI flush in 24 hours is significant but not catastrophic. For context, last week’s broader market stress saw larger percentage drops. What makes this flush notable isn’t the size — it’s the speed and concentration. Most of the damage happened in that 15-minute window, which means the leverage was concentrated at specific price levels rather than spread evenly.
This is actually healthier than a slow bleed. A fast flush clears weak hands quickly and establishes a cleaner positioning base. The market now has less leverage to unwind, which reduces the risk of a second cascade on similar magnitude — unless CPI delivers a genuine shock.
The key level to watch: if open interest starts rebuilding aggressively above $83,000 before CPI, that’s a sign traders are re-leveraging into the binary event. That would recreate the conditions for another cascade, just in the opposite direction if CPI surprises dovish.
On-Chain: What the Blockchain Says
While derivatives were detonating, on-chain data told a calmer story. Exchange inflows — the metric that tracks Bitcoin moving onto exchanges (typically a precursor to selling) — didn’t spike to panic levels. This wasn’t holders rushing for the exits; it was leveraged traders getting force-closed.
The distinction matters enormously. Spot selling by long-term holders would signal a fundamental reassessment. Derivatives liquidations signal a positioning cleanse. The blockchain is saying: the underlying bid hasn’t broken, but the leverage on top of it just got reset.
Whale wallet activity remained relatively stable through the cascade. The $150K–$250K buy blocks that defended $83,605 last week haven’t reappeared at these levels yet — which explains why each liquidation wave pushed deeper without a floor. But neither have we seen whale distribution (large transfers to exchanges), which would be the bearish on-chain signal.
The CPI Binary: Three Scenarios for Wednesday
September CPI prints Wednesday at 19:30 VN (8:30 AM ET). Consensus has firmed at 3.7% year-over-year, with core at 2.5%. Here are the three paths:
Cool print (below 3.6%) — the squeeze scenario. This would be a genuine surprise against 3.7% consensus. With funding reset to neutral and 8.5% of leverage already flushed, there’s minimal overhead resistance to a sharp rally. The $86,800–$87,700 short-liquidation cluster becomes the magnet, with the $90,000 call wall beyond it. A cool print turns today’s oversold bounce into a short squeeze. Probability: roughly 20–25%.
In-line (3.6%–3.8%) — the chop scenario. The market breathes a sigh of relief that it wasn’t worse, but there’s no catalyst for a directional move. Bitcoin likely grinds between $81,000 and $84,000 into the October 28–29 FOMC meeting. This is the highest-probability outcome at roughly 50%. Boring, but boring is what healthy markets do after a leverage wash.
Hot print (above 3.8%) — the breakdown scenario. This turns today’s warning into a confirmed breakdown. The $80,900 level (top of the long-liq cluster) breaks, max pain at $80,000 gets tested, and the cascade dynamics from today repeat with fresh fuel. US 10-year yields are already at 24-year highs; a hot CPI print would push rate-hike expectations higher and punish every risk asset. Probability: roughly 25–30%.
Contagion: ETH, SOL, XRP Bleed Too
Bitcoin didn’t suffer alone. The large-cap complex took proportional damage, and in some cases worse:
Ethereum fell 4.6% to $2,425, with $169.2 million in liquidations — actually exceeding Bitcoin’s $160.5M. That’s notable: ETH leverage was more extended than BTC’s. ETH is now testing the bottom of its $2,480–$2,580 range, and a break below $2,400 opens the long-liquidation cluster underneath.
Solana dropped 7.5% to $103.62, with $60.4 million liquidated (94.2% longs). SOL’s higher beta to BTC means it amplifies every move — up and down. The liquidation percentage (94% longs) shows SOL traders were even more one-sided than BTC traders.
XRP slid 6.4%, caught between the broad market selloff and profit-taking after its recent ETF-driven strength. The 13-week inflow streak provides a structural bid, but even structural bids pause during leverage cascades.
Zcash was the worst performer among top-10 assets, down 10.4% to $1,149 — a reminder that lower-liquidity altcoins face exaggerated moves during risk-off episodes.
The pattern is consistent: the more leveraged the positioning, the deeper the drawdown. ETH’s higher liquidation total relative to BTC confirms that altcoin leverage was the real excess in this market, not Bitcoin leverage.
The Macro Backdrop Nobody Can Ignore
This isn’t happening in a vacuum. Three macro forces are pressing on crypto:
First, Treasury yields at 24-year highs. The US 10-year is making bonds increasingly attractive relative to non-yielding assets like Bitcoin. Every basis point higher in yields is a marginal headwind for crypto valuations.
Second, Middle East escalation. Houthi attacks on Saudi airports have killed at least 20 people in a week, including a US national. President Trump has said the US may join Saudi Arabia’s offensive. Geopolitical risk premium is flowing into oil (Brent near two-week highs) and out of risk assets.
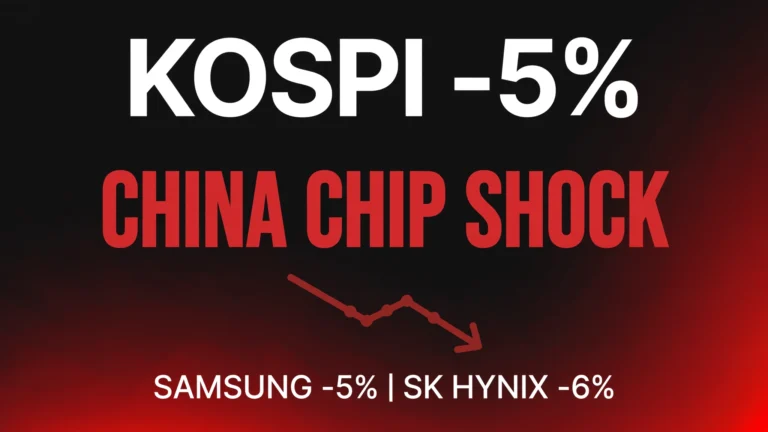
Third, Asian equity stress.South Korea’s KOSPI shed 5% today on China’s CXMT chip breakthrough, with Samsung down 5% and SK hynix down 6%. When Asia’s most tech-heavy major market drops 5% in a day, the risk-off sentiment bleeds into crypto leverage — which is exactly what the liquidation data shows.
Add in $681 million in weekly Bitcoin ETF outflows (worst since June) and $542 million in Ethereum ETF outflows, and the institutional bid that supported crypto through the summer is clearly pausing.
What to Watch
Four things will determine the next 48 hours:
1. $80,900. The top of the long-liquidation cluster. Hold it into CPI, and the market has a base. Lose it, and $80,000 max pain is the next stop.
2. Funding rate direction. If funding stays near +0.0067% or goes slightly negative, positioning is clean. If it spikes positive quickly, traders are re-leveraging into CPI — recreating cascade risk.
3. ETF flows today and tomorrow. Last week’s $681M outflow was the warning. If outflows accelerate into CPI, the institutional bid is genuinely retreating, not just pausing.
4. The CPI print itself. 3.7% is the line. Below 3.6%: squeeze. Above 3.8%: breakdown. Between: chop.
The $120 million 15-minute cascade and the $771 million 24-hour total are now both in the rearview mirror. What matters is whether the market learned its lesson about leverage into binary events — or whether it’s already rebuilding the same trap for the next one.
⚡ Track Live Derivatives Telemetry on CoinXSight
Monitor real-time liquidation cascades, cumulative volume delta (CVD), and orderbook depth absorption directly on the CoinXSight Quant Terminal.
Disclaimer: This article is for educational and informational purposes only and does not constitute financial, investment, or trading advice. Digital asset markets involve significant volatility and capital risk. Always conduct independent research before making financial decisions.
AT
Alex Thorne
MACRO // LEAD
Head of Macro & Market Structure·Global Macro Desk
Former institutional FX and macro derivative analyst. Specializes in global liquidity cycles, central bank balance sheets, and crypto market microstructure.
QUANTITATIVE SUITE // DEEP ALPHA ENGINEACTIVE
BTC/USDT // LIVE SCANNER
CONFLUENCE 100
LIVE SPOT PRICE$82,606.01STRONG_BUY
TP2
$90,642.48
+9.94%
TP1
$85,726.41
+3.98%
ENTRY
$82,449.02
ZONE
SL
$80,810.33
-1.99%
Auto-detect Order Blocks, Fair Value Gaps and risk-adjusted DCA ladders in < 5s.
Comprehensive institutional valuation model for XRP (2026–2030): RLUSD stablecoin utility, ETF adoption catalysts, and multi-tier price scenarios from .40 to…