For thirteen weeks, the bid never stopped. Every week since early July, money flowed into U.S. spot XRP ETFs — through the summer chop, through the September CPI print, through every Bitcoin wobble. It was the most reliable demand story in crypto this year.
It’s over.
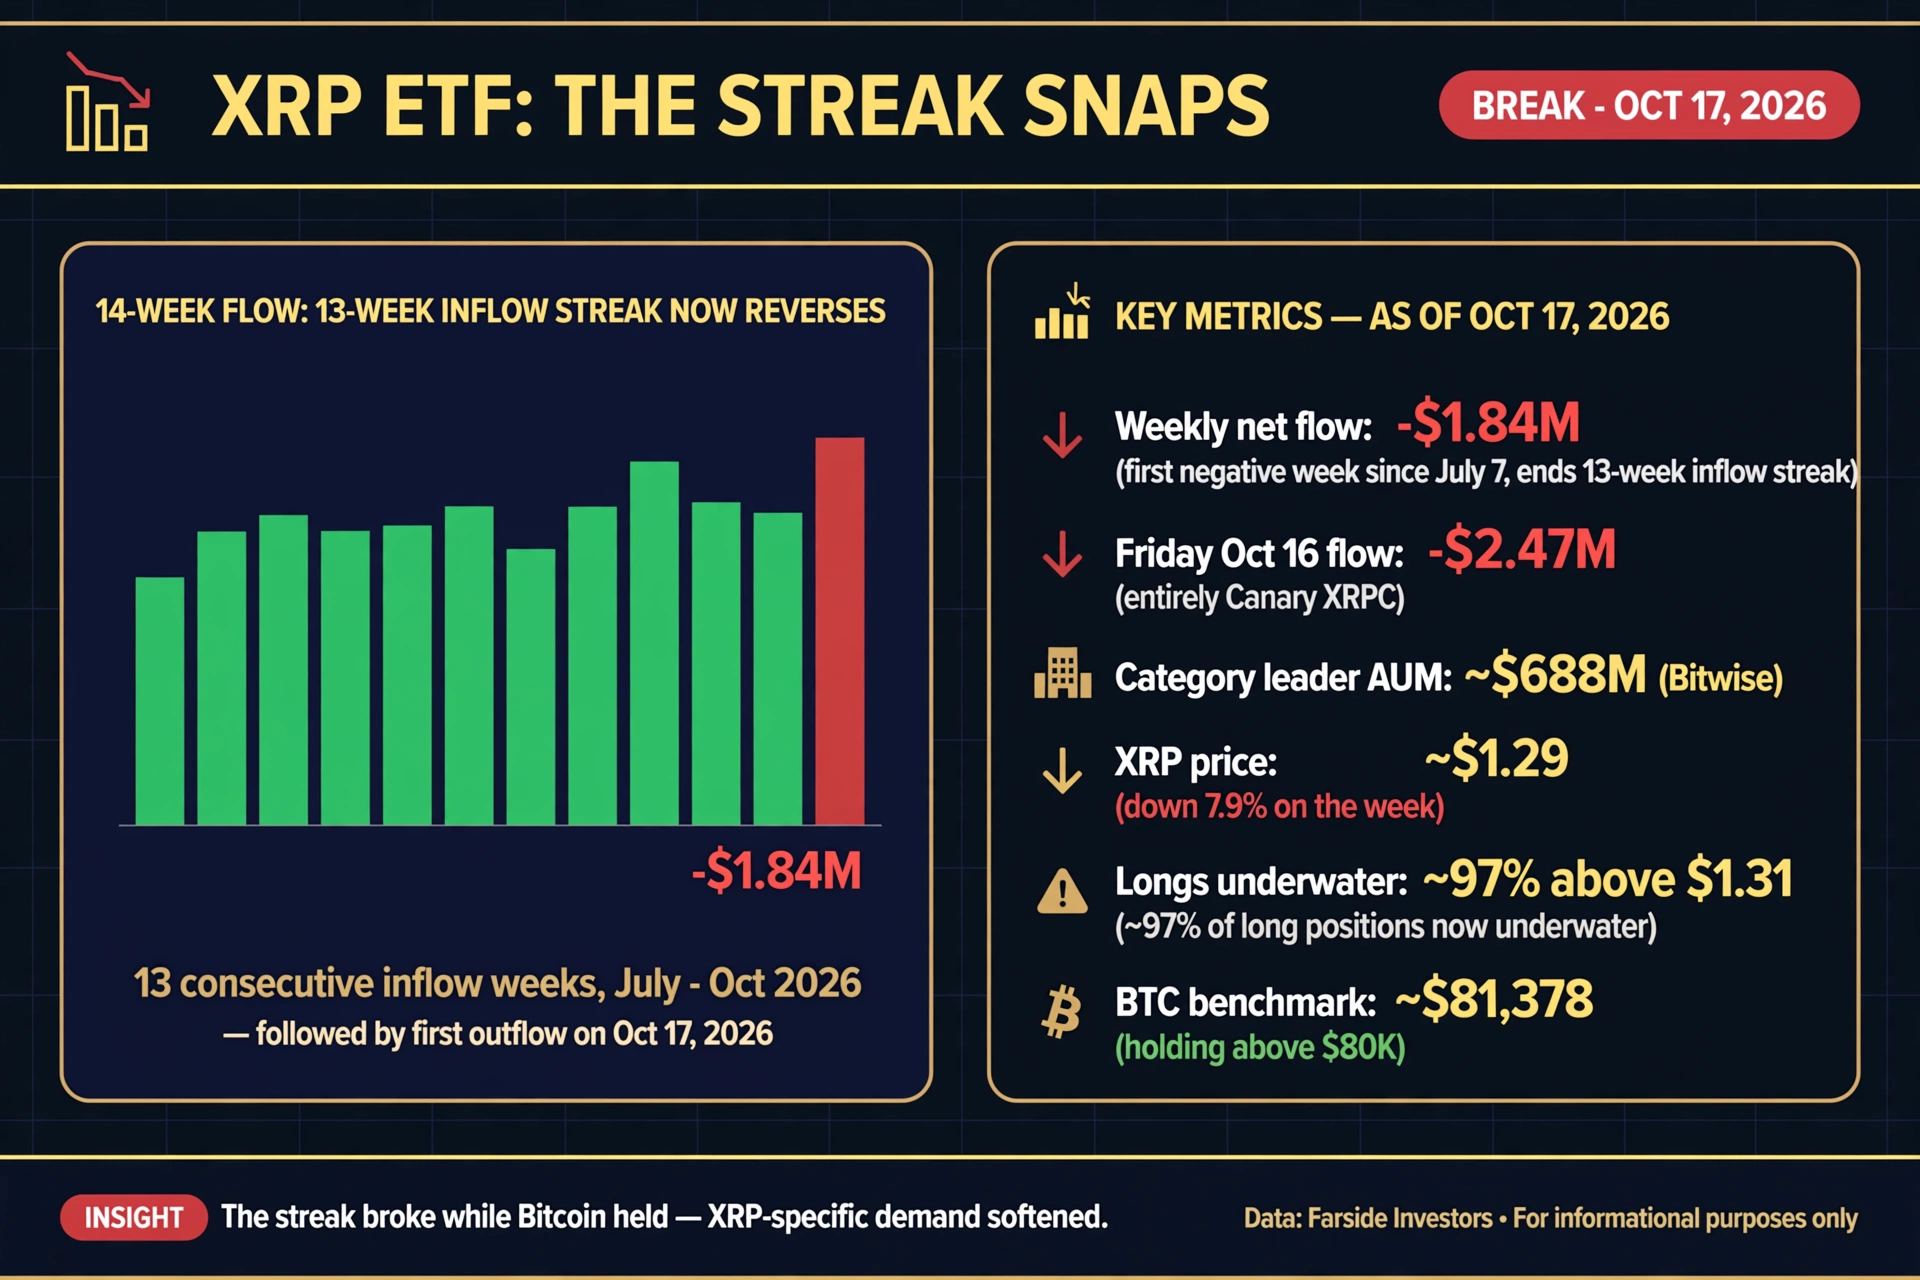
The week ending October 17 recorded -$1.84 million in net outflows — the first negative week for U.S. spot XRP ETFs since July 7. Friday’s session did most of the damage: -$2.47 million, all of it from Canary’s XRPC. Thirteen weeks of uninterrupted inflows, snapped in a single week. The question isn’t whether the streak ended. It’s whether this is a pause or a reversal — and what it will take to get the bid back.
What the tape actually shows
Figure 1: XRP ETF 13-week inflow streak snaps with -$1.84M weekly net flow as Bitcoin holds above $80K.
Before anyone panics, some perspective on scale. The weekly outflow of -$1.84 million is a rounding error against the category’s asset base — Bitwise alone leads with roughly $688 million in XRP ETF assets. After thirteen weeks of accumulation, one soft week doesn’t unwind the structure.
But streaks matter because they shape positioning. Here’s the full picture:
Metric
Reading
Context
Weekly net flow (to Oct 17)
-$1.84M
First negative week since July 7; ends 13-week inflow streak
Friday Oct 16 flow
-$2.47M
Entirely Canary XRPC; intra-week saw small offsets
Category leader AUM
~$688M (Bitwise)
Outflow is ~0.3% of leader’s assets — not a structural exit
XRP price
~$1.29
-7.9% on the week; testing $1.29–$1.30 support
Longs underwater
~97% above $1.31
Nearly all net-long positioning is red
BTC (benchmark)
~$81,378
Holding above $80K; the streak broke without a BTC breakdown
The critical detail: the streak broke while Bitcoin held. This wasn’t contagion from a BTC breakdown. XRP-specific demand softened while the broader market stayed intact. That makes the signal cleaner — and harder to dismiss as macro noise.
Profit-taking or rotation?
Two readings, and the truth is probably a blend.
The profit-taking case. Thirteen consecutive weeks of inflows means thirteen weeks of buyers, and a good portion of them are sitting on gains or at least breakeven. XRP ran from the summer lows to test $1.40 in mid-October before giving it back. Some of that ETF demand was momentum-chasing, and momentum money reverses fast. A -$1.84M week after that kind of run looks like textbook consolidation — weak hands from the latest leg taking profits into a soft tape.
The rotation case. Look at where the money went instead. Bitcoin ETFs saw their own whiplash this week — a -$261.4M Wednesday followed by a flat +$5.06M Thursday. The whole ETF complex is churning, not trending. With the FOMC decision landing October 28 (markets now pricing ~84.5% odds of a hold) and a stacked macro calendar ahead, some allocators are simply de-risking into the event. XRP, as the higher-beta ETF exposure, gets sold first.
The honest answer: the flow data alone can’t distinguish between the two. What it can tell us is that the marginal buyer stepped back — and with 97% of net-long XRP positions underwater above $1.31, there’s no natural dip-buyer waiting underneath. The next catalyst has to come from outside the flow data.
The price chart agrees: no bid underneath
XRP at $1.29 is sitting on a ledge. The $1.29–$1.30 zone has been tested repeatedly, and each test has held — barely. But the structure above is all overhead supply: everyone who bought the $1.31–$1.40 range in the last month is underwater, and underwater longs become sellers on every bounce.
This is the mechanical consequence of a broken inflow streak. For thirteen weeks, ETF demand absorbed selling pressure and kept the bid firm. Remove that bid, and the market has to find its own clearing price. Right now it’s searching — and the search is happening with leveraged longs already trapped.
The derivatives picture reinforces it. Funding has stayed relatively neutral, which means this isn’t a short-squeeze setup or a crowded-long flush in progress. It’s quieter and more corrosive than that: a slow bleed of demand with no forced buyers on either side.
Why now: the macro calendar explains the timing
Zoom out and the timing makes sense. This is the quiet week before the storm:
October 23: Flash PMIs — the last real data before the Fed goes dark
October 27–29: Ripple Swell in New York, overlapping the FOMC
October 28: FOMC decision (~01:00 VN on the 29th), 84.5% priced for a hold
October 29: Q3 GDP advance + September PCE, same day
Nobody wants to be the marginal buyer of a high-beta altcoin ETF heading into a double-barreled macro week. The outflow is rational de-risking as much as it is anything XRP-specific. If the FOMC holds and the data cooperates, the bid can come back fast — ETF flows have shown they respond to all-clear signals within days, not weeks.
What Swell has to deliver
Here’s where it gets interesting. The streak broke ten days before the most important XRP catalyst of the year. Ripple Swell 2026 — October 27–29 in New York, the first combined Swell + XRPL Apex + UBRI Connect, 100+ speakers, 1,500+ attendees — lands right in the middle of the FOMC decision.
The conference program reads like a direct response to the flow data. A dedicated session reviewing the first year of U.S. spot XRP ETFs. David Schwartz on the XRPL roadmap. RWA tokenization, bank-grade stablecoins, post-quantum security on the agenda. Raghuram Rajan opening the institutional summit on October 27.
What the bid needs from Swell is simple: a reason for the next thirteen weeks. The first streak was built on the novelty of ETF access and steady institutional onboarding. The second leg — if there is one — needs a fundamental catalyst: real RWA volume on XRPL, a credible stablecoin story, or regulatory clarity that expands the buyer base beyond crypto-native allocators.
The stablecoin angle deserves particular attention. RLUSD’s institutional push — Standard Chartered custody, Privy embedded wallets, LMAX’s $150M facility — gives Swell a concrete product story to tell, not just a roadmap. ETF allocators who sat out the first thirteen weeks because XRP lacked a yield or utility narrative beyond speculation may find a very different pitch this time. If Swell can connect the ETF wrapper to on-chain utility — settlement volume, RWA issuance, stablecoin velocity — the flow story gets a second engine.
Without that, Swell is just a conference. With it, the -$1.84M week becomes the footnote before the next leg.
The bottom line
Thirteen weeks of inflows built a floor under XRP. One week of outflows didn’t destroy it — but it exposed how much of the price structure was flow-dependent. With 97% of longs underwater and no dip-bid in sight, XRP is now trading on catalysts, not flows.
The calendar delivers them in ten days: Swell, the FOMC, GDP, and PCE, all within 72 hours of each other. That’s either the setup for a sharp reversal or the confirmation that the rotation is real. The ETF flow data will tell us which — watch next Friday’s print. If the outflows deepen into a second week, the streak isn’t pausing. It’s over, and the market will need to find a new reason to own XRP.
—
Disclaimer: This analysis is provided for educational and informational purposes only and does not constitute financial, investment, or legal advice. Digital asset markets involve substantial uncertainty and capital risk. Always conduct your own independent research (DYOR) before making investment decisions.
CX
CoinXSight Alpha Desk
ALPHA // DESK
Quantitative Research Desk·Global Alpha Division
CoinXSight Institutional Research Desk produces quantitative crypto market intelligence, algorithmic models, and on-chain forensics.
QUANTITATIVE SUITE // DEEP ALPHA ENGINEACTIVE
BTC/USDT // LIVE SCANNER
CONFLUENCE 100
LIVE SPOT PRICE$82,617.68STRONG_BUY
TP2
$90,817.78
+10.15%
TP1
$85,796.52
+4.06%
ENTRY
$82,449.02
ZONE
SL
$80,775.27
-2.03%
Auto-detect Order Blocks, Fair Value Gaps and risk-adjusted DCA ladders in < 5s.